The median household income in Fort Clark Springs, TX in 2022 was $68,895, which was 4.9% less than the median annual income of $72,284 across the entire state of Texas. Compared to the median income of $28,320 in 2000 this represents an increase of 58.9%. The per capita income in 2022 was $42,048, which means an increase of 63.5% compared to 2000 when it was $15,350.
Whole page based on the data from 2000 / 2022 when the population of Fort Clark Springs, Texas was 1,228 / 1,333
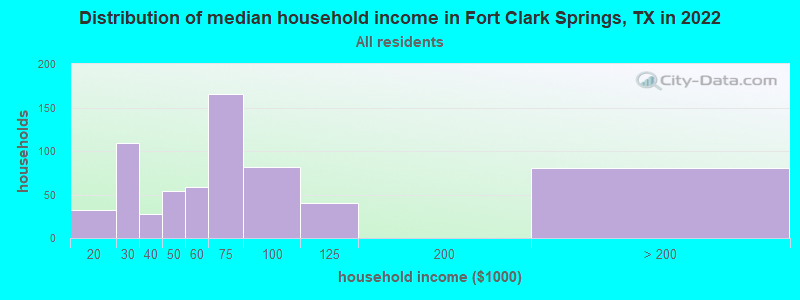
Income statistics for all residents
Median household income in Fort Clark Springs, TX in 2022:
Fort Clark Springs:
$68,895
State:
$72,284
Change in median household income between 2000 and 2022:
Fort Clark Springs, Texas:
+143.3%
State:
+81.0%
Number of households with income < $10k:
Fort Clark Springs:
0.0% (0)
State:
5.5% (611,011)
Number of households with income $10k - 20k:
Fort Clark Springs:
4.9% (32)
State:
6.7% (743,157)
Number of households with income $20k - 30k:
Fort Clark Springs:
16.7% (109)
State:
7.2% (803,381)
Number of households with income $30k - 40k:
Fort Clark Springs:
4.3% (28)
Texas:
7.8% (866,080)
Number of households with income $40k - 50k:
Fort Clark Springs:
8.3% (54)
State:
7.3% (810,440)
Number of households with income $50k - 60k:
Fort Clark Springs:
9.1% (59)
State:
7.2% (799,783)
Number of households with income $60k - 75k:
Fort Clark Springs:
25.5% (166)
State:
9.9% (1,095,384)
Number of households with income $75k - 100k:
Fort Clark Springs:
12.6% (82)
State:
12.8% (1,419,057)
Number of households with income $100k - 125k:
Fort Clark Springs:
6.1% (40)
State:
9.5% (1,054,577)
Number of households with income $125k - 150k:
Fort Clark Springs:
0.0% (0)
State:
6.7% (741,518)
Number of households with income $150k - 200k:
Fort Clark Springs:
0.0% (0)
State:
8.7% (961,776)
Number of households with income > $200k:
Fort Clark Springs:
12.4% (81)
State:
10.7% (1,181,544)
Aggregate household income in Fort Clark Springs in 2022: $48,351,424
Median family income in Fort Clark Springs in 2022:
Fort Clark Springs:
$69,253
Texas:
$86,267
Number of families with income $10k - 20k:
Fort Clark Springs:
10.8% (32)
State:
4.3% (324,514)
Number of families with income $30k - 40k:
Fort Clark Springs:
9.0% (26)
State:
6.6% (493,535)
Number of families with income $50k - 60k:
Fort Clark Springs:
11.0% (32)
Texas:
6.6% (492,203)
Number of families with income $60k - 75k:
Fort Clark Springs:
55.6% (162)
State:
9.5% (710,229)
Number of families with income $100k - 125k:
Fort Clark Springs:
13.6% (40)
State:
10.7% (797,961)
Median income for 2 person families:
Fort Clark Springs:
$68,391
State:
$76,712
Median income for families with 0 earners:
Fort Clark Springs:
$66,998
Texas:
$41,529
Median income for families with 1 earner:
Fort Clark Springs:
$0
State:
$59,030
Median income for families with 2 earners:
Fort Clark Springs:
$0
State:
$111,348
Median income for families with 3+ earners:
Fort Clark Springs:
$0
State:
$132,976
Median per capita income in Fort Clark Springs in 2022:
Fort Clark Springs:
$42,049
Texas:
$38,123
Income statistics for White residents
Median household income in Fort Clark Springs, TX in 2022:
Fort Clark Springs:
$71,260
State:
$82,032
Change in median household income between 2000 and 2022:
Fort Clark Springs, Texas:
+135.4%
Texas:
+91.0%
Number of households with income < $10k:
Fort Clark Springs:
0.0% (0)
State:
4.7% (273,716)
Number of households with income $10k - 20k:
Fort Clark Springs:
4.6% (25)
Texas:
5.5% (322,702)
Number of households with income $20k - 30k:
Fort Clark Springs:
16.1% (87)
Texas:
6.2% (363,947)
Number of households with income $30k - 40k:
Fort Clark Springs:
4.2% (23)
State:
6.8% (399,275)
Number of households with income $40k - 50k:
Fort Clark Springs:
7.9% (43)
State:
6.5% (383,417)
Number of households with income $50k - 60k:
Fort Clark Springs:
8.7% (47)
State:
6.6% (388,535)
Number of households with income $60k - 75k:
Fort Clark Springs:
25.8% (140)
State:
9.7% (566,295)
Number of households with income $75k - 100k:
Fort Clark Springs:
12.7% (69)
State:
13.0% (760,276)
Number of households with income $100k - 125k:
Fort Clark Springs:
6.5% (35)
State:
10.2% (597,596)
Number of households with income $125k - 150k:
Fort Clark Springs:
0.0% (0)
State:
7.4% (436,830)
Number of households with income $150k - 200k:
Fort Clark Springs:
0.0% (0)
Texas:
9.9% (583,067)
Number of households with income > $200k:
Fort Clark Springs:
13.5% (73)
State:
13.5% (792,647)
Aggregate household income in Fort Clark Springs in 2022: $42,502,710
Median family income in Fort Clark Springs in 2022:
Fort Clark Springs:
$73,674
Texas:
$101,788
Number of families with income $10k - 20k:
Fort Clark Springs:
9.3% (22)
Texas:
2.9% (113,421)
Number of families with income $30k - 40k:
Fort Clark Springs:
8.7% (20)
State:
5.2% (198,847)
Number of families with income $50k - 60k:
Fort Clark Springs:
10.6% (25)
State:
5.7% (220,689)
Number of families with income $60k - 75k:
Fort Clark Springs:
56.7% (132)
State:
9.0% (346,106)
Number of families with income $100k - 125k:
Fort Clark Springs:
14.6% (34)
Texas:
11.6% (448,411)
Median per capita income in Fort Clark Springs in 2022:
Fort Clark Springs:
$45,830
Texas:
$47,740
Income statistics for Hispanic or Latino residents
Median household income in Fort Clark Springs, TX in 2022:
Fort Clark Springs:
$72,013
State:
$60,504
Number of households with income < $10k:
Fort Clark Springs:
0.0% (0)
State:
5.8% (213,953)
Number of households with income $10k - 20k:
Fort Clark Springs:
0.0% (0)
Texas:
8.0% (297,456)
Number of households with income $20k - 30k:
Fort Clark Springs:
20.1% (61)
State:
9.2% (340,166)
Number of households with income $30k - 40k:
Fort Clark Springs:
0.0% (0)
Texas:
9.5% (354,336)
Number of households with income $40k - 50k:
Fort Clark Springs:
18.5% (56)
Texas:
8.8% (327,013)
Number of households with income $50k - 60k:
Fort Clark Springs:
0.0% (0)
State:
8.3% (308,818)
Number of households with income $60k - 75k:
Fort Clark Springs:
19.8% (60)
Texas:
10.9% (405,109)
Number of households with income $75k - 100k:
Fort Clark Springs:
28.4% (86)
State:
13.8% (511,639)
Number of households with income $100k - 125k:
Fort Clark Springs:
13.2% (40)
Texas:
8.6% (319,728)
Number of households with income $125k - 150k:
Fort Clark Springs:
0.0% (0)
State:
5.7% (210,932)
Number of households with income $150k - 200k:
Fort Clark Springs:
0.0% (0)
State:
6.4% (236,055)
Number of households with income > $200k:
Fort Clark Springs:
0.0% (0)
State:
5.1% (189,259)
Aggregate household income in Fort Clark Springs in 2022: $19,390,859
Median per capita income in Fort Clark Springs in 2022:
Fort Clark Springs:
$33,531
Texas:
$24,862
Discuss Fort Clark Springs, Texas (TX) on our hugely popular Texas forum.