Center Point, Texas (TX) income map, earnings map, and wages data
The median household income in Center Point, TX in 2022 was $66,896, which was 8.1% less than the median annual income of $72,284 across the entire state of Texas. Compared to the median income of $36,286 in 2000 this represents an increase of 45.8%. The per capita income in 2022 was $35,408, which means an increase of 48.5% compared to 2000 when it was $18,232.
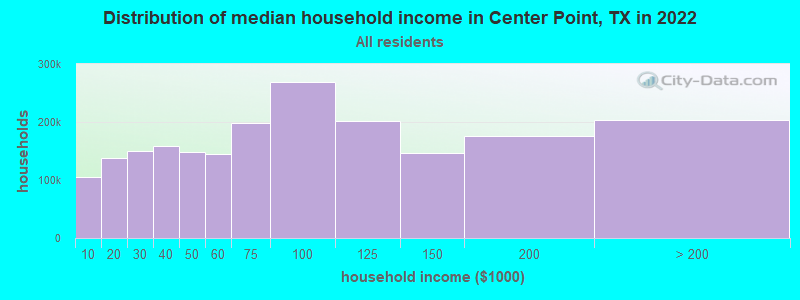
Income statistics for all residents
Median household income in Center Point, TX in 2022:| Center Point: | $66,896 |
| State: | $72,284 |
Change in median household income between 2000 and 2022:| Center Point, Texas: | +84.4% |
| State: | +81.0% |
Number of households with income < $10k:| Center Point: | 5.5% (277,494) |
| State: | 5.5% (611,011) |
Number of households with income $10k - 20k:| Center Point: | 6.7% (337,684) |
| Texas: | 6.7% (743,157) |
Number of households with income $20k - 30k:| Center Point: | 7.2% (365,061) |
| State: | 7.2% (803,381) |
Number of households with income $30k - 40k:| Center Point: | 7.8% (393,506) |
| State: | 7.8% (866,080) |
Number of households with income $40k - 50k:| Center Point: | 7.3% (368,241) |
| State: | 7.3% (810,440) |
Number of households with income $50k - 60k:| Center Point: | 7.2% (363,350) |
| Texas: | 7.2% (799,783) |
Number of households with income $60k - 75k:| Center Point: | 9.9% (497,670) |
| State: | 9.9% (1,095,384) |
Number of households with income $75k - 100k:| Center Point: | 12.8% (644,901) |
| State: | 12.8% (1,419,057) |
Number of households with income $100k - 125k:| Center Point: | 9.5% (479,309) |
| State: | 9.5% (1,054,577) |
Number of households with income $125k - 150k:| Center Point: | 6.7% (337,107) |
| State: | 6.7% (741,518) |
Number of households with income $150k - 200k:| Center Point: | 8.7% (436,996) |
| Texas: | 8.7% (961,776) |
Number of households with income > $200k:| Center Point: | 10.7% (536,629) |
| Texas: | 10.7% (1,181,544) |
Aggregate household income in Center Point in 2022: $16,646,667,907
Median family income in Center Point in 2022:| Center Point: | $80,005 |
| Texas: | $86,267 |
Median non-family income in Center Point in 2022:| Center Point: | $33,281 |
| State: | $45,999 |
Change in median non-family income between 2000 and 2022:| Center Point, Texas: | +85.2% |
| Texas: | +79.5% |
Median per capita income in Center Point in 2022:| Center Point: | $35,409 |
| State: | $38,123 |
Change in median per capita income between 2000 and 2022:| Center Point, Texas: | +94.2% |
| Texas: | +94.3% |
Income statistics for White residents
Median household income in Center Point, TX in 2022:| Center Point: | $68,827 |
| Texas: | $82,032 |
Change in median household income between 2000 and 2022:| Center Point, Texas: | +90.4% |
| Texas: | +91.0% |
Number of households with income < $10k:| Center Point: | 4.7% (114,861) |
| State: | 4.7% (273,716) |
Number of households with income $10k - 20k:| Center Point: | 5.5% (135,665) |
| Texas: | 5.5% (322,702) |
Number of households with income $20k - 30k:| Center Point: | 6.2% (153,088) |
| State: | 6.2% (363,947) |
Number of households with income $30k - 40k:| Center Point: | 6.8% (167,804) |
| Texas: | 6.8% (399,275) |
Number of households with income $40k - 50k:| Center Point: | 6.5% (161,081) |
| State: | 6.5% (383,417) |
Number of households with income $50k - 60k:| Center Point: | 6.6% (163,201) |
| Texas: | 6.6% (388,535) |
Number of households with income $60k - 75k:| Center Point: | 9.6% (237,554) |
| Texas: | 9.7% (566,295) |
Number of households with income $75k - 100k:| Center Point: | 13.0% (319,233) |
| State: | 13.0% (760,276) |
Number of households with income $100k - 125k:| Center Point: | 10.2% (250,930) |
| Texas: | 10.2% (597,596) |
Number of households with income $125k - 150k:| Center Point: | 7.4% (183,373) |
| State: | 7.4% (436,830) |
Number of households with income $150k - 200k:| Center Point: | 9.9% (244,566) |
| State: | 9.9% (583,067) |
Number of households with income > $200k:| Center Point: | 13.5% (331,607) |
| Texas: | 13.5% (792,647) |
Aggregate household income in Center Point in 2022: $9,285,222,819
Median family income in Center Point in 2022:| Center Point: | $84,315 |
| State: | $101,788 |
Number of families with income < $10k:| Center Point: | 2.8% (21) |
| State: | 2.8% (108,142) |
Number of families with income $10k - 20k:| Center Point: | 3.9% (30) |
| State: | 2.9% (113,421) |
Number of families with income $20k - 30k:| Center Point: | 5.0% (38) |
| Texas: | 4.1% (157,688) |
Number of families with income $30k - 40k:| Center Point: | 8.3% (64) |
| State: | 5.2% (198,847) |
Number of families with income $40k - 50k:| Center Point: | 10.4% (81) |
| Texas: | 5.6% (216,490) |
Number of families with income $50k - 60k:| Center Point: | 6.4% (50) |
| State: | 5.7% (220,689) |
Number of families with income $60k - 75k:| Center Point: | 9.4% (73) |
| State: | 9.0% (346,106) |
Number of families with income $75k - 100k:| Center Point: | 11.1% (86) |
| Texas: | 13.7% (527,363) |
Number of families with income $100k - 125k:| Center Point: | 6.5% (50) |
| State: | 11.6% (448,411) |
Number of families with income $125k - 150k:| Center Point: | 7.4% (57) |
| State: | 9.2% (355,798) |
Number of families with income $150k - 200k:| Center Point: | 20.7% (159) |
| Texas: | 12.5% (480,185) |
Number of families with income > $200k:| Center Point: | 7.9% (61) |
| State: | 17.6% (677,490) |
Median non-family income in Center Point in 2022:| Center Point: | $34,524 |
| Texas: | $50,587 |
Change in median non-family income between 2000 and 2022:| Center Point, Texas: | +85.8% |
| State: | +87.7% |
Median per capita income in Center Point in 2022:| Center Point: | $39,693 |
| State: | $47,740 |
Change in median per capita income between 2000 and 2022:| Center Point, Texas: | +112.1% |
| Texas: | +114.3% |
Income statistics for Black or African American residents
Median household income in Center Point, TX in 2022:| Center Point: | $13,346 |
| Texas: | $55,759 |
Change in median household income between 2000 and 2022:| Center Point, Texas: | +113.5% |
| State: | +90.3% |
Number of households with income < $10k:| Center Point: | 8.9% (13,427) |
| Texas: | 8.9% (126,378) |
Number of households with income $10k - 20k:| Center Point: | 9.9% (15,012) |
| State: | 9.9% (140,369) |
Number of households with income $20k - 30k:| Center Point: | 8.5% (12,915) |
| State: | 8.5% (120,639) |
Number of households with income $30k - 40k:| Center Point: | 9.7% (14,602) |
| State: | 9.7% (137,517) |
Number of households with income $40k - 50k:| Center Point: | 7.9% (11,995) |
| Texas: | 8.0% (112,973) |
Number of households with income $50k - 60k:| Center Point: | 8.2% (12,430) |
| State: | 8.3% (117,156) |
Number of households with income $60k - 75k:| Center Point: | 10.4% (15,691) |
| State: | 10.4% (147,462) |
Number of households with income $75k - 100k:| Center Point: | 11.5% (17,325) |
| State: | 11.5% (162,718) |
Number of households with income $100k - 125k:| Center Point: | 8.1% (12,301) |
| Texas: | 8.2% (115,829) |
Number of households with income $125k - 150k:| Center Point: | 4.9% (7,454) |
| State: | 4.9% (69,556) |
Number of households with income $150k - 200k:| Center Point: | 6.4% (9,655) |
| State: | 6.4% (90,701) |
Number of households with income > $200k:| Center Point: | 5.5% (8,294) |
| Texas: | 5.5% (77,988) |
Aggregate household income in Center Point in 2022: $1,414,839
Median non-family income in Center Point in 2022:| Center Point: | $14,565 |
| State: | $40,133 |
Change in median non-family income between 2000 and 2022:| Center Point, Texas: | +133.0% |
| State: | +102.2% |
Median per capita income in Center Point in 2022:| Center Point: | $16,589 |
| State: | $30,490 |
Change in median per capita income between 2000 and 2022:| Center Point, Texas: | +116.3% |
| State: | +113.9% |
Income statistics for Asian residents
Median household income in Center Point, TX in 2022:| Center Point: | $210,583 |
| State: | $107,673 |
Change in median household income between 2000 and 2022:| Center Point, Texas: | +105.9% |
| State: | +115.1% |
Number of households with income < $10k:| Center Point: | 5.3% (30,572) |
| State: | 5.2% (29,885) |
Number of households with income $10k - 20k:| Center Point: | 4.8% (27,662) |
| State: | 4.7% (27,044) |
Number of households with income $20k - 30k:| Center Point: | 4.1% (23,840) |
| Texas: | 4.1% (23,363) |
Number of households with income $30k - 40k:| Center Point: | 4.1% (23,833) |
| State: | 4.1% (23,309) |
Number of households with income $40k - 50k:| Center Point: | 5.2% (30,468) |
| State: | 5.2% (29,826) |
Number of households with income $50k - 60k:| Center Point: | 4.6% (27,027) |
| Texas: | 4.7% (26,512) |
Number of households with income $60k - 75k:| Center Point: | 6.5% (37,747) |
| State: | 6.5% (36,905) |
Number of households with income $75k - 100k:| Center Point: | 11.3% (65,638) |
| State: | 11.3% (64,350) |
Number of households with income $100k - 125k:| Center Point: | 11.3% (66,058) |
| State: | 11.4% (64,714) |
Number of households with income $125k - 150k:| Center Point: | 9.3% (53,853) |
| State: | 9.3% (52,719) |
Number of households with income $150k - 200k:| Center Point: | 12.5% (72,491) |
| State: | 12.5% (70,953) |
Number of households with income > $200k:| Center Point: | 21.1% (122,859) |
| State: | 21.1% (120,260) |
Aggregate household income in Center Point in 2022: $7,899,827
Median family income in Center Point in 2022:| Center Point: | $218,256 |
| Texas: | $123,328 |
Number of families with income $100k - 125k:| Center Point: | 100.0% (14) |
| Texas: | 11.3% (49,585) |
Median per capita income in Center Point in 2022:| Center Point: | $145,302 |
| State: | $48,626 |
Change in median per capita income between 2000 and 2022:| Center Point, Texas: | +127.1% |
| State: | +132.0% |
Income statistics for Hispanic or Latino residents
Median household income in Center Point, TX in 2022:| Center Point: | $77,009 |
| Texas: | $60,504 |
Change in median household income between 2000 and 2022:| Center Point, Texas: | +112.9% |
| Texas: | +102.5% |
Number of households with income < $10k:| Center Point: | 5.8% (129,677) |
| State: | 5.8% (213,953) |
Number of households with income $10k - 20k:| Center Point: | 8.0% (180,350) |
| State: | 8.0% (297,456) |
Number of households with income $20k - 30k:| Center Point: | 9.2% (206,062) |
| State: | 9.2% (340,166) |
Number of households with income $30k - 40k:| Center Point: | 9.5% (214,841) |
| State: | 9.5% (354,336) |
Number of households with income $40k - 50k:| Center Point: | 8.8% (198,140) |
| State: | 8.8% (327,013) |
Number of households with income $50k - 60k:| Center Point: | 8.3% (187,005) |
| State: | 8.3% (308,818) |
Number of households with income $60k - 75k:| Center Point: | 10.9% (245,530) |
| State: | 10.9% (405,109) |
Number of households with income $75k - 100k:| Center Point: | 13.8% (310,234) |
| State: | 13.8% (511,639) |
Number of households with income $100k - 125k:| Center Point: | 8.6% (193,882) |
| Texas: | 8.6% (319,728) |
Number of households with income $125k - 150k:| Center Point: | 5.7% (128,019) |
| State: | 5.7% (210,932) |
Number of households with income $150k - 200k:| Center Point: | 6.4% (142,973) |
| State: | 6.4% (236,055) |
Number of households with income > $200k:| Center Point: | 5.1% (114,787) |
| State: | 5.1% (189,259) |
Aggregate household income in Center Point in 2022: $635,294,945
Median family income in Center Point in 2022:| Center Point: | $78,739 |
| Texas: | $65,080 |
Number of families with income < $10k:| Center Point: | 6.3% (36) |
| State: | 5.3% (147,493) |
Number of families with income $10k - 20k:| Center Point: | 10.8% (61) |
| State: | 6.3% (174,531) |
Number of families with income $20k - 30k:| Center Point: | 9.0% (51) |
| Texas: | 8.6% (238,528) |
Number of families with income $30k - 40k:| Center Point: | 14.0% (79) |
| Texas: | 9.1% (251,999) |
Number of families with income $40k - 50k:| Center Point: | 14.6% (82) |
| State: | 8.6% (240,188) |
Number of families with income $50k - 60k:| Center Point: | 6.5% (37) |
| Texas: | 8.0% (223,566) |
Number of families with income $60k - 75k:| Center Point: | 9.9% (56) |
| State: | 10.9% (302,688) |
Number of families with income $75k - 100k:| Center Point: | 10.0% (56) |
| Texas: | 14.3% (398,554) |
Number of families with income $100k - 125k:| Center Point: | 4.3% (24) |
| Texas: | 9.5% (264,007) |
Number of families with income $125k - 150k:| Center Point: | 3.3% (19) |
| State: | 6.2% (171,274) |
Number of families with income $150k - 200k:| Center Point: | 8.8% (49) |
| Texas: | 7.3% (202,259) |
Number of families with income > $200k:| Center Point: | 2.4% (13) |
| State: | 5.9% (165,129) |
Median non-family income in Center Point in 2022:| Center Point: | $62,563 |
| Texas: | $39,934 |
Change in median non-family income between 2000 and 2022:| Center Point, Texas: | +120.8% |
| State: | +109.1% |
Median per capita income in Center Point in 2022:| Center Point: | $25,377 |
| Texas: | $24,862 |
Change in median per capita income between 2000 and 2022:| Center Point, Texas: | +128.5% |
| State: | +130.8% |
Income statistics for American Indian and Alaska Native residents
Median household income in Center Point, TX in 2022:| Center Point: | $197,032 |
| Texas: | $65,765 |
Change in median household income between 2000 and 2022:| Center Point, Texas: | +93.7% |
| State: | +88.3% |
Number of households with income < $10k:| Center Point: | 4.1% (4,957) |
| State: | 4.1% (3,398) |
Number of households with income $10k - 20k:| Center Point: | 8.3% (10,134) |
| State: | 8.3% (6,949) |
Number of households with income $20k - 30k:| Center Point: | 9.3% (11,294) |
| State: | 9.3% (7,742) |
Number of households with income $30k - 40k:| Center Point: | 9.1% (11,112) |
| State: | 9.1% (7,627) |
Number of households with income $40k - 50k:| Center Point: | 7.1% (8,646) |
| Texas: | 7.1% (5,922) |
Number of households with income $50k - 60k:| Center Point: | 8.1% (9,864) |
| State: | 8.1% (6,761) |
Number of households with income $60k - 75k:| Center Point: | 12.7% (15,437) |
| State: | 12.7% (10,588) |
Number of households with income $75k - 100k:| Center Point: | 13.0% (15,907) |
| Texas: | 13.0% (10,903) |
Number of households with income $100k - 125k:| Center Point: | 9.9% (12,044) |
| State: | 9.9% (8,256) |
Number of households with income $125k - 150k:| Center Point: | 5.2% (6,348) |
| State: | 5.2% (4,355) |
Number of households with income $150k - 200k:| Center Point: | 6.7% (8,193) |
| State: | 6.7% (5,623) |
Number of households with income > $200k:| Center Point: | 6.6% (8,044) |
| State: | 6.6% (5,522) |
Aggregate household income in Center Point in 2022: $2,103,695
Median family income in Center Point in 2022:| Center Point: | $195,008 |
| State: | $72,369 |
Number of families with income $100k - 125k:| Center Point: | 100.0% (24) |
| State: | 11.4% (6,997) |
Median non-family income in Center Point in 2022:| Center Point: | $51,789 |
| Texas: | $40,351 |
Change in median non-family income between 2000 and 2022:| Center Point, Texas: | +80.1% |
| State: | +71.9% |
Median per capita income in Center Point in 2022:| Center Point: | $63,837 |
| State: | $28,166 |
Change in median per capita income between 2000 and 2022:| Center Point, Texas: | +95.5% |
| State: | +77.2% |
Income statistics for Multirace residents
Median household income in Center Point, TX in 2022:| Center Point: | $64,329 |
| Texas: | $62,748 |
Change in median household income between 2000 and 2022:| Center Point, Texas: | +97.9% |
| State: | +92.3% |
Number of households with income < $10k:| Center Point: | 5.5% (60,857) |
| State: | 5.5% (122,324) |
Number of households with income $10k - 20k:| Center Point: | 8.2% (90,664) |
| Texas: | 8.2% (182,232) |
Number of households with income $20k - 30k:| Center Point: | 8.5% (94,159) |
| State: | 8.5% (189,456) |
Number of households with income $30k - 40k:| Center Point: | 8.9% (98,232) |
| State: | 8.9% (197,499) |
Number of households with income $40k - 50k:| Center Point: | 8.7% (95,416) |
| Texas: | 8.7% (191,735) |
Number of households with income $50k - 60k:| Center Point: | 8.0% (88,252) |
| State: | 8.0% (177,535) |
Number of households with income $60k - 75k:| Center Point: | 10.5% (115,672) |
| Texas: | 10.5% (232,479) |
Number of households with income $75k - 100k:| Center Point: | 13.1% (144,468) |
| State: | 13.1% (290,448) |
Number of households with income $100k - 125k:| Center Point: | 8.7% (95,341) |
| Texas: | 8.6% (191,595) |
Number of households with income $125k - 150k:| Center Point: | 6.0% (66,408) |
| Texas: | 6.0% (133,361) |
Number of households with income $150k - 200k:| Center Point: | 7.2% (79,095) |
| State: | 7.2% (159,195) |
Number of households with income > $200k:| Center Point: | 6.7% (73,642) |
| State: | 6.7% (148,064) |
Aggregate household income in Center Point in 2022: $58,697,814
Median family income in Center Point in 2022:| Center Point: | $82,491 |
| State: | $69,780 |
Number of families with income $10k - 20k:| Center Point: | 8.8% (25) |
| Texas: | 5.9% (95,279) |
Number of families with income $30k - 40k:| Center Point: | 12.7% (37) |
| State: | 8.5% (137,626) |
Number of families with income $40k - 50k:| Center Point: | 7.3% (21) |
| State: | 8.4% (135,809) |
Number of families with income $60k - 75k:| Center Point: | 42.0% (122) |
| Texas: | 10.5% (169,549) |
Number of families with income $100k - 125k:| Center Point: | 29.1% (84) |
| State: | 9.5% (153,597) |
Median non-family income in Center Point in 2022:| Center Point: | $21,730 |
| State: | $40,634 |
Change in median non-family income between 2000 and 2022:| Center Point, Texas: | +93.2% |
| Texas: | +77.2% |
Median per capita income in Center Point in 2022:| Center Point: | $26,812 |
| Texas: | $26,785 |
Change in median per capita income between 2000 and 2022:| Center Point, Texas: | +108.4% |
| State: | +110.9% |
Income statistics for other residents
Number of households with income < $10k:| Center Point: | 5.9% (35) |
| State: | 5.9% (54,162) |
Number of households with income $10k - 20k:| Center Point: | 6.8% (40) |
| Texas: | 6.8% (62,891) |
Number of households with income $20k - 30k:| Center Point: | 10.6% (63) |
| Texas: | 10.6% (97,294) |
Number of households with income $30k - 40k:| Center Point: | 10.8% (64) |
| Texas: | 10.8% (99,670) |
Number of households with income $40k - 50k:| Center Point: | 9.3% (55) |
| Texas: | 9.3% (85,548) |
Number of households with income $50k - 60k:| Center Point: | 9.0% (53) |
| Texas: | 9.0% (82,757) |
Number of households with income $60k - 75k:| Center Point: | 11.0% (65) |
| State: | 10.9% (100,326) |
Number of households with income $75k - 100k:| Center Point: | 14.0% (83) |
| State: | 14.0% (128,767) |
Number of households with income $100k - 125k:| Center Point: | 8.3% (49) |
| State: | 8.2% (75,218) |
Number of households with income $125k - 150k:| Center Point: | 4.9% (29) |
| Texas: | 4.8% (44,223) |
Number of households with income $150k - 200k:| Center Point: | 5.6% (33) |
| State: | 5.6% (51,376) |
Number of households with income > $200k:| Center Point: | 3.9% (23) |
| State: | 4.0% (36,393) |
Aggregate household income in Center Point in 2022: $43,543,435
Median family income in Center Point in 2022:| Center Point: | $78,025 |
| Texas: | $60,064 |
Number of families with income < $10k:| Center Point: | 2.9% (2) |
| Texas: | 6.8% (47,502) |
Number of families with income $10k - 20k:| Center Point: | 5.5% (4) |
| State: | 6.0% (41,763) |
Number of families with income $20k - 30k:| Center Point: | 10.9% (9) |
| Texas: | 9.9% (68,761) |
Number of families with income $30k - 40k:| Center Point: | 11.1% (9) |
| Texas: | 9.7% (67,685) |
Number of families with income $40k - 50k:| Center Point: | 11.4% (9) |
| State: | 9.0% (62,441) |
Number of families with income $50k - 60k:| Center Point: | 37.1% (30) |
| State: | 8.5% (59,321) |
Number of families with income $75k - 100k:| Center Point: | 21.0% (17) |
| State: | 14.5% (101,032) |
Median per capita income in Center Point in 2022:| Center Point: | $21,606 |
| Texas: | $23,899 |
Change in median per capita income between 2000 and 2022:| Center Point, Texas: | +141.8% |
| State: | +135.2% |