The median household income in Butte Creek Canyon, CA in 2022 was $75,859, which was 20.7% less than the median annual income of $91,551 across the entire state of California. Compared to the median income of $31,924 in 2000 this represents an increase of 57.9%. The per capita income in 2022 was $46,511, which means an increase of 62.3% compared to 2000 when it was $17,517.
Whole page based on the data from 2000 / 2022 when the population of Butte Creek Canyon, California was 1,086 / 670
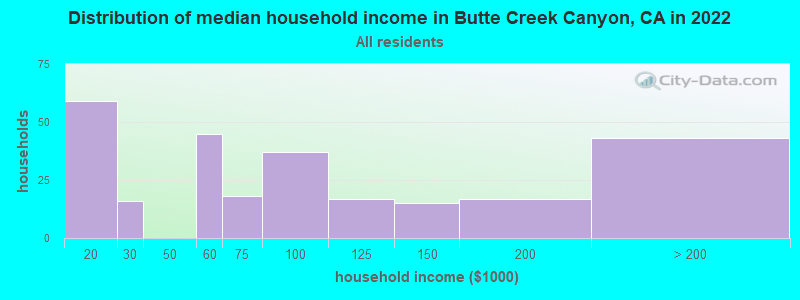
Income statistics for all residents
Median household income in Butte Creek Canyon, CA in 2022:
Butte Creek Canyon:
$75,860
California:
$91,551
Change in median household income between 2000 and 2022:
Butte Creek Canyon, California:
+137.6%
State:
+92.8%
Number of households with income < $10k:
Butte Creek Canyon:
0.0% (0)
State:
4.8% (654,370)
Number of households with income $10k - 20k:
Butte Creek Canyon:
22.1% (59)
State:
5.8% (789,493)
Number of households with income $20k - 30k:
Butte Creek Canyon:
6.0% (16)
State:
5.7% (778,318)
Number of households with income $30k - 40k:
Butte Creek Canyon:
0.0% (0)
State:
5.8% (783,170)
Number of households with income $40k - 50k:
Butte Creek Canyon:
0.0% (0)
State:
5.8% (781,352)
Number of households with income $50k - 60k:
Butte Creek Canyon:
16.9% (45)
State:
5.6% (760,175)
Number of households with income $60k - 75k:
Butte Creek Canyon:
6.7% (18)
California:
8.2% (1,104,699)
Number of households with income $75k - 100k:
Butte Creek Canyon:
13.9% (37)
State:
12.0% (1,627,633)
Number of households with income $100k - 125k:
Butte Creek Canyon:
6.4% (17)
State:
10.0% (1,358,619)
Number of households with income $125k - 150k:
Butte Creek Canyon:
5.6% (15)
State:
7.6% (1,027,455)
Number of households with income $150k - 200k:
Butte Creek Canyon:
6.4% (17)
State:
10.6% (1,439,811)
Number of households with income > $200k:
Butte Creek Canyon:
16.1% (43)
State:
18.0% (2,445,491)
Aggregate household income in Butte Creek Canyon in 2022: $31,932,330
Median family income in Butte Creek Canyon in 2022:
Butte Creek Canyon:
$72,530
California:
$104,823
Number of families with income $10k - 20k:
Butte Creek Canyon:
26.7% (62)
State:
3.5% (322,064)
Number of families with income $20k - 30k:
Butte Creek Canyon:
4.9% (11)
State:
4.7% (433,722)
Number of families with income $40k - 50k:
Butte Creek Canyon:
13.1% (30)
State:
5.6% (511,647)
Number of families with income $50k - 60k:
Butte Creek Canyon:
5.3% (12)
California:
5.5% (498,926)
Number of families with income $60k - 75k:
Butte Creek Canyon:
7.1% (16)
California:
8.0% (731,094)
Number of families with income $75k - 100k:
Butte Creek Canyon:
13.6% (31)
State:
12.2% (1,115,621)
Number of families with income $100k - 125k:
Butte Creek Canyon:
2.8% (7)
State:
10.5% (959,600)
Number of families with income $125k - 150k:
Butte Creek Canyon:
6.7% (16)
California:
8.4% (768,725)
Number of families with income $150k - 200k:
Butte Creek Canyon:
7.9% (18)
California:
11.9% (1,087,239)
Number of families with income > $200k:
Butte Creek Canyon:
11.8% (27)
California:
21.5% (1,963,769)
Median per capita income in Butte Creek Canyon in 2022:
Butte Creek Canyon:
$46,511
State:
$46,661
Income statistics for White residents
Median household income in Butte Creek Canyon, CA in 2022:
Butte Creek Canyon:
$74,807
State:
$100,917
Change in median household income between 2000 and 2022:
Butte Creek Canyon, California:
+125.3%
State:
+96.8%
Number of households with income < $10k:
Butte Creek Canyon:
0.0% (0)
State:
4.4% (284,109)
Number of households with income $10k - 20k:
Butte Creek Canyon:
26.5% (56)
California:
5.3% (340,330)
Number of households with income $20k - 30k:
Butte Creek Canyon:
7.6% (16)
State:
5.3% (343,145)
Number of households with income $30k - 40k:
Butte Creek Canyon:
0.0% (0)
State:
5.1% (330,146)
Number of households with income $40k - 50k:
Butte Creek Canyon:
0.0% (0)
California:
5.2% (335,310)
Number of households with income $50k - 60k:
Butte Creek Canyon:
7.6% (16)
State:
5.1% (326,299)
Number of households with income $60k - 75k:
Butte Creek Canyon:
7.6% (16)
California:
7.6% (487,640)
Number of households with income $75k - 100k:
Butte Creek Canyon:
11.8% (25)
State:
11.5% (736,578)
Number of households with income $100k - 125k:
Butte Creek Canyon:
6.6% (14)
California:
10.1% (648,782)
Number of households with income $125k - 150k:
Butte Creek Canyon:
7.1% (15)
California:
7.8% (499,671)
Number of households with income $150k - 200k:
Butte Creek Canyon:
7.6% (16)
State:
11.4% (729,603)
Number of households with income > $200k:
Butte Creek Canyon:
17.5% (37)
California:
21.2% (1,364,246)
Aggregate household income in Butte Creek Canyon in 2022: $27,115,007
Median family income in Butte Creek Canyon in 2022:
Butte Creek Canyon:
$76,274
State:
$125,379
Number of families with income $10k - 20k:
Butte Creek Canyon:
30.5% (52)
State:
2.5% (97,716)
Number of families with income $20k - 30k:
Butte Creek Canyon:
4.7% (8)
State:
3.5% (137,295)
Number of families with income $50k - 60k:
Butte Creek Canyon:
6.8% (11)
California:
4.5% (176,192)
Number of families with income $60k - 75k:
Butte Creek Canyon:
8.8% (15)
State:
7.0% (274,752)
Number of families with income $75k - 100k:
Butte Creek Canyon:
12.4% (21)
State:
11.3% (445,632)
Number of families with income $100k - 125k:
Butte Creek Canyon:
3.5% (6)
California:
10.7% (423,630)
Number of families with income $125k - 150k:
Butte Creek Canyon:
9.2% (16)
State:
9.1% (357,408)
Number of families with income $150k - 200k:
Butte Creek Canyon:
10.2% (17)
California:
13.5% (532,693)
Number of families with income > $200k:
Butte Creek Canyon:
13.9% (23)
State:
27.6% (1,086,948)
Median per capita income in Butte Creek Canyon in 2022:
Butte Creek Canyon:
$51,429
State:
$61,706
Income statistics for Asian residents
Aggregate household income in Butte Creek Canyon in 2022: $355,005,700
Median per capita income in Butte Creek Canyon in 2022:
Butte Creek Canyon:
$44,190
State:
$58,824
Income statistics for Hispanic or Latino residents
Number of households with income < $10k:
Butte Creek Canyon:
0.0% (0)
State:
4.3% (183,294)
Number of households with income $10k - 20k:
Butte Creek Canyon:
0.0% (0)
State:
6.0% (253,903)
Number of households with income $20k - 30k:
Butte Creek Canyon:
0.0% (0)
California:
6.8% (286,386)
Number of households with income $30k - 40k:
Butte Creek Canyon:
0.0% (0)
California:
7.4% (313,728)
Number of households with income $40k - 50k:
Butte Creek Canyon:
0.0% (0)
State:
7.4% (313,199)
Number of households with income $50k - 60k:
Butte Creek Canyon:
100.0% (36)
California:
7.2% (305,366)
Number of households with income $60k - 75k:
Butte Creek Canyon:
0.0% (0)
California:
10.3% (434,937)
Number of households with income $75k - 100k:
Butte Creek Canyon:
0.0% (0)
State:
14.4% (607,302)
Number of households with income $100k - 125k:
Butte Creek Canyon:
0.0% (0)
State:
10.6% (447,424)
Number of households with income $125k - 150k:
Butte Creek Canyon:
0.0% (0)
State:
7.5% (316,022)
Number of households with income $150k - 200k:
Butte Creek Canyon:
0.0% (0)
State:
9.2% (386,269)
Number of households with income > $200k:
Butte Creek Canyon:
0.0% (0)
California:
8.8% (372,651)
Aggregate household income in Butte Creek Canyon in 2022: $8,379,263
Median per capita income in Butte Creek Canyon in 2022:
Butte Creek Canyon:
$11,499
California:
$27,240
Change in median per capita income between 2000 and 2022:
Butte Creek Canyon, California:
+10.7%
State:
+133.3%
Income statistics for Multirace residents
Median per capita income in Butte Creek Canyon in 2022:
Butte Creek Canyon:
$32,922
State:
$32,124
Income statistics for other residents
Number of households with income < $10k:
Butte Creek Canyon:
0.0% (0)
California:
4.6% (93,035)
Number of households with income $10k - 20k:
Butte Creek Canyon:
0.0% (0)
California:
6.3% (126,222)
Number of households with income $20k - 30k:
Butte Creek Canyon:
0.0% (0)
State:
7.1% (142,656)
Number of households with income $30k - 40k:
Butte Creek Canyon:
0.0% (0)
State:
8.2% (165,018)
Number of households with income $40k - 50k:
Butte Creek Canyon:
0.0% (0)
State:
8.0% (161,732)
Number of households with income $50k - 60k:
Butte Creek Canyon:
100.0% (27)
California:
7.6% (152,152)
Number of households with income $60k - 75k:
Butte Creek Canyon:
0.0% (0)
State:
10.4% (209,951)
Number of households with income $75k - 100k:
Butte Creek Canyon:
0.0% (0)
State:
14.7% (296,102)
Number of households with income $100k - 125k:
Butte Creek Canyon:
0.0% (0)
State:
10.7% (214,281)
Number of households with income $125k - 150k:
Butte Creek Canyon:
0.0% (0)
California:
7.1% (143,092)
Number of households with income $150k - 200k:
Butte Creek Canyon:
0.0% (0)
California:
8.6% (172,215)
Number of households with income > $200k:
Butte Creek Canyon:
0.0% (0)
State:
6.7% (134,102)
Aggregate household income in Butte Creek Canyon in 2022: $287,198,900
Median per capita income in Butte Creek Canyon in 2022:
Butte Creek Canyon:
$11,652
California:
$25,164
Change in median per capita income between 2000 and 2022:
Butte Creek Canyon, California:
+16.0%
State:
+137.9%
Discuss Butte Creek Canyon, California (CA) on our hugely popular California forum.