The median household income in Burnt Ranch, CA in 2022 was $55,143, which was 66.0% less than the median annual income of $91,551 across the entire state of California. Compared to the median income of $27,711 in 2000 this represents an increase of 49.7%. The per capita income in 2022 was $15,904, which means a decrease of 6.1% compared to 2000 when it was $16,868.
Whole page based on the data from 2000 / 2022 when the population of Burnt Ranch, California was 281 / 226
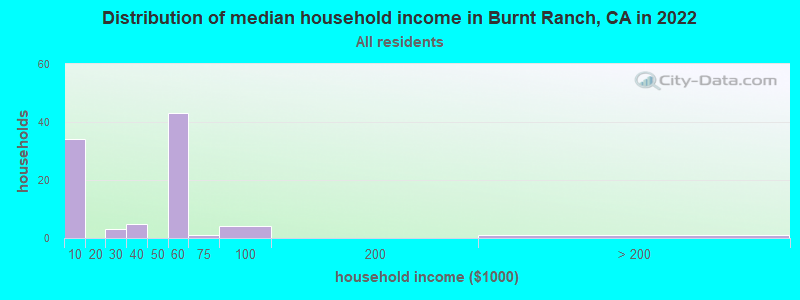
Income statistics for all residents
Median household income in Burnt Ranch, CA in 2022:
Burnt Ranch:
$55,144
State:
$91,551
Change in median household income between 2000 and 2022:
Burnt Ranch, California:
+99.0%
State:
+92.8%
Number of households with income < $10k:
Burnt Ranch:
37.4% (34)
State:
4.8% (654,370)
Number of households with income $10k - 20k:
Burnt Ranch:
0.0% (0)
State:
5.8% (789,493)
Number of households with income $20k - 30k:
Burnt Ranch:
3.3% (3)
State:
5.7% (778,318)
Number of households with income $30k - 40k:
Burnt Ranch:
5.5% (5)
State:
5.8% (783,170)
Number of households with income $40k - 50k:
Burnt Ranch:
0.0% (0)
State:
5.8% (781,352)
Number of households with income $50k - 60k:
Burnt Ranch:
47.3% (43)
California:
5.6% (760,175)
Number of households with income $60k - 75k:
Burnt Ranch:
1.1% (1)
State:
8.2% (1,104,699)
Number of households with income $75k - 100k:
Burnt Ranch:
4.4% (4)
State:
12.0% (1,627,633)
Number of households with income $100k - 125k:
Burnt Ranch:
0.0% (0)
California:
10.0% (1,358,619)
Number of households with income $125k - 150k:
Burnt Ranch:
0.0% (0)
State:
7.6% (1,027,455)
Number of households with income $150k - 200k:
Burnt Ranch:
0.0% (0)
California:
10.6% (1,439,811)
Number of households with income > $200k:
Burnt Ranch:
1.1% (1)
State:
18.0% (2,445,491)
Aggregate household income in Burnt Ranch in 2022: $3,614,767
Median family income in Burnt Ranch in 2022:
Burnt Ranch:
$28,465
California:
$104,823
Number of families with income < $10k:
Burnt Ranch:
32.8% (21)
State:
3.1% (280,184)
Number of families with income $20k - 30k:
Burnt Ranch:
45.8% (30)
State:
4.7% (433,722)
Number of families with income $30k - 40k:
Burnt Ranch:
7.5% (5)
State:
5.2% (478,213)
Number of families with income $50k - 60k:
Burnt Ranch:
4.6% (3)
California:
5.5% (498,926)
Number of families with income $60k - 75k:
Burnt Ranch:
1.6% (1)
State:
8.0% (731,094)
Number of families with income $75k - 100k:
Burnt Ranch:
6.2% (4)
State:
12.2% (1,115,621)
Number of families with income > $200k:
Burnt Ranch:
1.6% (1)
State:
21.5% (1,963,769)
Median income for families with 0 earners:
Burnt Ranch:
$0
California:
$49,362
Median income for families with 1 earner:
Burnt Ranch:
$28,133
State:
$71,861
Median income for families with 2 earners:
Burnt Ranch:
$0
State:
$133,967
Median income for families with 3+ earners:
Burnt Ranch:
$0
State:
$148,892
Median per capita income in Burnt Ranch in 2022:
Burnt Ranch:
$15,905
California:
$46,661
Change in median per capita income between 2000 and 2022:: -5.7%
Burnt Ranch, California:
-5.7%
State:
+105.5%
Income statistics for White residents
Median household income in Burnt Ranch, CA in 2022:
Burnt Ranch:
$57,087
State:
$100,917
Change in median household income between 2000 and 2022:
Burnt Ranch, California:
+99.7%
State:
+96.8%
Number of households with income < $10k:
Burnt Ranch:
39.0% (30)
California:
4.4% (284,109)
Number of households with income $10k - 20k:
Burnt Ranch:
0.0% (0)
State:
5.3% (340,330)
Number of households with income $20k - 30k:
Burnt Ranch:
3.9% (3)
State:
5.3% (343,145)
Number of households with income $30k - 40k:
Burnt Ranch:
5.2% (4)
State:
5.1% (330,146)
Number of households with income $40k - 50k:
Burnt Ranch:
0.0% (0)
State:
5.2% (335,310)
Number of households with income $50k - 60k:
Burnt Ranch:
45.5% (35)
California:
5.1% (326,299)
Number of households with income $60k - 75k:
Burnt Ranch:
1.3% (1)
California:
7.6% (487,640)
Number of households with income $75k - 100k:
Burnt Ranch:
3.9% (3)
California:
11.5% (736,578)
Number of households with income $100k - 125k:
Burnt Ranch:
0.0% (0)
State:
10.1% (648,782)
Number of households with income $125k - 150k:
Burnt Ranch:
0.0% (0)
California:
7.8% (499,671)
Number of households with income $150k - 200k:
Burnt Ranch:
0.0% (0)
State:
11.4% (729,603)
Number of households with income > $200k:
Burnt Ranch:
1.3% (1)
California:
21.2% (1,364,246)
Aggregate household income in Burnt Ranch in 2022: $3,197,209
Median family income in Burnt Ranch in 2022:
Burnt Ranch:
$30,669
California:
$125,379
Number of families with income < $10k:
Burnt Ranch:
33.0% (16)
California:
2.2% (87,079)
Number of families with income $20k - 30k:
Burnt Ranch:
44.9% (22)
State:
3.5% (137,295)
Number of families with income $30k - 40k:
Burnt Ranch:
7.4% (4)
California:
3.9% (152,947)
Number of families with income $50k - 60k:
Burnt Ranch:
4.6% (2)
State:
4.5% (176,192)
Number of families with income $60k - 75k:
Burnt Ranch:
1.7% (1)
California:
7.0% (274,752)
Number of families with income $75k - 100k:
Burnt Ranch:
6.6% (3)
State:
11.3% (445,632)
Number of families with income > $200k:
Burnt Ranch:
1.9% (1)
California:
27.6% (1,086,948)
Median per capita income in Burnt Ranch in 2022:
Burnt Ranch:
$17,679
California:
$61,706
Change in median per capita income between 2000 and 2022:
Burnt Ranch, California:
+0.2%
State:
+122.7%
Income statistics for American Indian and Alaska Native residents
Median per capita income in Burnt Ranch in 2022:
Burnt Ranch:
$49,506
California:
$30,289
Discuss Burnt Ranch, California (CA) on our hugely popular California forum.