Burlington, Texas (TX) income map, earnings map, and wages data
The median household income in Burlington, TX in 2022 was $51,493, which was 40.4% less than the median annual income of $72,284 across the entire state of Texas. Compared to the median income of $27,931 in 2000 this represents an increase of 45.8%. The per capita income in 2022 was $28,088, which means an increase of 48.5% compared to 2000 when it was $14,463.
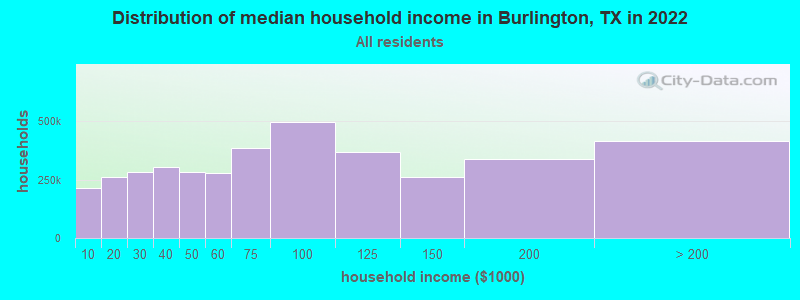
Income statistics for all residents
Median household income in Burlington, TX in 2022:| Burlington: | $51,493 |
| State: | $72,284 |
Change in median household income between 2000 and 2022:| Burlington, Texas: | +84.4% |
| Texas: | +81.0% |
Number of households with income < $10k:| Burlington: | 5.5% (213,600) |
| Texas: | 5.5% (611,011) |
Number of households with income $10k - 20k:| Burlington: | 6.7% (259,931) |
| State: | 6.7% (743,157) |
Number of households with income $20k - 30k:| Burlington: | 7.2% (281,004) |
| Texas: | 7.2% (803,381) |
Number of households with income $30k - 40k:| Burlington: | 7.8% (302,900) |
| State: | 7.8% (866,080) |
Number of households with income $40k - 50k:| Burlington: | 7.3% (283,452) |
| State: | 7.3% (810,440) |
Number of households with income $50k - 60k:| Burlington: | 7.2% (279,687) |
| Texas: | 7.2% (799,783) |
Number of households with income $60k - 75k:| Burlington: | 9.9% (383,080) |
| State: | 9.9% (1,095,384) |
Number of households with income $75k - 100k:| Burlington: | 12.8% (496,410) |
| State: | 12.8% (1,419,057) |
Number of households with income $100k - 125k:| Burlington: | 9.5% (368,946) |
| Texas: | 9.5% (1,054,577) |
Number of households with income $125k - 150k:| Burlington: | 6.7% (259,487) |
| Texas: | 6.7% (741,518) |
Number of households with income $150k - 200k:| Burlington: | 8.7% (336,376) |
| State: | 8.7% (961,776) |
Number of households with income > $200k:| Burlington: | 10.7% (413,068) |
| Texas: | 10.7% (1,181,544) |
Aggregate household income in Burlington in 2022: $4,615,039,535
Median family income in Burlington in 2022:| Burlington: | $78,065 |
| State: | $86,267 |
Median non-family income in Burlington in 2022:| Burlington: | $13,719 |
| State: | $45,999 |
Change in median non-family income between 2000 and 2022:| Burlington, Texas: | +85.2% |
| Texas: | +79.5% |
Median per capita income in Burlington in 2022:| Burlington: | $28,089 |
| Texas: | $38,123 |
Change in median per capita income between 2000 and 2022:| Burlington, Texas: | +94.2% |
| State: | +94.3% |
Income statistics for White residents
Median household income in Burlington, TX in 2022:| Burlington: | $56,025 |
| State: | $82,032 |
Change in median household income between 2000 and 2022:| Burlington, Texas: | +90.4% |
| State: | +91.0% |
Number of households with income < $10k:| Burlington: | 4.7% (93,497) |
| Texas: | 4.7% (273,716) |
Number of households with income $10k - 20k:| Burlington: | 5.5% (110,432) |
| State: | 5.5% (322,702) |
Number of households with income $20k - 30k:| Burlington: | 6.2% (124,614) |
| Texas: | 6.2% (363,947) |
Number of households with income $30k - 40k:| Burlington: | 6.8% (136,592) |
| State: | 6.8% (399,275) |
Number of households with income $40k - 50k:| Burlington: | 6.5% (131,120) |
| State: | 6.5% (383,417) |
Number of households with income $50k - 60k:| Burlington: | 6.6% (132,846) |
| State: | 6.6% (388,535) |
Number of households with income $60k - 75k:| Burlington: | 9.6% (193,370) |
| State: | 9.7% (566,295) |
Number of households with income $75k - 100k:| Burlington: | 13.0% (259,857) |
| State: | 13.0% (760,276) |
Number of households with income $100k - 125k:| Burlington: | 10.2% (204,257) |
| State: | 10.2% (597,596) |
Number of households with income $125k - 150k:| Burlington: | 7.4% (149,266) |
| Texas: | 7.4% (436,830) |
Number of households with income $150k - 200k:| Burlington: | 9.9% (199,077) |
| State: | 9.9% (583,067) |
Number of households with income > $200k:| Burlington: | 13.5% (269,929) |
| State: | 13.5% (792,647) |
Aggregate household income in Burlington in 2022: $2,333,749,916
Median family income in Burlington in 2022:| Burlington: | $85,663 |
| State: | $101,788 |
Number of families with income < $10k:| Burlington: | 1.2% (2) |
| State: | 2.8% (108,142) |
Number of families with income $10k - 20k:| Burlington: | 7.5% (13) |
| Texas: | 2.9% (113,421) |
Number of families with income $20k - 30k:| Burlington: | 7.9% (14) |
| State: | 4.1% (157,688) |
Number of families with income $30k - 40k:| Burlington: | 7.7% (14) |
| State: | 5.2% (198,847) |
Number of families with income $40k - 50k:| Burlington: | 21.3% (38) |
| Texas: | 5.6% (216,490) |
Number of families with income $50k - 60k:| Burlington: | 6.7% (12) |
| State: | 5.7% (220,689) |
Number of families with income $60k - 75k:| Burlington: | 16.4% (29) |
| State: | 9.0% (346,106) |
Number of families with income $75k - 100k:| Burlington: | 9.9% (18) |
| Texas: | 13.7% (527,363) |
Number of families with income $100k - 125k:| Burlington: | 21.4% (38) |
| State: | 11.6% (448,411) |
Median non-family income in Burlington in 2022:| Burlington: | $16,260 |
| Texas: | $50,587 |
Change in median non-family income between 2000 and 2022:| Burlington, Texas: | +85.8% |
| State: | +87.7% |
Median per capita income in Burlington in 2022:| Burlington: | $32,394 |
| Texas: | $47,740 |
Change in median per capita income between 2000 and 2022:| Burlington, Texas: | +112.1% |
| State: | +114.3% |
Income statistics for Black or African American residents
Median household income in Burlington, TX in 2022:| Burlington: | $17,922 |
| Texas: | $55,759 |
Change in median household income between 2000 and 2022:| Burlington, Texas: | +113.5% |
| State: | +90.3% |
Number of households with income < $10k:| Burlington: | 8.9% (18,031) |
| State: | 8.9% (126,378) |
Number of households with income $10k - 20k:| Burlington: | 9.9% (20,159) |
| Texas: | 9.9% (140,369) |
Number of households with income $20k - 30k:| Burlington: | 8.5% (17,344) |
| State: | 8.5% (120,639) |
Number of households with income $30k - 40k:| Burlington: | 9.7% (19,609) |
| State: | 9.7% (137,517) |
Number of households with income $40k - 50k:| Burlington: | 7.9% (16,109) |
| Texas: | 8.0% (112,973) |
Number of households with income $50k - 60k:| Burlington: | 8.2% (16,692) |
| Texas: | 8.3% (117,156) |
Number of households with income $60k - 75k:| Burlington: | 10.4% (21,071) |
| State: | 10.4% (147,462) |
Number of households with income $75k - 100k:| Burlington: | 11.5% (23,266) |
| State: | 11.5% (162,718) |
Number of households with income $100k - 125k:| Burlington: | 8.1% (16,519) |
| Texas: | 8.2% (115,829) |
Number of households with income $125k - 150k:| Burlington: | 4.9% (10,010) |
| Texas: | 4.9% (69,556) |
Number of households with income $150k - 200k:| Burlington: | 6.4% (12,965) |
| State: | 6.4% (90,701) |
Number of households with income > $200k:| Burlington: | 5.5% (11,138) |
| State: | 5.5% (77,988) |
Aggregate household income in Burlington in 2022: $32,659,206
Median family income in Burlington in 2022:| Burlington: | $47,868 |
| State: | $69,134 |
Number of families with income < $10k:| Burlington: | 27.6% (7) |
| Texas: | 6.8% (55,625) |
Number of families with income $20k - 30k:| Burlington: | 23.7% (6) |
| State: | 7.1% (57,877) |
Number of families with income $40k - 50k:| Burlington: | 48.7% (12) |
| State: | 7.1% (57,907) |
Median non-family income in Burlington in 2022:| Burlington: | $13,789 |
| Texas: | $40,133 |
Change in median non-family income between 2000 and 2022:| Burlington, Texas: | +133.0% |
| State: | +102.2% |
Median per capita income in Burlington in 2022:| Burlington: | $21,865 |
| State: | $30,490 |
Change in median per capita income between 2000 and 2022:| Burlington, Texas: | +116.3% |
| State: | +113.9% |
Income statistics for Hispanic or Latino residents
Median household income in Burlington, TX in 2022:| Burlington: | $76,110 |
| State: | $60,504 |
Change in median household income between 2000 and 2022:| Burlington, Texas: | +112.9% |
| Texas: | +102.5% |
Number of households with income < $10k:| Burlington: | 5.8% (128,164) |
| Texas: | 5.8% (213,953) |
Number of households with income $10k - 20k:| Burlington: | 8.0% (178,246) |
| State: | 8.0% (297,456) |
Number of households with income $20k - 30k:| Burlington: | 9.2% (203,658) |
| State: | 9.2% (340,166) |
Number of households with income $30k - 40k:| Burlington: | 9.5% (212,334) |
| State: | 9.5% (354,336) |
Number of households with income $40k - 50k:| Burlington: | 8.8% (195,828) |
| State: | 8.8% (327,013) |
Number of households with income $50k - 60k:| Burlington: | 8.3% (184,824) |
| Texas: | 8.3% (308,818) |
Number of households with income $60k - 75k:| Burlington: | 10.9% (242,666) |
| Texas: | 10.9% (405,109) |
Number of households with income $75k - 100k:| Burlington: | 13.8% (306,615) |
| State: | 13.8% (511,639) |
Number of households with income $100k - 125k:| Burlington: | 8.6% (191,620) |
| Texas: | 8.6% (319,728) |
Number of households with income $125k - 150k:| Burlington: | 5.7% (126,525) |
| State: | 5.7% (210,932) |
Number of households with income $150k - 200k:| Burlington: | 6.4% (141,305) |
| Texas: | 6.4% (236,055) |
Number of households with income > $200k:| Burlington: | 5.1% (113,448) |
| Texas: | 5.1% (189,259) |
Aggregate household income in Burlington in 2022: $169,205,637
Median family income in Burlington in 2022:| Burlington: | $80,597 |
| State: | $65,080 |
Number of families with income < $10k:| Burlington: | 2.8% (5) |
| Texas: | 5.3% (147,493) |
Number of families with income $10k - 20k:| Burlington: | 16.0% (27) |
| Texas: | 6.3% (174,531) |
Number of families with income $20k - 30k:| Burlington: | 14.8% (25) |
| Texas: | 8.6% (238,528) |
Number of families with income $30k - 40k:| Burlington: | 9.2% (16) |
| Texas: | 9.1% (251,999) |
Number of families with income $40k - 50k:| Burlington: | 20.5% (35) |
| Texas: | 8.6% (240,188) |
Number of families with income $50k - 60k:| Burlington: | 5.4% (9) |
| Texas: | 8.0% (223,566) |
Number of families with income $60k - 75k:| Burlington: | 13.9% (24) |
| State: | 10.9% (302,688) |
Number of families with income $75k - 100k:| Burlington: | 6.8% (12) |
| State: | 14.3% (398,554) |
Number of families with income $100k - 125k:| Burlington: | 10.6% (18) |
| State: | 9.5% (264,007) |
Median non-family income in Burlington in 2022:| Burlington: | $8,281 |
| State: | $39,934 |
Change in median non-family income between 2000 and 2022:| Burlington, Texas: | +120.8% |
| State: | +109.1% |
Median per capita income in Burlington in 2022:| Burlington: | $24,806 |
| State: | $24,862 |
Change in median per capita income between 2000 and 2022:| Burlington, Texas: | +128.5% |
| State: | +130.8% |
Income statistics for American Indian and Alaska Native residents
Median household income in Burlington, TX in 2022:| Burlington: | $36,323 |
| Texas: | $65,765 |
Change in median household income between 2000 and 2022:| Burlington, Texas: | +93.7% |
| State: | +88.3% |
Number of households with income < $10k:| Burlington: | 4.1% (914) |
| State: | 4.1% (3,398) |
Number of households with income $10k - 20k:| Burlington: | 8.3% (1,868) |
| State: | 8.3% (6,949) |
Number of households with income $20k - 30k:| Burlington: | 9.3% (2,082) |
| State: | 9.3% (7,742) |
Number of households with income $30k - 40k:| Burlington: | 9.1% (2,049) |
| State: | 9.1% (7,627) |
Number of households with income $40k - 50k:| Burlington: | 7.1% (1,594) |
| State: | 7.1% (5,922) |
Number of households with income $50k - 60k:| Burlington: | 8.1% (1,818) |
| State: | 8.1% (6,761) |
Number of households with income $60k - 75k:| Burlington: | 12.7% (2,846) |
| State: | 12.7% (10,588) |
Number of households with income $75k - 100k:| Burlington: | 13.0% (2,932) |
| Texas: | 13.0% (10,903) |
Number of households with income $100k - 125k:| Burlington: | 9.9% (2,220) |
| State: | 9.9% (8,256) |
Number of households with income $125k - 150k:| Burlington: | 5.2% (1,170) |
| State: | 5.2% (4,355) |
Number of households with income $150k - 200k:| Burlington: | 6.7% (1,510) |
| Texas: | 6.7% (5,623) |
Number of households with income > $200k:| Burlington: | 6.6% (1,483) |
| State: | 6.6% (5,522) |
Aggregate household income in Burlington in 2022: $439,902
Median family income in Burlington in 2022:| Burlington: | $35,754 |
| Texas: | $72,369 |
Median per capita income in Burlington in 2022:| Burlington: | $14,885 |
| State: | $28,166 |
Change in median per capita income between 2000 and 2022:| Burlington, Texas: | +95.5% |
| Texas: | +77.2% |
Income statistics for other residents
Number of households with income < $10k:| Burlington: | 6.0% (18) |
| State: | 5.9% (54,162) |
Number of households with income $10k - 20k:| Burlington: | 6.6% (20) |
| State: | 6.8% (62,891) |
Number of households with income $20k - 30k:| Burlington: | 10.6% (32) |
| State: | 10.6% (97,294) |
Number of households with income $30k - 40k:| Burlington: | 10.9% (33) |
| Texas: | 10.8% (99,670) |
Number of households with income $40k - 50k:| Burlington: | 9.3% (28) |
| State: | 9.3% (85,548) |
Number of households with income $50k - 60k:| Burlington: | 8.9% (27) |
| State: | 9.0% (82,757) |
Number of households with income $60k - 75k:| Burlington: | 10.9% (33) |
| State: | 10.9% (100,326) |
Number of households with income $75k - 100k:| Burlington: | 13.9% (42) |
| Texas: | 14.0% (128,767) |
Number of households with income $100k - 125k:| Burlington: | 8.3% (25) |
| State: | 8.2% (75,218) |
Number of households with income $125k - 150k:| Burlington: | 5.0% (15) |
| State: | 4.8% (44,223) |
Number of households with income $150k - 200k:| Burlington: | 5.6% (17) |
| State: | 5.6% (51,376) |
Number of households with income > $200k:| Burlington: | 4.0% (12) |
| Texas: | 4.0% (36,393) |
Aggregate household income in Burlington in 2022: $22,225,491
Median family income in Burlington in 2022:| Burlington: | $61,895 |
| State: | $60,064 |
Number of families with income < $10k:| Burlington: | 4.3% (2) |
| State: | 6.8% (47,502) |
Number of families with income $20k - 30k:| Burlington: | 9.9% (5) |
| State: | 9.9% (68,761) |
Number of families with income $30k - 40k:| Burlington: | 8.3% (4) |
| Texas: | 9.7% (67,685) |
Number of families with income > $200k:| Burlington: | 77.4% (42) |
| State: | 4.5% (31,243) |
Median non-family income in Burlington in 2022:| Burlington: | $10,498 |
| State: | $38,690 |
Change in median non-family income between 2000 and 2022:| Burlington, Texas: | +123.9% |
| State: | +90.2% |
Median per capita income in Burlington in 2022:| Burlington: | $33,856 |
| State: | $23,899 |
Change in median per capita income between 2000 and 2022:| Burlington, Texas: | +141.8% |
| Texas: | +135.2% |