Agency, Montana (MT) income map, earnings map, and wages data
The median household income in Agency, MT in 2022 was $45,604, which was 48.3% less than the median annual income of $67,631 across the entire state of Montana. Compared to the median income of $22,308 in 2000 this represents an increase of 51.1%. The per capita income in 2022 was $29,034, which means an increase of 55.3% compared to 2000 when it was $12,990.
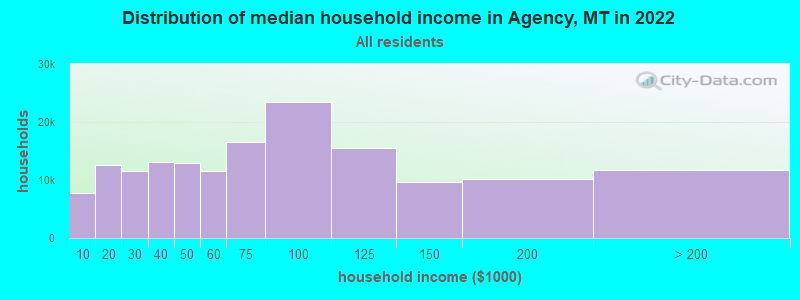
Income statistics for all residents
Median household income in Agency, MT in 2022:| Agency: | $45,605 |
| State: | $67,631 |
Change in median household income between 2000 and 2022:| Agency, Montana: | +104.4% |
| State: | +104.8% |
Number of households with income < $10k:| Agency: | 5.0% (7,831) |
| State: | 5.0% (23,231) |
Number of households with income $10k - 20k:| Agency: | 8.1% (12,669) |
| State: | 8.1% (37,478) |
Number of households with income $20k - 30k:| Agency: | 7.3% (11,495) |
| State: | 7.3% (33,880) |
Number of households with income $30k - 40k:| Agency: | 8.4% (13,116) |
| State: | 8.4% (38,912) |
Number of households with income $40k - 50k:| Agency: | 8.3% (13,000) |
| Montana: | 8.3% (38,441) |
Number of households with income $50k - 60k:| Agency: | 7.4% (11,515) |
| Montana: | 7.4% (34,172) |
Number of households with income $60k - 75k:| Agency: | 10.5% (16,466) |
| State: | 10.5% (48,783) |
Number of households with income $75k - 100k:| Agency: | 15.0% (23,505) |
| State: | 15.0% (69,571) |
Number of households with income $100k - 125k:| Agency: | 9.9% (15,503) |
| State: | 9.9% (45,889) |
Number of households with income $125k - 150k:| Agency: | 6.1% (9,605) |
| State: | 6.1% (28,538) |
Number of households with income $150k - 200k:| Agency: | 6.5% (10,236) |
| State: | 6.6% (30,552) |
Number of households with income > $200k:| Agency: | 7.4% (11,644) |
| Montana: | 7.5% (34,625) |
Aggregate household income in Agency in 2022: $33,859,823
Median family income in Agency in 2022:| Agency: | $72,165 |
| State: | $83,580 |
Median non-family income in Agency in 2022:| Agency: | $16,571 |
| State: | $40,582 |
Change in median non-family income between 2000 and 2022:| Agency, Montana: | +103.9% |
| State: | +108.3% |
Median per capita income in Agency in 2022:| Agency: | $29,035 |
| State: | $38,329 |
Change in median per capita income between 2000 and 2022:| Agency, Montana: | +123.5% |
| Montana: | +123.5% |
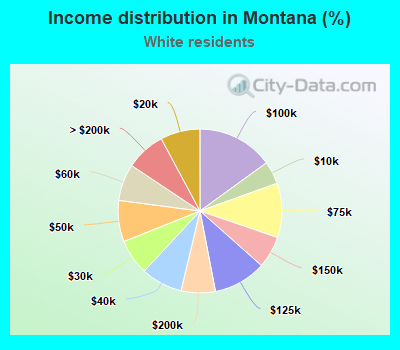
Income statistics for White residents
Median household income in Agency, MT in 2022:| Agency: | $64,627 |
| Montana: | $69,744 |
Change in median household income between 2000 and 2022:| Agency, Montana: | +106.8% |
| Montana: | +106.5% |
Number of households with income < $10k:| Agency: | 4.5% (8,549) |
| Montana: | 4.5% (18,406) |
Number of households with income $10k - 20k:| Agency: | 7.8% (14,885) |
| State: | 7.8% (32,061) |
Number of households with income $20k - 30k:| Agency: | 7.1% (13,431) |
| Montana: | 7.0% (28,825) |
Number of households with income $30k - 40k:| Agency: | 8.2% (15,525) |
| State: | 8.2% (33,552) |
Number of households with income $40k - 50k:| Agency: | 8.2% (15,541) |
| State: | 8.2% (33,446) |
Number of households with income $50k - 60k:| Agency: | 7.2% (13,766) |
| Montana: | 7.3% (29,753) |
Number of households with income $60k - 75k:| Agency: | 10.8% (20,431) |
| State: | 10.7% (44,051) |
Number of households with income $75k - 100k:| Agency: | 15.0% (28,542) |
| State: | 15.0% (61,580) |
Number of households with income $100k - 125k:| Agency: | 10.4% (19,770) |
| State: | 10.4% (42,636) |
Number of households with income $125k - 150k:| Agency: | 6.3% (11,994) |
| State: | 6.3% (25,938) |
Number of households with income $150k - 200k:| Agency: | 6.7% (12,758) |
| Montana: | 6.8% (27,704) |
Number of households with income > $200k:| Agency: | 7.8% (14,810) |
| State: | 7.8% (32,101) |
Aggregate household income in Agency in 2022: $2,234,752
Median family income in Agency in 2022:| Agency: | $96,445 |
| Montana: | $86,163 |
Median non-family income in Agency in 2022:| Agency: | $33,449 |
| Montana: | $41,403 |
Change in median non-family income between 2000 and 2022:| Agency, Montana: | +105.8% |
| State: | +109.4% |
Median per capita income in Agency in 2022:| Agency: | $61,163 |
| State: | $40,453 |
Change in median per capita income between 2000 and 2022:| Agency, Montana: | +125.9% |
| State: | +125.6% |
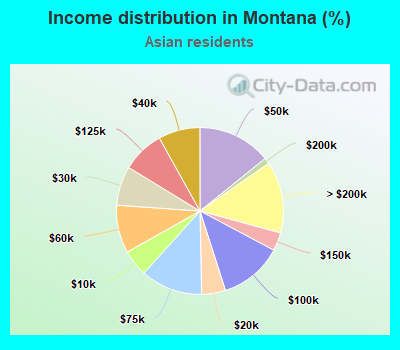
Income statistics for Asian residents
Median household income in Agency, MT in 2022:| Agency: | $171,888 |
| State: | $56,041 |
Change in median household income between 2000 and 2022:| Agency, Montana: | +102.2% |
| Montana: | +129.5% |
Number of households with income < $10k:| Agency: | 5.3% (593,194) |
| State: | 5.1% (160) |
Number of households with income $10k - 20k:| Agency: | 4.8% (535,496) |
| Montana: | 4.6% (144) |
Number of households with income $20k - 30k:| Agency: | 4.7% (524,112) |
| State: | 7.6% (237) |
Number of households with income $30k - 40k:| Agency: | 4.7% (520,251) |
| Montana: | 8.1% (251) |
Number of households with income $40k - 50k:| Agency: | 4.6% (512,297) |
| Montana: | 14.2% (442) |
Number of households with income $50k - 60k:| Agency: | 4.8% (531,720) |
| State: | 9.3% (289) |
Number of households with income $60k - 75k:| Agency: | 6.9% (762,552) |
| Montana: | 12.0% (373) |
Number of households with income $75k - 100k:| Agency: | 10.9% (1,208,004) |
| State: | 12.3% (382) |
Number of households with income $100k - 125k:| Agency: | 10.0% (1,107,438) |
| State: | 8.2% (255) |
Number of households with income $125k - 150k:| Agency: | 7.8% (871,432) |
| State: | 3.5% (110) |
Number of households with income $150k - 200k:| Agency: | 11.8% (1,315,206) |
| State: | 1.1% (35) |
Number of households with income > $200k:| Agency: | 23.7% (2,640,373) |
| State: | 13.9% (433) |
Aggregate household income in Agency in 2022: $3,651,794
Median family income in Agency in 2022:| Agency: | $158,939 |
| State: | $83,670 |
Median non-family income in Agency in 2022:| Agency: | $276,076 |
| Montana: | $40,149 |
Median per capita income in Agency in 2022:| Agency: | $224,946 |
| Montana: | $44,327 |
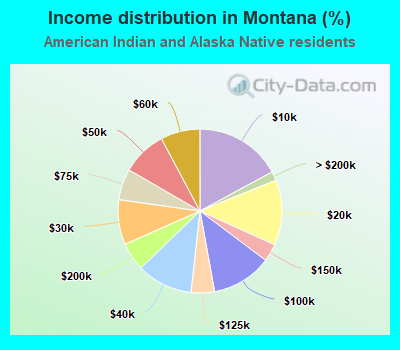
Income statistics for American Indian and Alaska Native residents
Median household income in Agency, MT in 2022:| Agency: | $38,876 |
| State: | $40,063 |
Change in median household income between 2000 and 2022:| Agency, Montana: | +82.9% |
| State: | +77.9% |
Number of households with income < $10k:| Agency: | 16.6% (1,393) |
| Montana: | 17.1% (3,122) |
Number of households with income $10k - 20k:| Agency: | 13.0% (1,085) |
| State: | 12.9% (2,355) |
Number of households with income $20k - 30k:| Agency: | 9.0% (755) |
| State: | 8.9% (1,620) |
Number of households with income $30k - 40k:| Agency: | 11.2% (939) |
| State: | 11.0% (2,013) |
Number of households with income $40k - 50k:| Agency: | 8.9% (744) |
| State: | 8.8% (1,615) |
Number of households with income $50k - 60k:| Agency: | 8.1% (681) |
| State: | 7.8% (1,423) |
Number of households with income $60k - 75k:| Agency: | 5.7% (476) |
| Montana: | 6.1% (1,117) |
Number of households with income $75k - 100k:| Agency: | 12.5% (1,046) |
| Montana: | 11.9% (2,169) |
Number of households with income $100k - 125k:| Agency: | 4.6% (384) |
| State: | 4.6% (845) |
Number of households with income $125k - 150k:| Agency: | 3.4% (283) |
| State: | 3.5% (637) |
Number of households with income $150k - 200k:| Agency: | 5.1% (431) |
| State: | 5.6% (1,015) |
Number of households with income > $200k:| Agency: | 1.8% (154) |
| State: | 1.8% (324) |
Aggregate household income in Agency in 2022: $4,631,799
Median family income in Agency in 2022:| Agency: | $39,127 |
| State: | $41,048 |
Number of families with income < $10k:| Agency: | 3.3% (2) |
| State: | 10.3% (1,176) |
Number of families with income $10k - 20k:| Agency: | 5.0% (3) |
| Montana: | 12.8% (1,470) |
Number of families with income $20k - 30k:| Agency: | 7.8% (5) |
| State: | 8.1% (932) |
Number of families with income $30k - 40k:| Agency: | 11.3% (8) |
| Montana: | 17.4% (1,998) |
Number of families with income $40k - 50k:| Agency: | 1.4% (1) |
| State: | 5.9% (680) |
Number of families with income $50k - 60k:| Agency: | 2.8% (2) |
| State: | 7.6% (866) |
Number of families with income $75k - 100k:| Agency: | 12.2% (8) |
| Montana: | 10.0% (1,145) |
Number of families with income $100k - 125k:| Agency: | 12.4% (9) |
| Montana: | 6.4% (738) |
Number of families with income $125k - 150k:| Agency: | 43.8% (30) |
| Montana: | 3.6% (415) |
Median non-family income in Agency in 2022:| Agency: | $13,747 |
| State: | $23,519 |
Change in median non-family income between 2000 and 2022:| Agency, Montana: | +103.7% |
| Montana: | +93.1% |
Median per capita income in Agency in 2022:| Agency: | $20,961 |
| State: | $19,038 |
Change in median per capita income between 2000 and 2022:| Agency, Montana: | +129.4% |
| Montana: | +114.7% |
Income statistics for Multirace residents
Number of households with income < $10k:| Agency: | 4.3% (4) |
| State: | 4.3% (1,142) |
Number of households with income $10k - 20k:| Agency: | 6.4% (6) |
| Montana: | 7.2% (1,913) |
Number of households with income $20k - 30k:| Agency: | 8.5% (8) |
| State: | 8.7% (2,315) |
Number of households with income $30k - 40k:| Agency: | 10.6% (10) |
| State: | 10.7% (2,822) |
Number of households with income $40k - 50k:| Agency: | 8.5% (8) |
| State: | 9.0% (2,396) |
Number of households with income $50k - 60k:| Agency: | 8.5% (8) |
| State: | 8.7% (2,311) |
Number of households with income $60k - 75k:| Agency: | 11.7% (11) |
| State: | 11.5% (3,043) |
Number of households with income $75k - 100k:| Agency: | 16.0% (15) |
| Montana: | 15.3% (4,050) |
Number of households with income $100k - 125k:| Agency: | 8.5% (8) |
| Montana: | 7.9% (2,089) |
Number of households with income $125k - 150k:| Agency: | 5.3% (5) |
| State: | 5.8% (1,541) |
Number of households with income $150k - 200k:| Agency: | 6.4% (6) |
| State: | 6.0% (1,587) |
Number of households with income > $200k:| Agency: | 5.3% (5) |
| State: | 4.8% (1,271) |
Median per capita income in Agency in 2022: