Wilmington, DE (Delaware) Houses and Residents
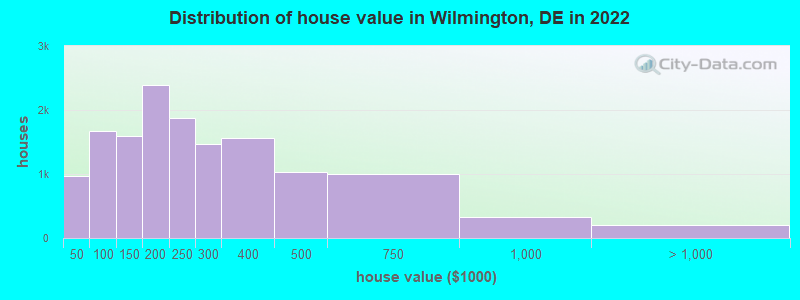
Estimated median house or condo value in 2022: $217,300 (it was $89,300 in 2000 )
Wilmington:
$217,300Delaware:
$337,200
Lower value quartile - upper value quartile: $122,700 - $318,700Mean price in 2022: Detached houses: $517,826 Here:
$517,826State:
$419,599
Townhouses or other attached units: $248,245 Here:
$248,245State:
$291,415
In 2-unit structures: $140,225 Here:
$140,225State:
$301,231
In 3-to-4-unit structures: $198,365 Here:
$198,365State:
$543,616
In 5-or-more-unit structures: $286,732 Here:
$286,732State:
$212,751
Mobile homes: $431,629 Here:
$431,629State:
$106,273
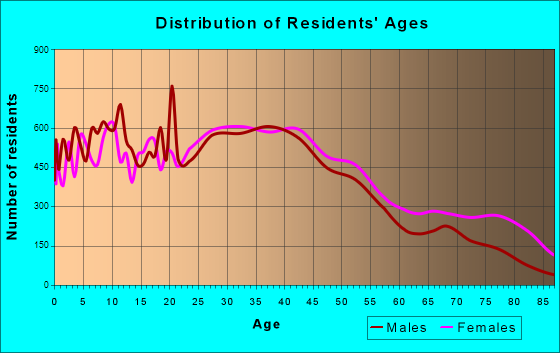
Total population: 71,817 (All urban)
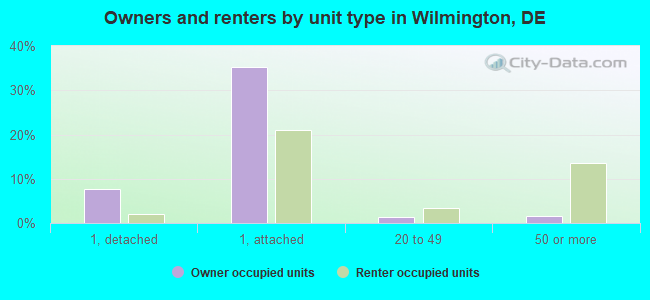
Houses: 36,697 (32,239 occupied: 15,037 owner occupied, 17,202 renter occupied )
% of renters here:
53%State:
26%
Housing density: 3,383 houses/condos per square mile
Median price asked for vacant for-sale houses and condos in 2022: $306,127.
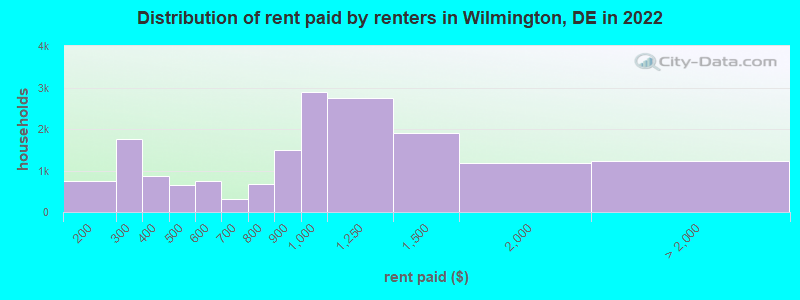
Median contract rent in 2022: $941 (lower quartile is $527, upper quartile is $1,230)
Median rent asked for vacant for-rent units in 2022: $575
Median gross rent in Wilmington, DE in 2022: $1,166
Housing units in Wilmington with a mortgage: 10,093 (552 second mortgage, 0 home equity loan, 372 both second mortgage and home equity loan )Houses without a mortgage: 426
Median household income for houses/condos with a mortgage: $84,216
Median household income for apartments without a mortgage: $49,626
Median monthly housing costs: $1,137
Data:
Median house or condo value ($)
Median house or condo value ($ change since 2000)
Median house or condo value ($) - White
Median house or condo value ($) - Black or African American
Median house or condo value ($) - Asian
Median house or condo value ($) - Hispanic or Latino
Median house or condo value ($) - American Indian and Alaska Native
Median house or condo value ($) - Multirace
Median house or condo value ($) - Other Race
Median price asked for mobile homes ($)
Household density (households per square mile)
Mean house or condo value by units in structure - 1, detached ($)
Mean house or condo value by units in structure - 1, attached ($)
Mean house or condo value by units in structure - 2 ($)
Mean house or condo value by units in structure by units in structure - 3 or 4 ($)
Mean house or condo value by units in structure - 5 or more ($)
Mean house or condo value by units in structure - Boat, RV, van, etc. ($)
Mean house or condo value by units in structure - Mobile home ($)
Median contract rent ($)
Median contract rent - Lower quartile ($)
Median contract rent - Upper quartile ($)
Median gross rent ($)
Urban houses (%)
Rural houses (%)
Houses occupied (%)
Houses occupied (% change since 2000)
Houses owner occupied (%)
Houses owner occupied (% change since 2000)
Houses renter occupied (%)
Houses renter occupied (% change since 2000)
Vacant housing units - For rent (%)
Vacant housing units - For rent (% change since 2000)
Vacant housing units - For sale only (%)
Vacant housing units - For sale only (% change since 2000)
Vacant housing units - Rented or sold, not occupied (%)
Vacant housing units - Rented or sold, not occupied (% change since 2000)
Vacant housing units - For seasonal, recreational, or occasional use (%)
Vacant housing units - For seasonal, recreational, or occasional use (% change since 2000)
Vacant housing units - For migrant workers (%)
Vacant housing units - For migrant workers (% change since 2000)
Vacant housing units - Other vacant (%)
Vacant housing units - Other vacant (% change since 2000)
Median monthly housing costs ($)
Median household income for houses/condos with a mortgage ($)
Median household income for houses/condos without a mortgage ($)
Median household income ($)
Median household income ($) - White
Median household income ($) - Black or African American
Median household income ($) - Asian
Median household income ($) - Hispanic or Latino
Median household income ($) - American Indian and Alaska Native
Median household income ($) - Multirace
Median household income ($) - Other Race
Mortgage status - with mortgage (%)
Mortgage status - with second mortgage (%)
Mortgage status - with home equity loan (%)
Mortgage status - with both second mortgage and home equity loan (%)
Mortgage status - without a mortgage (%)
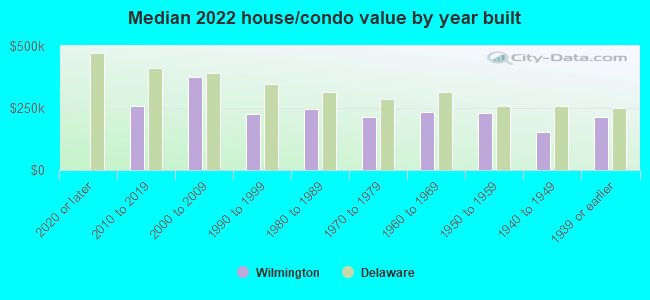
Median year house/condo built
Median year apartment built
Household type by relationship - Male householder living alone (%)
Household type by relationship - Male householder not living alone (%)
Household type by relationship - Female householder living alone (%)
Household type by relationship - Female householder not living alone (%)
Household type by relationship - Opposite-Sex spouse (%)
Household type by relationship - Same-Sex spouse (%)
Household type by relationship - Opposite-Sex unmarried partner (%)
Household type by relationship - Same-Sex unmarried partner (%)
Household type by relationship - In group quarters (%)
Size of family households - 2-person household (%)
Size of family households - 3-person household (%)
Size of family households - 4-person household (%)
Size of family households - 5-person household (%)
Size of family households - 6-person household (%)
Size of family households - 7-or-more-person household (%)
Size of nonfamily households - 1-person household (%)
Size of nonfamily households - 2-person household (%)
Size of nonfamily households - 3-person household (%)
Size of nonfamily households - 4-person household (%)
Size of nonfamily households - 5-person household (%)
Size of nonfamily households - 6-person household (%)
Size of nonfamily households - 7-or-moreperson household (%)
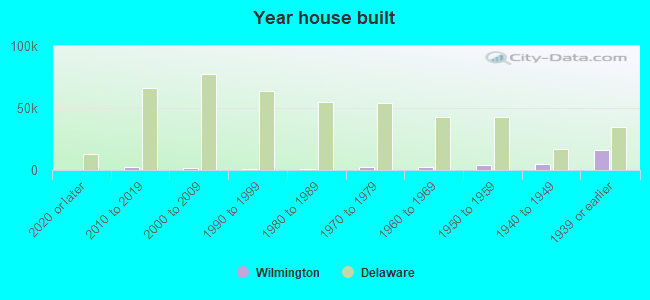
Year house built - Built 2010 or later (%)
Year house built - Built 2000 to 2009 (%)
Year house built - Built 1990 to 1999 (%)
Year house built - Built 1980 to 1989 (%)
Year house built - Built 1970 to 1979 (%)
Year house built - Built 1960 to 1969 (%)
Year house built - Built 1950 to 1959 (%)
Year house built - Built 1940 to 1949 (%)
Year house built - Built 1939 or earlier (%)
Median number of rooms in houses and condos
Median number of rooms in apartments
Median number of bedrooms in owner occupied houses
Mean number of bedrooms in owner occupied houses
Median number of bedrooms in renter occupied houses
Mean number of bedrooms in renter occupied houses
Median number of vehichles in owner occupied houses
Mean number of vehichles in owner occupied houses
Median number of vehichles in renter occupied houses
Mean number of vehichles in renter occupied houses
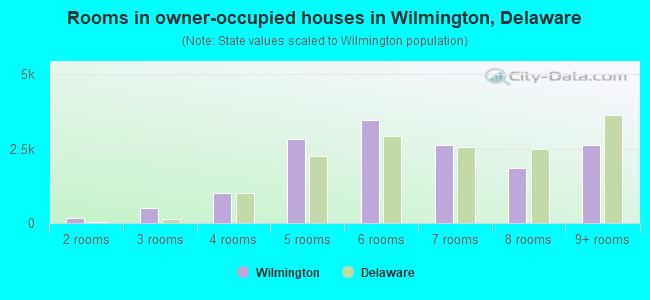
Rooms in owner-occupied houses - 1 room (%)
Rooms in owner-occupied houses - 2 rooms (%)
Rooms in owner-occupied houses - 3 rooms (%)
Rooms in owner-occupied houses - 4 rooms (%)
Rooms in owner-occupied houses - 5 rooms (%)
Rooms in owner-occupied houses - 6 rooms (%)
Rooms in owner-occupied houses - 7 rooms (%)
Rooms in owner-occupied houses - 8 rooms (%)
Rooms in owner-occupied houses - 9+ rooms (%)
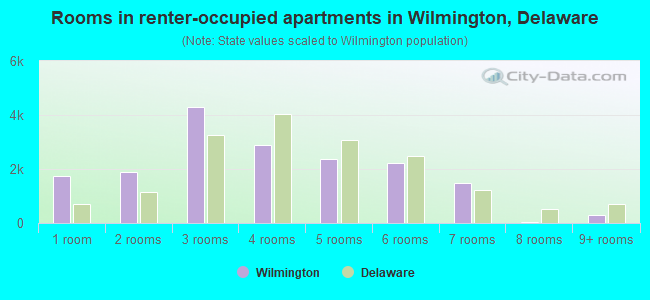
Rooms in renter-occupied houses - 1 room (%)
Rooms in renter-occupied houses - 2 rooms (%)
Rooms in renter-occupied houses - 3 rooms (%)
Rooms in renter-occupied houses - 4 rooms (%)
Rooms in renter-occupied houses - 5 rooms (%)
Rooms in renter-occupied houses - 6 rooms (%)
Rooms in renter-occupied houses - 7 rooms (%)
Rooms in renter-occupied houses - 8 rooms (%)
Rooms in renter-occupied houses - 9+ rooms (%)
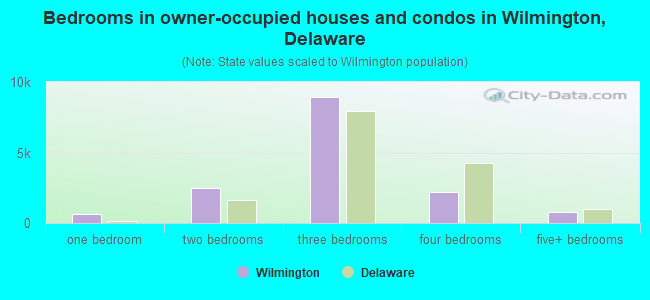
Bedrooms in owner-occupied houses - no bedrooms (%)
Bedrooms in owner-occupied houses - 1 bedroom (%)
Bedrooms in owner-occupied houses - 2 bedrooms (%)
Bedrooms in owner-occupied houses - 3 bedrooms (%)
Bedrooms in owner-occupied houses - 4 bedrooms (%)
Bedrooms in owner-occupied houses - 5+ bedrooms (%)
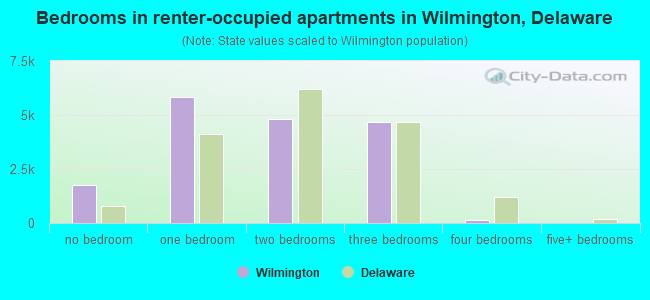
Bedrooms in renter-occupied houses - no bedrooms (%)
Bedrooms in renter-occupied houses - 1 bedroom (%)
Bedrooms in renter-occupied houses - 2 bedrooms (%)
Bedrooms in renter-occupied houses - 3 bedrooms (%)
Bedrooms in renter-occupied houses - 4 bedrooms (%)
Bedrooms in renter-occupied houses - 5+ bedrooms (%)
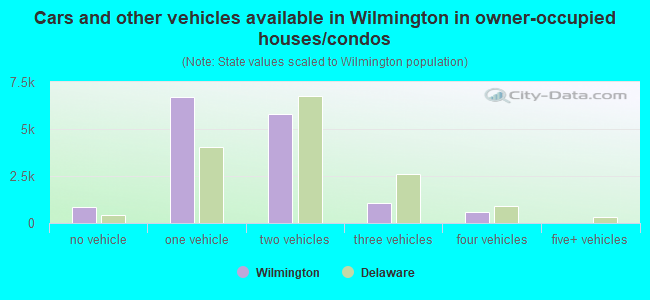
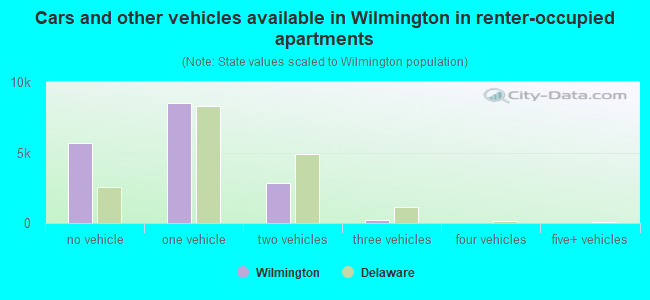
Vehicles available in owner-occupied houses - no vehicle available (%)
Vehicles available in owner-occupied houses - 1 vehicle available(%)
Vehicles available in owner-occupied houses - 2 Vehicles available (%)
Vehicles available in owner-occupied houses - 3 Vehicles available (%)
Vehicles available in owner-occupied houses - 4 Vehicles available (%)
Vehicles available in owner-occupied houses - 5+ Vehicles available (%)
Vehicles available in renter-occupied houses - no vehicle available (%)
Vehicles available in renter-occupied houses - 1 vehicle available (%)
Vehicles available in renter-occupied houses - 2 Vehicles available (%)
Vehicles available in renter-occupied houses - 3 Vehicles available (%)
Vehicles available in renter-occupied houses - 4 Vehicles available (%)
Vehicles available in renter-occupied houses - 5+ Vehicles available (%)
Housing units in structures - 1, detached (%)
Housing units in structures - 1, attached (%)
Housing units in structures - 2 (%)
Housing units in structures - 3 or 4 (%)
Housing units in structures - 5 to 9 (%)
Housing units in structures - 10 to 19 (%)
Housing units in structures - 20 to 49 (%)
Housing units in structures - 50 or more (%)
Housing units in structures - Mobile home (%)
Housing units in structures - Boat, RV, van, etc. (%)
Housing units in structures - Owners - 1, detached (%)
Housing units in structures - Owners - 1, attached (%)
Housing units in structures - Owners - 2 (%)
Housing units in structures - Owners - 3 or 4 (%)
Housing units in structures - Owners - 5 to 9 (%)
Housing units in structures - Owners - 10 to 19 (%)
Housing units in structures - Owners - 20 to 49 (%)
Housing units in structures - Owners - 50 or more (%)
Housing units in structures - Owners - Mobile home (%)
Housing units in structures - Owners - Boat, RV, van, etc. (%)
Housing units in structures - Renters - 1, detached (%)
Housing units in structures - Renters - 1, attached (%)
Housing units in structures - Renters - 2 (%)
Housing units in structures - Renters - 3 or 4 (%)
Housing units in structures - Renters - 5 to 9 (%)
Housing units in structures - Renters - 10 to 19 (%)
Housing units in structures - Renters - 20 to 49 (%)
Housing units in structures - Renters - 50 or more (%)
Housing units in structures - Renters - Mobile home (%)
Housing units in structures - Renters - Boat, RV, van, etc. (%)
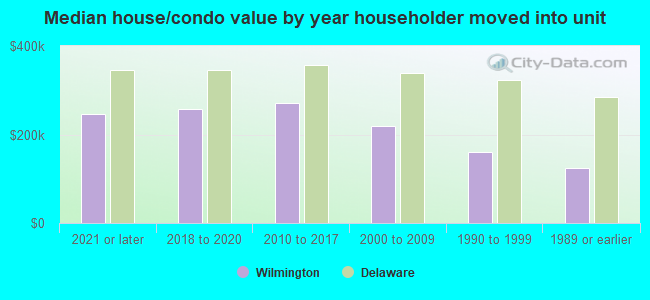
House/condo owner moved in on average (years ago)
Renter moved in on average (years ago)
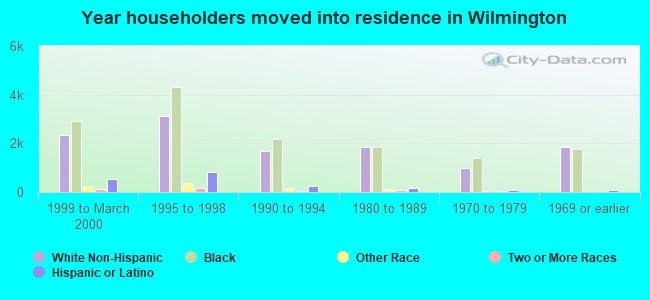
Year householder moved into unit - Moved in 1999 to March 2000 (%)
Year householder moved into unit - Moved in 1999 to March 2000 (%) - White
Year householder moved into unit - Moved in 1999 to March 2000 (%) - Black or African American
Year householder moved into unit - Moved in 1999 to March 2000 (%) - Asian
Year householder moved into unit - Moved in 1999 to March 2000 (%) - Hispanic or Latino
Year householder moved into unit - Moved in 1999 to March 2000 (%) - American Indian and Alaska Native
Year householder moved into unit - Moved in 1999 to March 2000 (%) - Multirace
Year householder moved into unit - Moved in 1999 to March 2000 (%) - Other Race
Year householder moved into unit - Moved in 1995 to 1998 (%)
Year householder moved into unit - Moved in 1995 to 1998 (%) - White
Year householder moved into unit - Moved in 1995 to 1998 (%) - Black or African American
Year householder moved into unit - Moved in 1995 to 1998 (%) - Asian
Year householder moved into unit - Moved in 1995 to 1998 (%) - Hispanic or Latino
Year householder moved into unit - Moved in 1995 to 1998 (%) - American Indian and Alaska Native
Year householder moved into unit - Moved in 1995 to 1998 (%) - Multirace
Year householder moved into unit - Moved in 1995 to 1998 (%) - Other Race
Year householder moved into unit - Moved in 1990 to 1994 (%)
Year householder moved into unit - Moved in 1990 to 1994 (%) - White
Year householder moved into unit - Moved in 1990 to 1994 (%) - Black or African American
Year householder moved into unit - Moved in 1990 to 1994 (%) - Asian
Year householder moved into unit - Moved in 1990 to 1994 (%) - Hispanic or Latino
Year householder moved into unit - Moved in 1990 to 1994 (%) - American Indian and Alaska Native
Year householder moved into unit - Moved in 1990 to 1994 (%) - Multirace
Year householder moved into unit - Moved in 1990 to 1994 (%) - Other Race
Year householder moved into unit - Moved in 1980 to 1989 (%)
Year householder moved into unit - Moved in 1980 to 1989 (%) - White
Year householder moved into unit - Moved in 1980 to 1989 (%) - Black or African American
Year householder moved into unit - Moved in 1980 to 1989 (%) - Asian
Year householder moved into unit - Moved in 1980 to 1989 (%) - Hispanic or Latino
Year householder moved into unit - Moved in 1980 to 1989 (%) - American Indian and Alaska Native
Year householder moved into unit - Moved in 1980 to 1989 (%) - Multirace
Year householder moved into unit - Moved in 1980 to 1989 (%) - Other Race
Year householder moved into unit - Moved in 1970 to 1979 (%)
Year householder moved into unit - Moved in 1970 to 1979 (%) - White
Year householder moved into unit - Moved in 1970 to 1979 (%) - Black or African American
Year householder moved into unit - Moved in 1970 to 1979 (%) - Asian
Year householder moved into unit - Moved in 1970 to 1979 (%) - Hispanic or Latino
Year householder moved into unit - Moved in 1970 to 1979 (%) - American Indian and Alaska Native
Year householder moved into unit - Moved in 1970 to 1979 (%) - Multirace
Year householder moved into unit - Moved in 1970 to 1979 (%) - Other Race
Year householder moved into unit - Moved in 1969 or earlier (%)
Year householder moved into unit - Moved in 1969 or earlier (%) - White
Year householder moved into unit - Moved in 1969 or earlier (%) - Black or African American
Year householder moved into unit - Moved in 1969 or earlier (%) - Asian
Year householder moved into unit - Moved in 1969 or earlier (%) - Hispanic or Latino
Year householder moved into unit - Moved in 1969 or earlier (%) - American Indian and Alaska Native
Year householder moved into unit - Moved in 1969 or earlier (%) - Multirace
Year householder moved into unit - Moved in 1969 or earlier (%) - Other Race
Housing units lacking complete plumbing facilities (%)
Housing units lacking complete kitchen facilities (%)
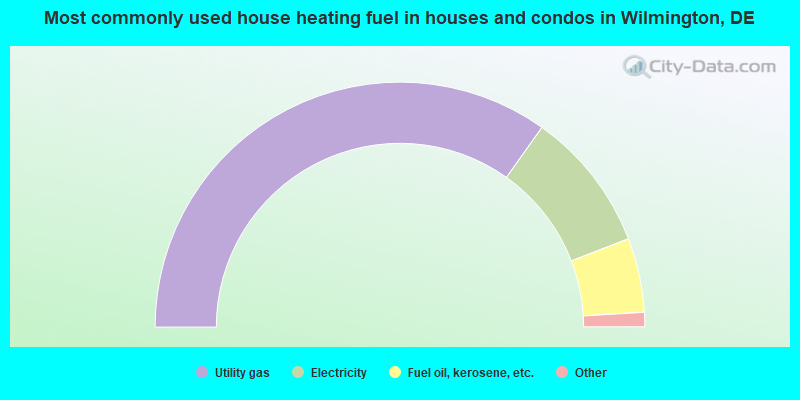
House heating fuel used in houses and condos - Utility gas (%)
House heating fuel used in houses and condos - Bottled, tank, or LP gas (%)
House heating fuel used in houses and condos - Electricity (%)
House heating fuel used in houses and condos - Fuel oil, kerosene, etc. (%)
House heating fuel used in houses and condos - Coal or coke (%)
House heating fuel used in houses and condos - Wood (%)
House heating fuel used in houses and condos - Solar energy (%)
House heating fuel used in houses and condos - Other fuel (%)
House heating fuel used in houses and condos - No fuel used (%)
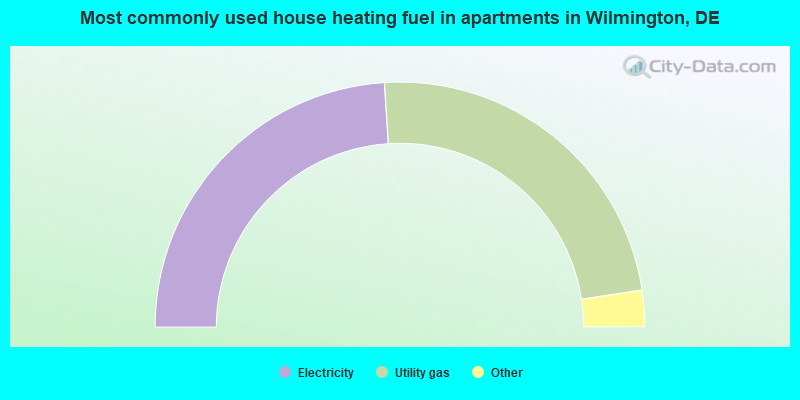
House heating fuel used in apartments - Utility gas (%)
House heating fuel used in apartments - Bottled, tank, or LP gas (%)
House heating fuel used in apartments - Electricity (%)
House heating fuel used in apartments - Fuel oil, kerosene, etc. (%)
House heating fuel used in apartments - Coal or coke (%)
House heating fuel used in apartments - Wood (%)
House heating fuel used in apartments - Solar energy (%)
House heating fuel used in apartments - Other fuel (%)
House heating fuel used in apartments - No fuel used (%)
Latest news about housing in Wilmington, DE collected exclusively by city-data.com from local newspapers, TV, and radio stations
Median year house/condo built: 1938Median year apartment built: 1954Household type by relationship:
Households: 71,568
Male householders: 14,122 (6,527 living alone ), Female householders: 18,117 (8,448 living alone )6,866 spouses (6,804 opposite-sex spouses ), 2,728 unmarried partners , (2,361 opposite-sex unmarried partners ), 17,321 children (15,867 natural , 968 adopted , 486 stepchildren ), 3,963 grandchildren , 830 brothers or sisters , 686 parents , 0 foster children , 1,024 other relatives , 3,733 non-relatives In group quarters: 2,178
Size of family households: 5,351 2-persons , 4,381 3-persons , 3,564 4-persons , 634 5-persons , 225 6-persons , 358 7-or-more-persons .
Size of nonfamily households: 14,975 1-person , 2,636 2-persons , 115 4-persons .
3,306 married couples with children. single-parent households (1,946 men , 6,038 women ).
87.8% of residents of Wilmington speak English at home. of residents speak Spanish at home (54% speak English very well , 21% speak English well , 22% speak English not well , 3% don't speak English at all ).of residents speak other Indo-European language at home (93% speak English very well , 7% speak English well ).of residents speak Asian or Pacific Island language at home (84% speak English very well , 11% speak English well , 5% speak English not well ).of residents speak other language at home (67% speak English very well , 21% speak English well , 12% speak English not well ).
Foreign born population: 5,717 (8.0%)of them are naturalized citizens )
Median number of rooms in houses and condos:
Median number of rooms in apartments
Owner-occupied Renter-occupied
Rooms in owner-occupied houses in Wilmington, Delaware
0 1 room 172 2 rooms 508 3 rooms 1,008 4 rooms 2,833 5 rooms 3,453 6 rooms 2,620 7 rooms 1,839 8 rooms 2,604 9+ rooms
Rooms in renter-occupied apartments in Wilmington, Delaware
1,741 1 room 1,871 2 rooms 4,301 3 rooms 2,900 4 rooms 2,386 5 rooms 2,224 6 rooms 1,464 7 rooms 34 8 rooms 281 9+ rooms
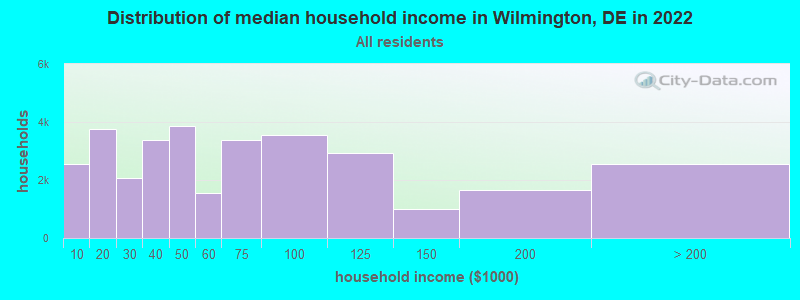
Wilmington, DE household income distribution 2,561 Less than $10,0003,764 $10,000 to $19,9992,072 $20,000 to $29,9993,366 $30,000 to $39,9993,876 $40,000 to $49,9991,537 $50,000 to $59,9993,370 $60,000 to $74,9993,565 $75,000 to $99,9992,916 $100,000 to $124,9991,017 $125,000 to $149,9991,644 $150,000 to $199,9992,551 $200,000 or more
Home value of owner - occupied houses in 2022 in Wilmington, DE 151 Less than $10,000126 $10,000 to $14,999193 $15,000 to $19,99967 $20,000 to $24,99972 $25,000 to $29,99978 $30,000 to $34,99926 $35,000 to $39,999255 $40,000 to $49,999150 $50,000 to $59,999285 $60,000 to $69,999305 $70,000 to $79,999478 $80,000 to $89,999200 $90,000 to $99,999867 $100,000 to $124,999733 $125,000 to $149,9991,561 $150,000 to $174,999827 $175,000 to $199,9991,870 $200,000 to $249,9991,475 $250,000 to $299,9991,561 $300,000 to $399,9991,034 $400,000 to $499,999992 $500,000 to $749,999323 $750,000 to $999,999135 $1,000,000 to $1,499,99956 $1,500,000 to $1,999,99917 $2,000,000 or moreRent paid by renters in 2022 in Wilmington, DE 689 $100 to $14962 $150 to $199964 $200 to $249793 $250 to $299358 $300 to $349519 $350 to $399425 $400 to $449215 $450 to $499357 $500 to $549402 $550 to $599201 $600 to $649107 $650 to $699216 $700 to $749458 $750 to $7991,492 $800 to $8992,881 $900 to $9992,737 $1,000 to $1,2491,914 $1,250 to $1,4991,184 $1,500 to $1,999778 $2,000 to $2,499125 $2,500 to $2,999325 No cash rent
Percentage of workers working in this county: 85.9%Number of people working at home: 5,426 (15.5% of all workers )
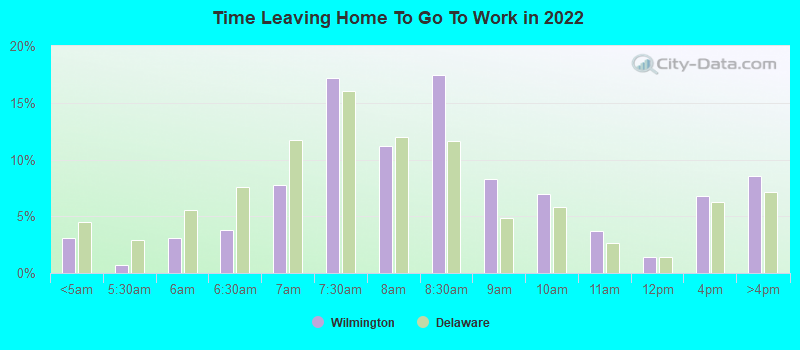
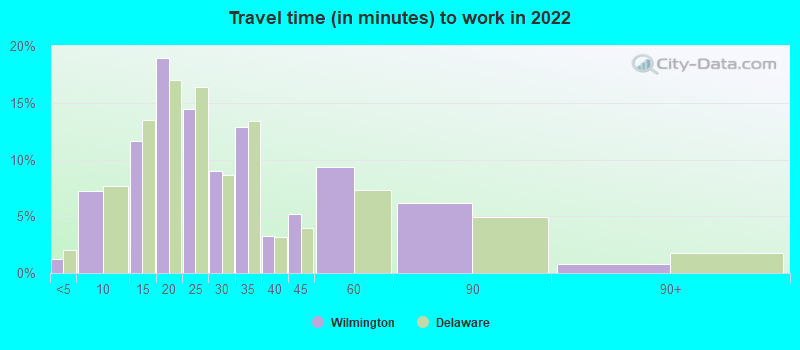
Travel time to work (commute)
Less than 5 minutes: 2855 to 9 minutes: 3,14110 to 14 minutes: 4,09815 to 19 minutes: 6,36420 to 24 minutes: 5,82225 to 29 minutes: 3,52730 to 34 minutes: 2,92635 to 39 minutes: 33940 to 44 minutes: 38145 to 59 minutes: 1,57160 to 89 minutes: 1,44790 or more minutes: 210
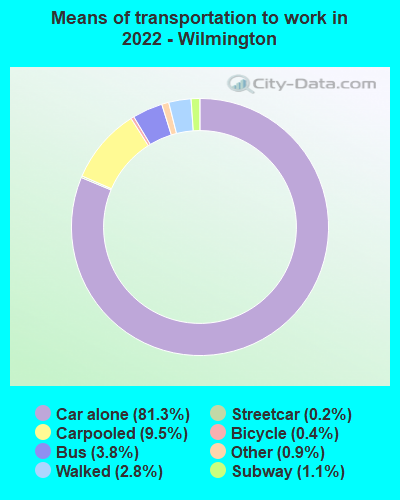
Means of transportation to work:
Drove a car alone: 40,788 (72.1%)Carpooled: 4,493 (7.9%)Bus : 1,790 (3.2%)Subway or elevated rail : 135 (0.2%)Long-distance train or commuter rail : 367 (0.6%)Light rail, streetcar or trolley : 45 (0.1%)Taxi: 427 (0.8%)Bicycle: 345 (0.6%)Walked: 1,465 (2.6%)Worked at home: 5,426 (9.6%)
Unemployment by race in 2022
Unemployment rate for White non-Hispanic residents 0.5% Males5.2% FemalesUnemployment rate for Black residents 7.2% Males2.1% FemalesUnemployment rate for Asian residents 1.5% Males1.4% FemalesUnemployment rate for two or more race residents 3.8% Males13.2% FemalesUnemployment rate for Hispanic or Latino residents 2.8% Males10.1% Females
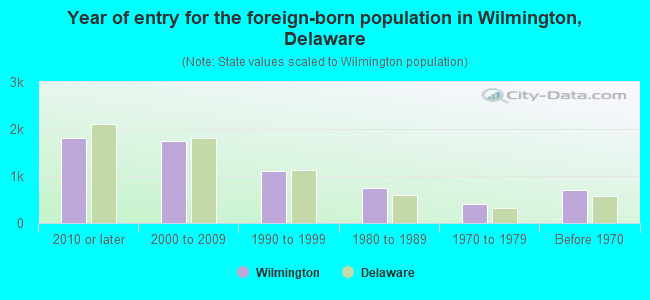
Year of entry for the foreign-born population in Wilmington, Delaware
1,813 2010 or later 1,750 2000 to 2009 1,117 1990 to 1999 740 1980 to 1989 405 1970 to 1979 705 Before 1970
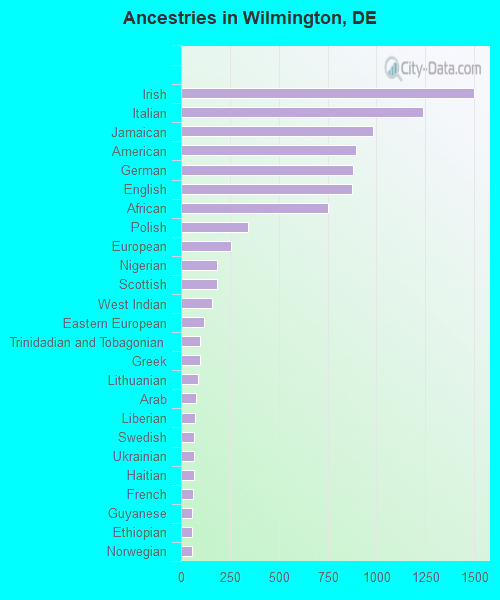
First ancestries reported:
Irish: 1,501 (4.3%)
Italian: 1,237 (3.5%)
Jamaican: 981 (2.8%)
American: 897 (2.6%)
German: 880 (2.5%)
English: 876 (2.5%)
African: 753 (2.2%)
Polish: 341 (1.0%)
European: 258 (0.7%)
Nigerian: 185 (0.5%)
Scottish: 185 (0.5%)
West Indian: 158 (0.5%)
Eastern European: 118 (0.3%)
Trinidadian and Tobagonian: 95 (0.3%)
Greek: 95 (0.3%)
Lithuanian: 87 (0.2%)
Arab: 75 (0.2%)
Liberian: 73 (0.2%)
Swedish: 69 (0.2%)
Ukrainian: 65 (0.2%)
Haitian: 65 (0.2%)
French: 63 (0.2%)
Guyanese: 58 (0.2%)
Ethiopian: 56 (0.2%)
Norwegian: 54 (0.2%)
Bermudan: 45 (0.1%)
Slovak: 29 (0.08%)
German Russian: 29 (0.08%)
Finnish: 26 (0.07%)
Czechoslovakian: 20 (0.06%)
Austrian: 20 (0.06%)
Ghanaian: 20 (0.06%)
Welsh: 20 (0.06%)
Turkish: 18 (0.05%)
Scotch-Irish: 18 (0.05%)
Israeli: 14 (0.04%)
British: 13 (0.04%)
Jordanian: 13 (0.04%)
Portuguese: 12 (0.03%)
Lebanese: 12 (0.03%)
Slavic: 11 (0.03%)
Czech: 11 (0.03%)
Sudanese: 10 (0.03%)
Armenian: 10 (0.03%)
Slovene: 9 (0.03%)
Swiss: 9 (0.03%)
British West Indian: 9 (0.03%)
Kenyan: 8 (0.02%)
Dutch: 7 (0.02%)
Iranian: 6 (0.02%)
Alsatian: 6 (0.02%)
Croatian: 5 (0.01%)
Canadian: 5 (0.01%)
Pennsylvania German: 5 (0.01%)
Romanian: 4 (0.01%)
Northern European: 4 (0.01%)
Serbian: 4 (0.01%)
Russian: 3 (0.01%)
Egyptian: 3 (0.01%)
Hungarian: 2 (0.01%)
Most common places of birth for foreign-born residents (%): Jamaica Wilmington:
21.1% (1,219)Delaware:
3.8% (3,727)
Mexico Wilmington:
13.3% (768)Delaware:
15.3% (14,887)
Dominican Republic Wilmington:
8.0% (460)Delaware:
3.1% (2,996)
Trinidad and Tobago Wilmington:
5.6% (322)Delaware:
1.4% (1,386)
India Wilmington:
4.6% (266)Delaware:
11.6% (11,288)
Yemen Wilmington:
4.1% (239)Delaware:
0.4% (420)
China, excluding Hong Kong and Taiwan Wilmington:
3.7% (214)Delaware:
5.7% (5,583)
Sierra Leone Wilmington:
3.2% (184)Delaware:
0.4% (399)
Guyana Wilmington:
3.0% (175)Delaware:
0.7% (659)
Colombia Wilmington:
2.9% (170)Delaware:
1.3% (1,286)
Nigeria Wilmington:
2.5% (143)Delaware:
3.0% (2,919)
Germany Wilmington:
2.4% (140)Delaware:
1.6% (1,552)
Peru Wilmington:
2.0% (116)Delaware:
0.6% (577)
Ecuador Wilmington:
1.9% (108)Delaware:
0.4% (417)
Other Western Africa Wilmington:
1.7% (96)Delaware:
0.3% (313)
Place of birth for U.S.-born residents:
This state: 32,585Other state: 30,752Northeast: 21,431Midwest: 1,589South: 6,757West: 975 84.7% of Wilmington residents lived in the same house 1 years ago.
Out of people who lived in different houses, 36.1% lived in this county.
Out of people who lived in different counties, 5.6% lived in Delaware.
Wilmington:
84.7%State average:
89.2%
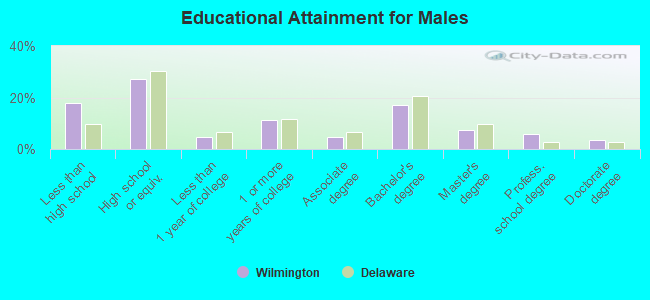
Education attainment for males 25 years and older:
No schooling: 363Nursery to 4th grade: 915th and 6th grade: 907th and 8th grade: 1279th grade: 22710th grade: 1,90511th grade: 39312th grade, no diploma: 781High school graduate (or equivalency): 6,091Less than 1 year of college: 1,042Some college more than 1 year, no degree: 2,548Associate degree: 1,017Bachelor's degree: 3,818Master's degree: 1,680Professional school degree: 1,305Doctorate degree: 783
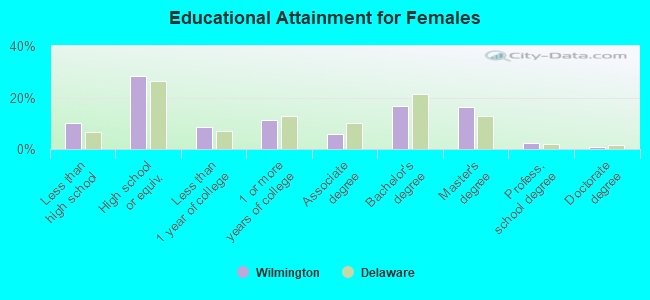
Education attainment for females 25 years and older:
No schooling: 427Nursery to 4th grade: 1685th and 6th grade: 497th and 8th grade: 09th grade: 24610th grade: 57711th grade: 70012th grade, no diploma: 651High school graduate (or equivalency): 7,981Less than 1 year of college: 2,418Some college more than 1 year, no degree: 3,140Associate degree: 1,645Bachelor's degree: 4,719Master's degree: 4,534Professional school degree: 676Doctorate degree: 199
Housing units in structures:
One, detached: 3,443One, attached: 21,034Two: 1,0233 or 4: 1,8745 to 9: 99210 to 19: 1,98220 to 49: 1,24450 or more: 5,005Boats, RVs, vans, etc.: 100Housing units lacking complete plumbing facilities in 2022: 2.3%Housing units lacking complete kitchen facilities in 2022: 3.4%House/condo owner moved in on average 12 years ago
Renter moved in on average 2 years ago
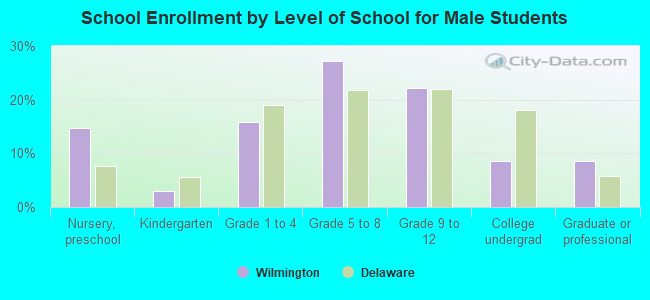
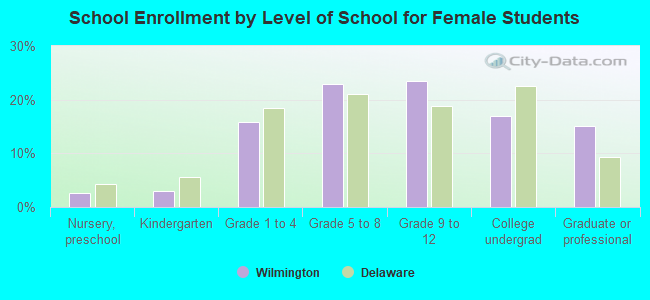
Private vs. public school enrollment:
Students in private schools in grades 1 to 8 (elementary and middle school): 347 Students in private schools in grades 9 to 12 (high school): 500 Students in private undergraduate colleges: 1,236