Wharton, NJ (New Jersey) Houses and Residents
| Wharton: | $333,634 |
| New Jersey: | $428,900 |
Mean price in 2022:
Detached houses: $402,395
Here: $402,395 State: $537,591 Townhouses or other attached units: $346,392
Here: $346,392 State: $381,113 In 5-or-more-unit structures: $368,424
Here: $368,424 State: $368,745
Total population: 6,612 (Urban population: 6,298, Rural population: 0)
Houses: 2,934 (2,799 occupied: 1,564 owner occupied, 1,280 renter occupied)
| % of renters here: | 45% |
| State: | 35% |
Housing density: 1,343 houses/condos per square mile
Median price asked for vacant for-sale houses and condos in 2022 in this county: $423,360.
Median contract rent in 2022: $1,545 (lower quartile is $1,239, upper quartile is $1,877)
Median rent asked for vacant for-rent units in 2022: $1,790
Median gross rent in Wharton, NJ in 2022: $1,765
Housing units in Wharton with a mortgage: 1,242 (151 second mortgage, 0 home equity loan, 150 both second mortgage and home equity loan)
Houses without a mortgage: 30
Median household income for houses/condos with a mortgage: $110,659
Median monthly housing costs: $1,973
Compare current foreclosures in Wharton, NJ:
| Photo | Address | Area | Beds / Baths | Price | Details |
|---|---|---|---|---|---|

|
#1
W Central Ave
Wharton, NJ 07885
|
1,340 sq. feet
|
3 baths 4 beds |
show details | |

|
#2
Westview
Wharton, NJ 07885
|
905 sq. feet
|
- baths - beds |
show details | |

|
#3
Richard Mine Rd Apt R11
Wharton, NJ 07885
|
941 sq. feet
|
- baths - beds |
show details | |

|
#4
W Shawnee Trl
Wharton, NJ 07885
|
- sq. feet
|
- baths - beds |
show details | |

|
#5
Bernard Ct
Wharton, NJ 07885
|
- sq. feet
|
- baths - beds |
show details | |

|
#6
W Central Ave
Wharton, NJ 07885
|
1,340 sq. feet
|
- baths - beds |
show details | |

|
#7
W Union Tpke Apt B1
Wharton, NJ 07885
|
- sq. feet
|
- baths - beds |
show details | |

|
#8
Stickle Ave
Wharton, NJ 07885
|
1,668 sq. feet
|
- baths - beds |
show details | |

|
#9
Cambridge Rd
Wharton, NJ 07885
|
- sq. feet
|
- baths - beds |
show details | |

|
#10
West View , Bld 19
Wharton, NJ 07885
|
905 sq. feet
|
- baths - beds |
show details |
| Photo | Address | Area | Beds / Baths | Price | Details |
|---|---|---|---|---|---|

|
#11
E Central Ave
Wharton, NJ 07885
|
929 sq. feet
|
- baths - beds |
show details | |

|
#12
Oxford Rd
Wharton, NJ 07885
|
- sq. feet
|
- baths - beds |
show details | |

|
#13
Richard Mine Rd Apt Q3
Wharton, NJ 07885
|
- sq. feet
|
- baths - beds |
show details | |

|
#14
Shawnee Pkwy
Wharton, NJ 07885
|
1,366 sq. feet
|
- baths - beds |
show details | |

|
#15
Columbia St
Wharton, NJ 07885
|
1,630 sq. feet
|
- baths - beds |
show details | |

|
#16
Julia Dr
Wharton, NJ 07885
|
- sq. feet
|
- baths - beds |
show details | |

|
#17
Richard Mine Rd
Wharton, NJ 07885
|
- sq. feet
|
- baths - beds |
show details | |

|
#18
Kossuth St
Wharton, NJ 07885
|
2,937 sq. feet
|
- baths - beds |
show details | |

|
#19
Oxford Rd
Wharton, NJ 07885
|
4,304 sq. feet
|
- baths - beds |
show details | |

|
#20
Ridge Rd
Wharton, NJ 07885
|
2,317 sq. feet
|
- baths - beds |
show details |
| Photo | Address | Area | Beds / Baths | Price | Details |
|---|---|---|---|---|---|

|
#21
Dove Dr
Wharton, NJ 07885
|
- sq. feet
|
- baths - beds |
show details | |

|
#22
N Main St
Wharton, NJ 07885
|
1,600 sq. feet
|
- baths - beds |
show details | |

|
#23
Julia Dr
Wharton, NJ 07885
|
- sq. feet
|
- baths - beds |
show details | |

|
#24
Pine St
Wharton, NJ 07885
|
2,235 sq. feet
|
- baths - beds |
show details | |

|
#25
Saint Bernards Rd
Wharton, NJ 07885
|
- sq. feet
|
- baths - beds |
show details | |

|
#26
Berkshire Valley Rd
Wharton, NJ 07885
|
2,212 sq. feet
|
- baths - beds |
show details | |

|
#27
Richard Mine Rd Apt R-11
Wharton, NJ 07885
|
- sq. feet
|
- baths - beds |
show details | |

|
#28
River Dr
Wharton, NJ 07885
|
- sq. feet
|
- baths - beds |
show details | |

|
#29
Downs Ave
Wharton, NJ 07885
|
1,611 sq. feet
|
- baths - beds |
show details | |

|
#30
Richard Mine Rd
Wharton, NJ 07885
|
744 sq. feet
|
- baths - beds |
show details |
| Photo | Address | Area | Beds / Baths | Price | Details |
|---|---|---|---|---|---|

|
#31
N Main St Apt 128
Wharton, NJ 07885
|
- sq. feet
|
- baths - beds |
show details | |

|
#32
E Shawnee Trl
Wharton, NJ 07885
|
1,118 sq. feet
|
- baths - beds |
show details | |

|
#33
Richard Mine Rd
Wharton, NJ 07885
|
744 sq. feet
|
- baths - beds |
show details | |

|
#34
Berkshire Valley Rd
Wharton, NJ 07885
|
696 sq. feet
|
- baths - beds |
show details | |

|
#35
And 8 Fern Ave
Wharton, NJ 07885
|
- sq. feet
|
- baths - beds |
show details | |

|
#36
Hillview Dr
Wharton, NJ 07885
|
2,406 sq. feet
|
- baths - beds |
show details | |

|
#37
Fern Ave
Wharton, NJ 07885
|
2,103 sq. feet
|
- baths - beds |
show details | |

|
#38
Langdon Ave
Wharton, NJ 07885
|
2,070 sq. feet
|
- baths - beds |
show details | |

|
#39
Julia Dr
Wharton, NJ 07885
|
- sq. feet
|
- baths - beds |
show details | |

|
#40
Echo Lake Dr
Wharton, NJ 07885
|
- sq. feet
|
- baths - beds |
show details |
| Photo | Address | Area | Beds / Baths | Price | Details |
|---|---|---|---|---|---|

|
Check over 1 million property listings on Foreclosure.com!
|
browse all offers | |||
| Photo | Address | Area | Beds / Baths | Price | Details |
|---|

Latest news about housing in Wharton, NJ collected exclusively by city-data.com from local newspapers, TV, and radio stations

 | Bergen County towns vs Holmdel (33 replies) |
| Best neighborhood within 30 min of Newark with a $1.2M budget (44 replies) |
| Suggestions for reasonably priced areas to live near Wharton, NJ.. (10 replies) |
| opinions on Colt's Neck (69 replies) |
| Recon - Potential move to NJ (21 replies) |
| Looking at houses in Jefferson Twp. (22 replies) |

Median year apartment built: 1976
Household type by relationship:
Households: 7,250- Male householders: 1,355 (477 living alone), Female householders: 1,436 (586 living alone)
1,191 spouses (1,191 opposite-sex spouses), 317 unmarried partners, (317 opposite-sex unmarried partners), 2,211 children (2,110 natural, 0 adopted, 100 stepchildren), 233 grandchildren, 139 brothers or sisters, 215 parents, 0 foster children, 79 other relatives, 63 non-relatives
- In group quarters: 7
Size of family households: 712 2-persons, 185 3-persons, 235 4-persons, 286 5-persons, 141 6-persons, 63 7-or-more-persons.
Size of nonfamily households: 1,028 1-person, 162 2-persons.
920 married couples with children.
432 single-parent households (87 men, 345 women).
48.6% of residents of Wharton speak English at home.
44.0% of residents speak Spanish at home (57% speak English very well, 24% speak English well, 10% speak English not well, 9% don't speak English at all).
0.8% of residents speak other Indo-European language at home (31% speak English very well, 69% speak English not well).
5.2% of residents speak Asian or Pacific Island language at home (100% speak English very well).
Foreign born population: 2,374 (32.7%)
(66.9% of them are naturalized citizens)
| Here: | 6.5 |
| State: | 6.8 |
| Here: | 3.8 |
| State: | 3.9 |

- Bedrooms in owner-occupied houses and condos in Wharton, New Jersey
- 0no bedroom
- 741 bedroom
- 3082 bedrooms
- 6543 bedrooms
- 5134 bedrooms
- 155+ bedrooms

- Bedrooms in renter-occupied apartments in Wharton, New Jersey
- 35no bedroom
- 5631 bedroom
- 5042 bedrooms
- 1163 bedrooms
- 634 bedrooms
- 05+ bedrooms

- Cars and other vehicles available in Wharton in owner-occupied houses/condos
- 20no vehicle
- 5561 vehicle
- 3892 vehicles
- 2803 vehicles
- 3194 vehicles
- 05+ vehicles

- Cars and other vehicles available in Wharton in renter-occupied apartments
- 87no vehicle
- 8051 vehicle
- 3352 vehicles
- 203 vehicles
- 344 vehicles
- 05+ vehicles

- Rooms in owner-occupied houses in Wharton, New Jersey
- 01 room
- 542 rooms
- 03 rooms
- 364 rooms
- 3445 rooms
- 2836 rooms
- 3137 rooms
- 3868 rooms
- 1489+ rooms

- Rooms in renter-occupied apartments in Wharton, New Jersey
- 351 room
- 502 rooms
- 3063 rooms
- 4604 rooms
- 2025 rooms
- 1456 rooms
- 447 rooms
- 398 rooms
- 09+ rooms


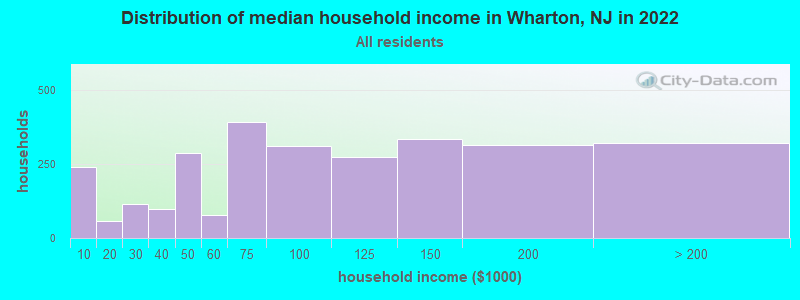
Wharton, NJ household income distribution

- 241Less than $10,000
- 58$10,000 to $19,999
- 114$20,000 to $29,999
- 99$30,000 to $39,999
- 288$40,000 to $49,999
- 78$50,000 to $59,999
- 393$60,000 to $74,999
- 312$75,000 to $99,999
- 274$100,000 to $124,999
- 334$125,000 to $149,999
- 314$150,000 to $199,999
- 323$200,000 or more
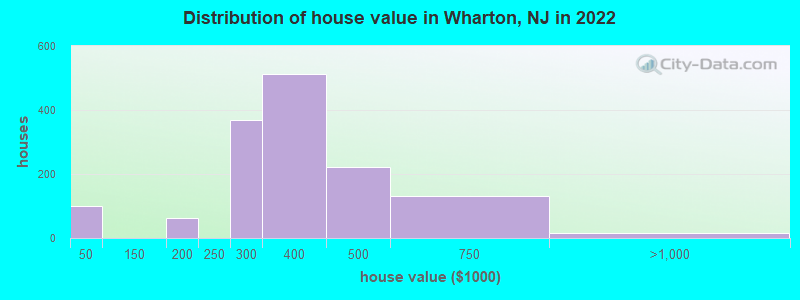
Home value of owner - occupied houses in 2022 in Wharton, NJ
-
- 62Less than $10,000
- 23$20,000 to $24,999
- 13$25,000 to $29,999
- 18$150,000 to $174,999
- 43$175,000 to $199,999
- 367$250,000 to $299,999
- 511$300,000 to $399,999
- 222$400,000 to $499,999
- 132$500,000 to $749,999
- 14$750,000 to $999,999
Rent paid by renters in 2022 in Wharton, NJ
-
- 20$250 to $299
- 28$750 to $799
- 107$800 to $899
- 124$1,000 to $1,249
- 248$1,250 to $1,499
- 405$1,500 to $1,999
- 136$2,000 to $2,499
- 74$2,500 to $2,999
- 41$3,000 to $3,499
- 31No cash rent


Percentage of workers working in this county: 63.1%
Number of people working at home: 312 (7.6% of all workers)
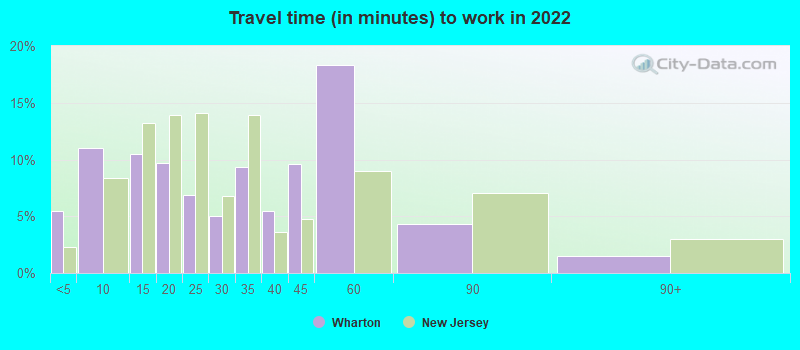
Travel time to work (commute)
- Less than 5 minutes: 167
- 5 to 9 minutes: 311
- 10 to 14 minutes: 621
- 15 to 19 minutes: 405
- 20 to 24 minutes: 375
- 25 to 29 minutes: 53
- 30 to 34 minutes: 421
- 35 to 39 minutes: 363
- 40 to 44 minutes: 224
- 45 to 59 minutes: 259
- 60 to 89 minutes: 96
- 90 or more minutes: 268
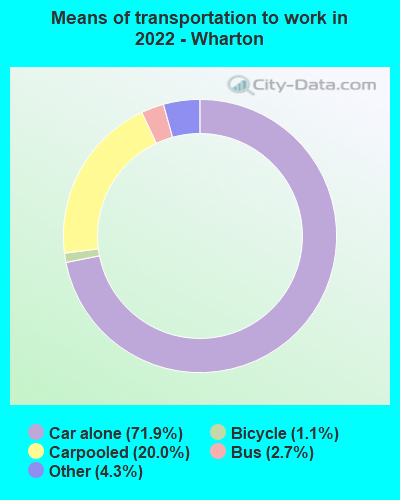
Means of transportation to work:
- Drove a car alone: 1,429 (59.9%)
- Carpooled: 403 (16.9%)
- Bus: 54 (2.3%)
- Taxi: 109 (4.6%)
- Bicycle: 16 (0.7%)
- Walked: 1 (0.0%)
- Worked at home: 312 (13.1%)

- Unemployment by race in 2022
- Unemployment rate for White non-Hispanic residents
- 7.2%Males
- Unemployment rate for other race residents
- 5.5%Males
- 12.8%Females
- Unemployment rate for Hispanic or Latino residents
- 2.8%Males
- 3.8%Females

- Year of entry for the foreign-born population in Wharton, New Jersey
- 5502010 or later
- 6512000 to 2009
- 8141990 to 1999
- 2621980 to 1989
- 1231970 to 1979
- 160Before 1970

First ancestries reported:
- Italian: 265 (7.4%)
- Irish: 168 (4.7%)
- German: 120 (3.3%)
- American: 101 (2.8%)
- Polish: 89 (2.5%)
- Guyanese: 47 (1.3%)
- English: 33 (0.9%)
- French Canadian: 11 (0.3%)
Most common places of birth for foreign-born residents (%):
| Wharton: | 40.0% (984) |
| New Jersey: | 4.2% (90,817) |
| Wharton: | 13.2% (324) |
| New Jersey: | 9.7% (209,055) |
| Wharton: | 6.9% (171) |
| New Jersey: | 4.0% (85,934) |
| Wharton: | 6.9% (171) |
| New Jersey: | 0.3% (6,972) |
| Wharton: | 6.7% (165) |
| New Jersey: | 4.4% (95,275) |
| Wharton: | 5.5% (135) |
| New Jersey: | 2.7% (58,563) |
| Wharton: | 4.6% (114) |
| New Jersey: | 0.6% (12,929) |
| Wharton: | 4.0% (98) |
| New Jersey: | 0.7% (14,405) |
| Wharton: | 3.8% (93) |
| New Jersey: | 0.7% (15,644) |
| Wharton: | 3.3% (81) |
| New Jersey: | 0.3% (7,153) |
| Wharton: | 2.0% (50) |
| New Jersey: | 1.2% (26,173) |
| Wharton: | 1.6% (39) |
| New Jersey: | 2.3% (48,811) |
Place of birth for U.S.-born residents:
- This state: 3,856
- Other state: 879
- Northeast: 619
- Midwest: 123
- South: 133
- West: 0
90.1% of Wharton residents lived in the same house 1 years ago.
Out of people who lived in different houses, 42.5% lived in this county.
Out of people who lived in different counties, 100.0% lived in New Jersey.
| Wharton: | 90.1% |
| State average: | 90.4% |
Education attainment for males 25 years and older:
- No schooling: 54
- Nursery to 4th grade: 0
- 5th and 6th grade: 0
- 7th and 8th grade: 47
- 9th grade: 0
- 10th grade: 17
- 11th grade: 27
- 12th grade, no diploma: 26
- High school graduate (or equivalency): 1,057
- Less than 1 year of college: 197
- Some college more than 1 year, no degree: 377
- Associate degree: 92
- Bachelor's degree: 454
- Master's degree: 187
- Professional school degree: 15
- Doctorate degree: 28

Education attainment for females 25 years and older:
- No schooling: 60
- Nursery to 4th grade: 0
- 5th and 6th grade: 0
- 7th and 8th grade: 47
- 9th grade: 0
- 10th grade: 11
- 11th grade: 0
- 12th grade, no diploma: 56
- High school graduate (or equivalency): 835
- Less than 1 year of college: 215
- Some college more than 1 year, no degree: 258
- Associate degree: 201
- Bachelor's degree: 547
- Master's degree: 186
- Professional school degree: 0
- Doctorate degree: 41


Housing units in structures:
- One, detached: 1,369
- One, attached: 465
- Two: 241
- 3 or 4: 162
- 5 to 9: 238
- 10 to 19: 101
- 20 to 49: 17
- 50 or more: 337
House/condo owner moved in on average 13 years ago
Renter moved in on average 6 years ago

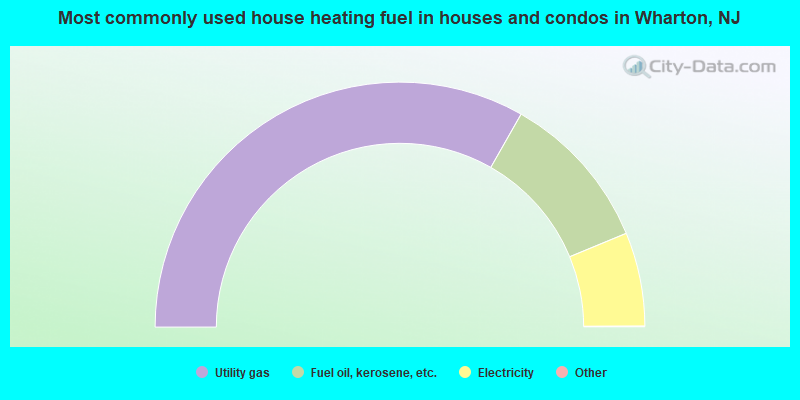
- 66.6%Utility gas
- 21.1%Fuel oil, kerosene, etc.
- 12.4%Electricity
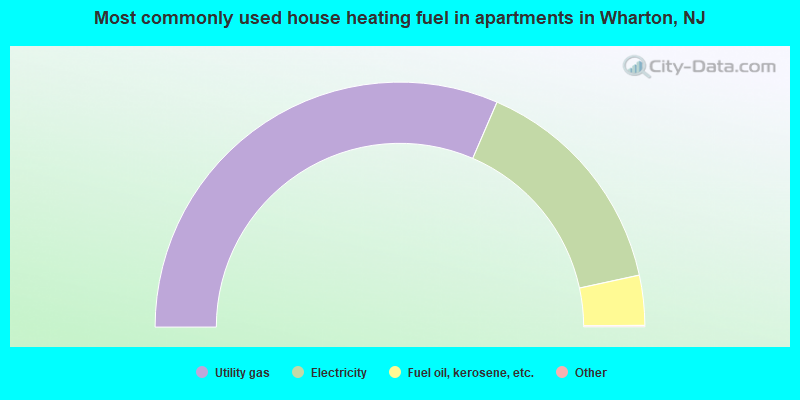
- 63.1%Utility gas
- 30.3%Electricity
- 6.6%Fuel oil, kerosene, etc.
Private vs. public school enrollment:
| Here: | 0.0% |
| New Jersey: | 12.3% |
| Here: | 0.0% |
| New Jersey: | 13.1% |
| Here: | 16.2% |
| New Jersey: | 33.2% |


