West Little River, FL (Florida) Houses and Residents
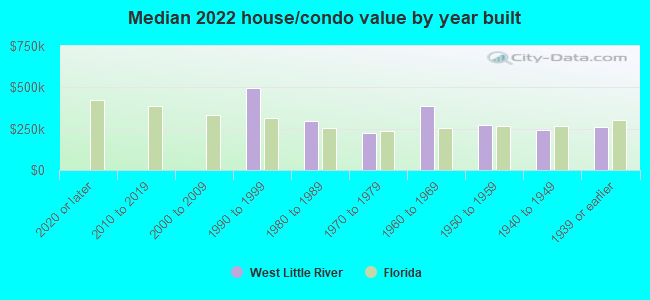
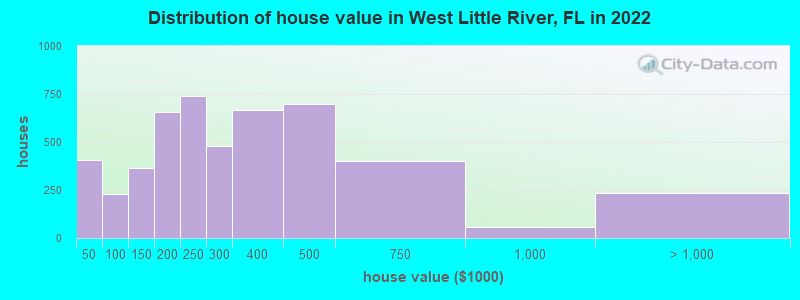
Estimated median house or condo value in 2022: $275,260 (it was $76,500 in 2000 )
West Little River:
$275,260Florida:
$354,100
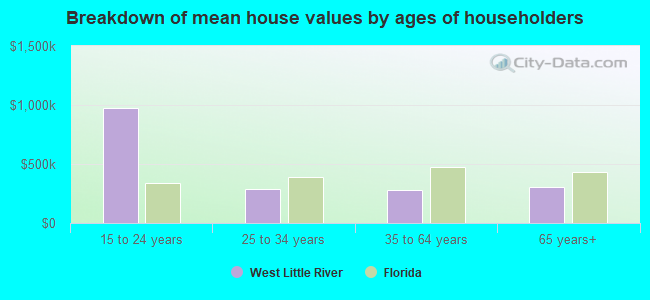
Lower value quartile - upper value quartile: $208,359 - $423,901Mean price in 2022: Detached houses: $278,134 Here:
$278,134State:
$500,941
Townhouses or other attached units: $270,244 Here:
$270,244State:
$370,869
In 2-unit structures: $224,204 Here:
$224,204State:
$423,188
In 3-to-4-unit structures: $201,401 Here:
$201,401State:
$309,944
In 5-or-more-unit structures: $225,963 Here:
$225,963State:
$447,145
Mobile homes: $19,884 Here:
$19,884State:
$113,202
Total population: 34,699 (Urban population: 32,287, Rural population: 0)
Houses: 11,219 (10,541 occupied: 6,229 owner occupied, 4,452 renter occupied )
% of renters here:
42%State:
33%
Housing density: 2,449 houses/condos per square mile
Median price asked for vacant for-sale houses and condos in 2022: $608,529.
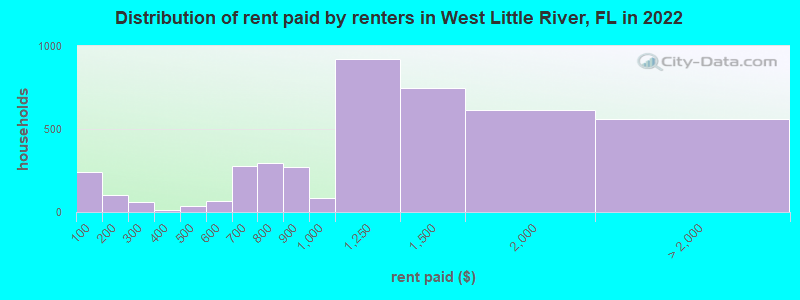
Median contract rent in 2022: $1,210 (lower quartile is $769, upper quartile is $1,533)
Median rent asked for vacant for-rent units in 2022: $1,875
Median gross rent in West Little River, FL in 2022: $1,357
Housing units in West Little River with a mortgage: 3,026 (197 second mortgage, 0 home equity loan, 81 both second mortgage and home equity loan )Houses without a mortgage: 0
Median household income for houses/condos with a mortgage: $64,657
Median household income for apartments without a mortgage: $59,808
Median monthly housing costs: $1,162
Data:
Median house or condo value ($)
Median house or condo value ($ change since 2000)
Median house or condo value ($) - White
Median house or condo value ($) - Black or African American
Median house or condo value ($) - Asian
Median house or condo value ($) - Hispanic or Latino
Median house or condo value ($) - American Indian and Alaska Native
Median house or condo value ($) - Multirace
Median house or condo value ($) - Other Race
Median price asked for mobile homes ($)
Household density (households per square mile)
Mean house or condo value by units in structure - 1, detached ($)
Mean house or condo value by units in structure - 1, attached ($)
Mean house or condo value by units in structure - 2 ($)
Mean house or condo value by units in structure by units in structure - 3 or 4 ($)
Mean house or condo value by units in structure - 5 or more ($)
Mean house or condo value by units in structure - Boat, RV, van, etc. ($)
Mean house or condo value by units in structure - Mobile home ($)
Median contract rent ($)
Median contract rent - Lower quartile ($)
Median contract rent - Upper quartile ($)
Median gross rent ($)
Urban houses (%)
Rural houses (%)
Houses occupied (%)
Houses occupied (% change since 2000)
Houses owner occupied (%)
Houses owner occupied (% change since 2000)
Houses renter occupied (%)
Houses renter occupied (% change since 2000)
Vacant housing units - For rent (%)
Vacant housing units - For rent (% change since 2000)
Vacant housing units - For sale only (%)
Vacant housing units - For sale only (% change since 2000)
Vacant housing units - Rented or sold, not occupied (%)
Vacant housing units - Rented or sold, not occupied (% change since 2000)
Vacant housing units - For seasonal, recreational, or occasional use (%)
Vacant housing units - For seasonal, recreational, or occasional use (% change since 2000)
Vacant housing units - For migrant workers (%)
Vacant housing units - For migrant workers (% change since 2000)
Vacant housing units - Other vacant (%)
Vacant housing units - Other vacant (% change since 2000)
Median monthly housing costs ($)
Median household income for houses/condos with a mortgage ($)
Median household income for houses/condos without a mortgage ($)
Median household income ($)
Median household income ($) - White
Median household income ($) - Black or African American
Median household income ($) - Asian
Median household income ($) - Hispanic or Latino
Median household income ($) - American Indian and Alaska Native
Median household income ($) - Multirace
Median household income ($) - Other Race
Mortgage status - with mortgage (%)
Mortgage status - with second mortgage (%)
Mortgage status - with home equity loan (%)
Mortgage status - with both second mortgage and home equity loan (%)
Mortgage status - without a mortgage (%)
Median year house/condo built
Median year apartment built
Household type by relationship - Male householder living alone (%)
Household type by relationship - Male householder not living alone (%)
Household type by relationship - Female householder living alone (%)
Household type by relationship - Female householder not living alone (%)
Household type by relationship - Opposite-Sex spouse (%)
Household type by relationship - Same-Sex spouse (%)
Household type by relationship - Opposite-Sex unmarried partner (%)
Household type by relationship - Same-Sex unmarried partner (%)
Household type by relationship - In group quarters (%)
Size of family households - 2-person household (%)
Size of family households - 3-person household (%)
Size of family households - 4-person household (%)
Size of family households - 5-person household (%)
Size of family households - 6-person household (%)
Size of family households - 7-or-more-person household (%)
Size of nonfamily households - 1-person household (%)
Size of nonfamily households - 2-person household (%)
Size of nonfamily households - 3-person household (%)
Size of nonfamily households - 4-person household (%)
Size of nonfamily households - 5-person household (%)
Size of nonfamily households - 6-person household (%)
Size of nonfamily households - 7-or-moreperson household (%)
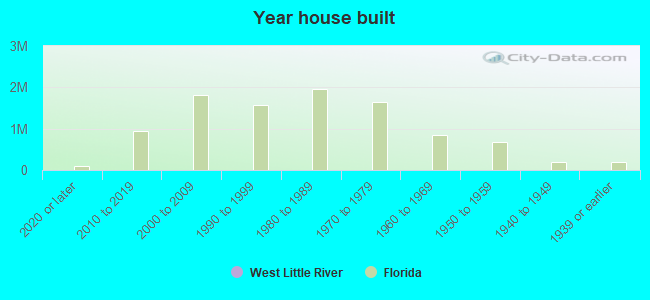
Year house built - Built 2010 or later (%)
Year house built - Built 2000 to 2009 (%)
Year house built - Built 1990 to 1999 (%)
Year house built - Built 1980 to 1989 (%)
Year house built - Built 1970 to 1979 (%)
Year house built - Built 1960 to 1969 (%)
Year house built - Built 1950 to 1959 (%)
Year house built - Built 1940 to 1949 (%)
Year house built - Built 1939 or earlier (%)
Median number of rooms in houses and condos
Median number of rooms in apartments
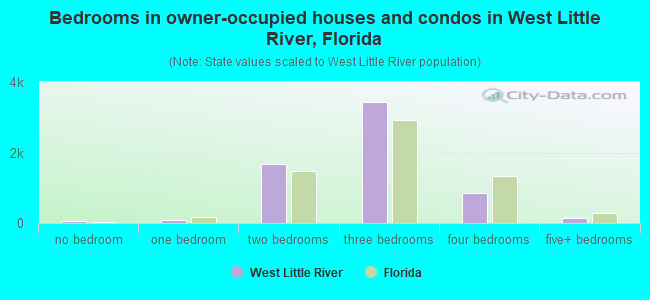
Median number of bedrooms in owner occupied houses
Mean number of bedrooms in owner occupied houses
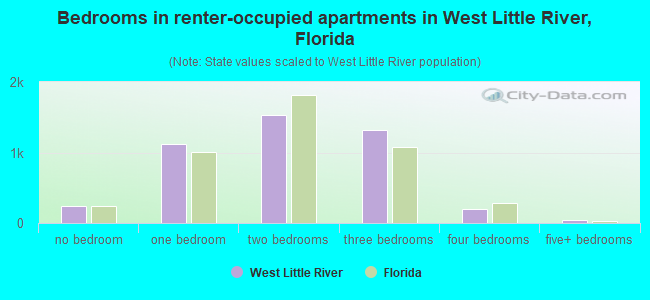
Median number of bedrooms in renter occupied houses
Mean number of bedrooms in renter occupied houses
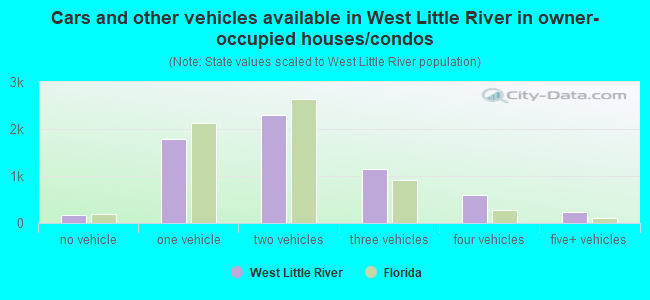
Median number of vehichles in owner occupied houses
Mean number of vehichles in owner occupied houses
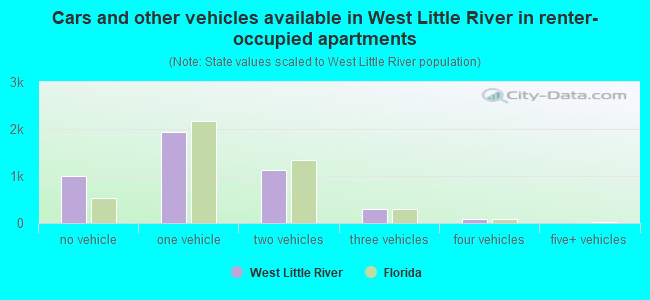
Median number of vehichles in renter occupied houses
Mean number of vehichles in renter occupied houses
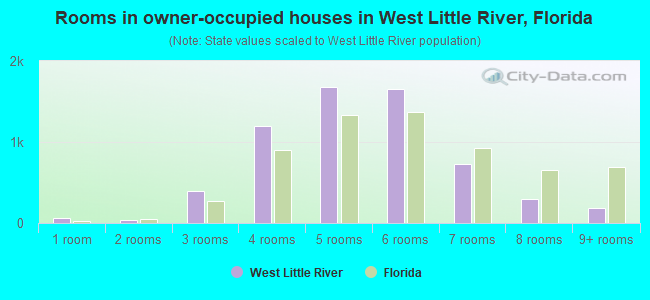
Rooms in owner-occupied houses - 1 room (%)
Rooms in owner-occupied houses - 2 rooms (%)
Rooms in owner-occupied houses - 3 rooms (%)
Rooms in owner-occupied houses - 4 rooms (%)
Rooms in owner-occupied houses - 5 rooms (%)
Rooms in owner-occupied houses - 6 rooms (%)
Rooms in owner-occupied houses - 7 rooms (%)
Rooms in owner-occupied houses - 8 rooms (%)
Rooms in owner-occupied houses - 9+ rooms (%)
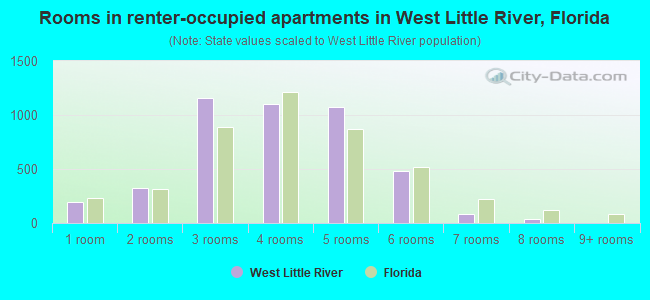
Rooms in renter-occupied houses - 1 room (%)
Rooms in renter-occupied houses - 2 rooms (%)
Rooms in renter-occupied houses - 3 rooms (%)
Rooms in renter-occupied houses - 4 rooms (%)
Rooms in renter-occupied houses - 5 rooms (%)
Rooms in renter-occupied houses - 6 rooms (%)
Rooms in renter-occupied houses - 7 rooms (%)
Rooms in renter-occupied houses - 8 rooms (%)
Rooms in renter-occupied houses - 9+ rooms (%)
Bedrooms in owner-occupied houses - no bedrooms (%)
Bedrooms in owner-occupied houses - 1 bedroom (%)
Bedrooms in owner-occupied houses - 2 bedrooms (%)
Bedrooms in owner-occupied houses - 3 bedrooms (%)
Bedrooms in owner-occupied houses - 4 bedrooms (%)
Bedrooms in owner-occupied houses - 5+ bedrooms (%)
Bedrooms in renter-occupied houses - no bedrooms (%)
Bedrooms in renter-occupied houses - 1 bedroom (%)
Bedrooms in renter-occupied houses - 2 bedrooms (%)
Bedrooms in renter-occupied houses - 3 bedrooms (%)
Bedrooms in renter-occupied houses - 4 bedrooms (%)
Bedrooms in renter-occupied houses - 5+ bedrooms (%)
Vehicles available in owner-occupied houses - no vehicle available (%)
Vehicles available in owner-occupied houses - 1 vehicle available(%)
Vehicles available in owner-occupied houses - 2 Vehicles available (%)
Vehicles available in owner-occupied houses - 3 Vehicles available (%)
Vehicles available in owner-occupied houses - 4 Vehicles available (%)
Vehicles available in owner-occupied houses - 5+ Vehicles available (%)
Vehicles available in renter-occupied houses - no vehicle available (%)
Vehicles available in renter-occupied houses - 1 vehicle available (%)
Vehicles available in renter-occupied houses - 2 Vehicles available (%)
Vehicles available in renter-occupied houses - 3 Vehicles available (%)
Vehicles available in renter-occupied houses - 4 Vehicles available (%)
Vehicles available in renter-occupied houses - 5+ Vehicles available (%)
Housing units in structures - 1, detached (%)
Housing units in structures - 1, attached (%)
Housing units in structures - 2 (%)
Housing units in structures - 3 or 4 (%)
Housing units in structures - 5 to 9 (%)
Housing units in structures - 10 to 19 (%)
Housing units in structures - 20 to 49 (%)
Housing units in structures - 50 or more (%)
Housing units in structures - Mobile home (%)
Housing units in structures - Boat, RV, van, etc. (%)
Housing units in structures - Owners - 1, detached (%)
Housing units in structures - Owners - 1, attached (%)
Housing units in structures - Owners - 2 (%)
Housing units in structures - Owners - 3 or 4 (%)
Housing units in structures - Owners - 5 to 9 (%)
Housing units in structures - Owners - 10 to 19 (%)
Housing units in structures - Owners - 20 to 49 (%)
Housing units in structures - Owners - 50 or more (%)
Housing units in structures - Owners - Mobile home (%)
Housing units in structures - Owners - Boat, RV, van, etc. (%)
Housing units in structures - Renters - 1, detached (%)
Housing units in structures - Renters - 1, attached (%)
Housing units in structures - Renters - 2 (%)
Housing units in structures - Renters - 3 or 4 (%)
Housing units in structures - Renters - 5 to 9 (%)
Housing units in structures - Renters - 10 to 19 (%)
Housing units in structures - Renters - 20 to 49 (%)
Housing units in structures - Renters - 50 or more (%)
Housing units in structures - Renters - Mobile home (%)
Housing units in structures - Renters - Boat, RV, van, etc. (%)
House/condo owner moved in on average (years ago)
Renter moved in on average (years ago)
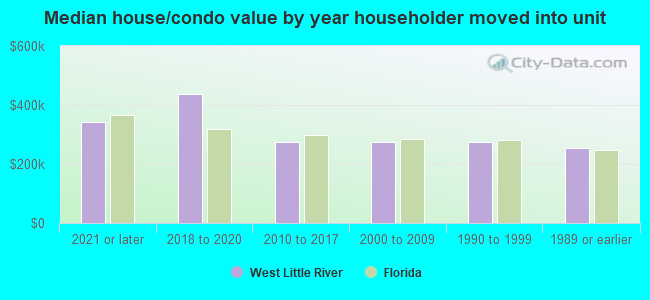
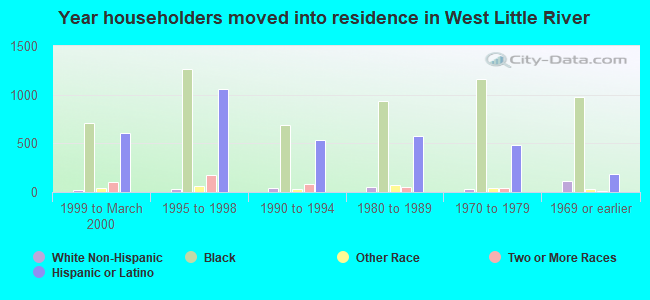
Year householder moved into unit - Moved in 1999 to March 2000 (%)
Year householder moved into unit - Moved in 1999 to March 2000 (%) - White
Year householder moved into unit - Moved in 1999 to March 2000 (%) - Black or African American
Year householder moved into unit - Moved in 1999 to March 2000 (%) - Asian
Year householder moved into unit - Moved in 1999 to March 2000 (%) - Hispanic or Latino
Year householder moved into unit - Moved in 1999 to March 2000 (%) - American Indian and Alaska Native
Year householder moved into unit - Moved in 1999 to March 2000 (%) - Multirace
Year householder moved into unit - Moved in 1999 to March 2000 (%) - Other Race
Year householder moved into unit - Moved in 1995 to 1998 (%)
Year householder moved into unit - Moved in 1995 to 1998 (%) - White
Year householder moved into unit - Moved in 1995 to 1998 (%) - Black or African American
Year householder moved into unit - Moved in 1995 to 1998 (%) - Asian
Year householder moved into unit - Moved in 1995 to 1998 (%) - Hispanic or Latino
Year householder moved into unit - Moved in 1995 to 1998 (%) - American Indian and Alaska Native
Year householder moved into unit - Moved in 1995 to 1998 (%) - Multirace
Year householder moved into unit - Moved in 1995 to 1998 (%) - Other Race
Year householder moved into unit - Moved in 1990 to 1994 (%)
Year householder moved into unit - Moved in 1990 to 1994 (%) - White
Year householder moved into unit - Moved in 1990 to 1994 (%) - Black or African American
Year householder moved into unit - Moved in 1990 to 1994 (%) - Asian
Year householder moved into unit - Moved in 1990 to 1994 (%) - Hispanic or Latino
Year householder moved into unit - Moved in 1990 to 1994 (%) - American Indian and Alaska Native
Year householder moved into unit - Moved in 1990 to 1994 (%) - Multirace
Year householder moved into unit - Moved in 1990 to 1994 (%) - Other Race
Year householder moved into unit - Moved in 1980 to 1989 (%)
Year householder moved into unit - Moved in 1980 to 1989 (%) - White
Year householder moved into unit - Moved in 1980 to 1989 (%) - Black or African American
Year householder moved into unit - Moved in 1980 to 1989 (%) - Asian
Year householder moved into unit - Moved in 1980 to 1989 (%) - Hispanic or Latino
Year householder moved into unit - Moved in 1980 to 1989 (%) - American Indian and Alaska Native
Year householder moved into unit - Moved in 1980 to 1989 (%) - Multirace
Year householder moved into unit - Moved in 1980 to 1989 (%) - Other Race
Year householder moved into unit - Moved in 1970 to 1979 (%)
Year householder moved into unit - Moved in 1970 to 1979 (%) - White
Year householder moved into unit - Moved in 1970 to 1979 (%) - Black or African American
Year householder moved into unit - Moved in 1970 to 1979 (%) - Asian
Year householder moved into unit - Moved in 1970 to 1979 (%) - Hispanic or Latino
Year householder moved into unit - Moved in 1970 to 1979 (%) - American Indian and Alaska Native
Year householder moved into unit - Moved in 1970 to 1979 (%) - Multirace
Year householder moved into unit - Moved in 1970 to 1979 (%) - Other Race
Year householder moved into unit - Moved in 1969 or earlier (%)
Year householder moved into unit - Moved in 1969 or earlier (%) - White
Year householder moved into unit - Moved in 1969 or earlier (%) - Black or African American
Year householder moved into unit - Moved in 1969 or earlier (%) - Asian
Year householder moved into unit - Moved in 1969 or earlier (%) - Hispanic or Latino
Year householder moved into unit - Moved in 1969 or earlier (%) - American Indian and Alaska Native
Year householder moved into unit - Moved in 1969 or earlier (%) - Multirace
Year householder moved into unit - Moved in 1969 or earlier (%) - Other Race
Housing units lacking complete plumbing facilities (%)
Housing units lacking complete kitchen facilities (%)
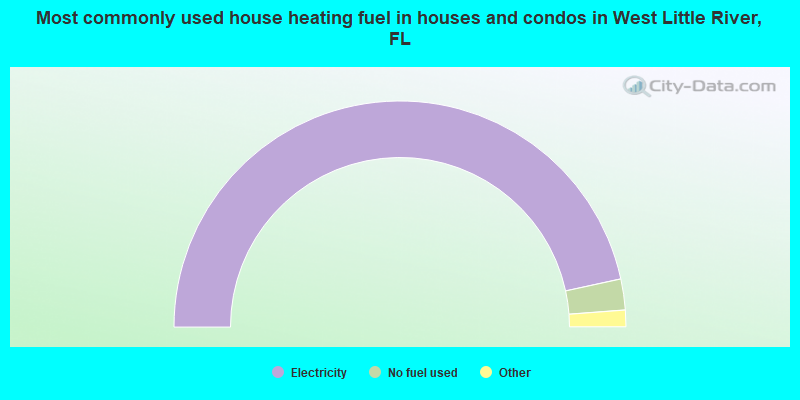
House heating fuel used in houses and condos - Utility gas (%)
House heating fuel used in houses and condos - Bottled, tank, or LP gas (%)
House heating fuel used in houses and condos - Electricity (%)
House heating fuel used in houses and condos - Fuel oil, kerosene, etc. (%)
House heating fuel used in houses and condos - Coal or coke (%)
House heating fuel used in houses and condos - Wood (%)
House heating fuel used in houses and condos - Solar energy (%)
House heating fuel used in houses and condos - Other fuel (%)
House heating fuel used in houses and condos - No fuel used (%)
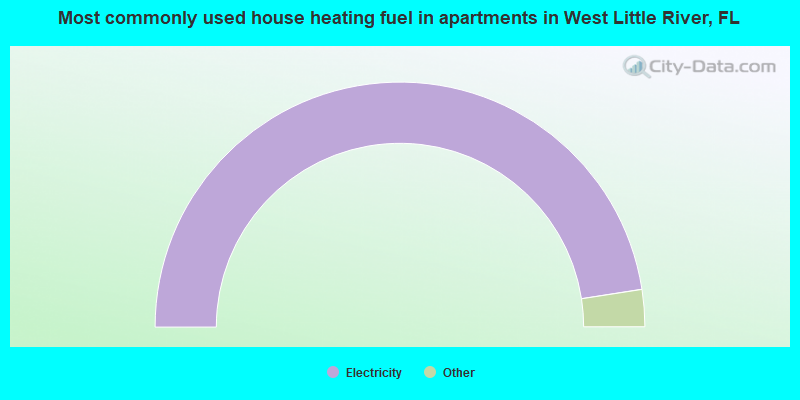
House heating fuel used in apartments - Utility gas (%)
House heating fuel used in apartments - Bottled, tank, or LP gas (%)
House heating fuel used in apartments - Electricity (%)
House heating fuel used in apartments - Fuel oil, kerosene, etc. (%)
House heating fuel used in apartments - Coal or coke (%)
House heating fuel used in apartments - Wood (%)
House heating fuel used in apartments - Solar energy (%)
House heating fuel used in apartments - Other fuel (%)
House heating fuel used in apartments - No fuel used (%)
Median year house/condo built: 1956Median year apartment built: 1967Household type by relationship:
Households: 33,285
Male householders: 4,587 (1,031 living alone ), Female householders: 5,704 (1,327 living alone )3,417 spouses (3,356 opposite-sex spouses ), 682 unmarried partners , (626 opposite-sex unmarried partners ), 10,632 children (10,112 natural , 82 adopted , 437 stepchildren ), 2,424 grandchildren , 1,134 brothers or sisters , 1,478 parents , 25 foster children , 2,076 other relatives , 961 non-relatives In group quarters: 159
Size of family households: 2,486 2-persons , 1,744 3-persons , 1,920 4-persons , 859 5-persons , 402 6-persons , 359 7-or-more-persons .
Size of nonfamily households: 2,528 1-person , 290 2-persons , 51 3-persons , 9 5-persons .
1,789 married couples with children. single-parent households (982 men , 2,092 women ).
40.3% of residents of West Little River speak English at home. of residents speak Spanish at home (49% speak English very well , 13% speak English well , 18% speak English not well , 20% don't speak English at all ).of residents speak other Indo-European language at home (62% speak English very well , 17% speak English well , 15% speak English not well , 6% don't speak English at all ).of residents speak other language at home (100% speak English very well ).
Foreign born population: 14,498 (43.6%)of them are naturalized citizens )
Median number of rooms in houses and condos:
Median number of rooms in apartments
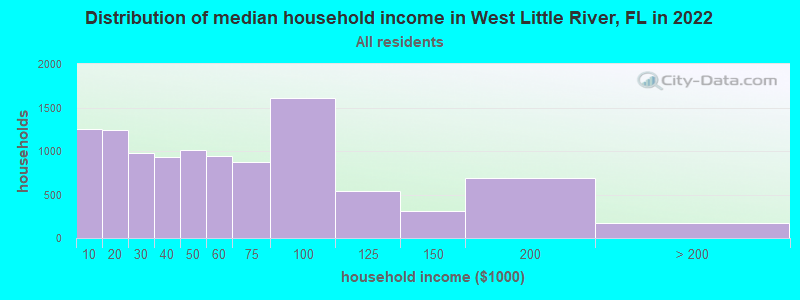
West Little River, FL household income distribution 1,256 Less than $10,0001,239 $10,000 to $19,999976 $20,000 to $29,999931 $30,000 to $39,9991,008 $40,000 to $49,999940 $50,000 to $59,999874 $60,000 to $74,9991,604 $75,000 to $99,999542 $100,000 to $124,999314 $125,000 to $149,999687 $150,000 to $199,999172 $200,000 or more
Home value of owner - occupied houses in 2022 in West Little River, FL 60 Less than $10,00035 $10,000 to $14,99933 $15,000 to $19,99958 $20,000 to $24,99938 $25,000 to $29,99912 $30,000 to $34,99986 $35,000 to $39,99978 $40,000 to $49,99939 $50,000 to $59,99996 $80,000 to $89,99913 $90,000 to $99,999159 $100,000 to $124,999202 $125,000 to $149,999246 $150,000 to $174,999410 $175,000 to $199,999740 $200,000 to $249,999481 $250,000 to $299,999668 $300,000 to $399,999697 $400,000 to $499,999399 $500,000 to $749,99959 $750,000 to $999,999235 $1,000,000 to $1,499,999Rent paid by renters in 2022 in West Little River, FL 240 Less than $10041 $100 to $14961 $150 to $19944 $200 to $24918 $250 to $29914 $300 to $34933 $400 to $4497 $500 to $54960 $550 to $599192 $600 to $64984 $650 to $699249 $700 to $74942 $750 to $799269 $800 to $89983 $900 to $999920 $1,000 to $1,249750 $1,250 to $1,499615 $1,500 to $1,999263 $2,000 to $2,49961 $2,500 to $2,99969 $3,000 to $3,49951 $3,500 or more112 No cash rent
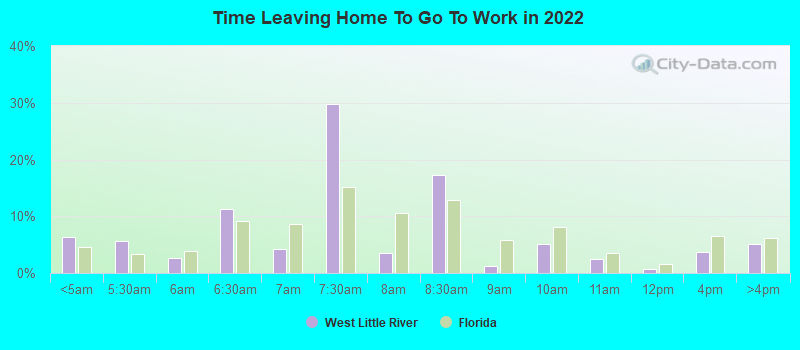
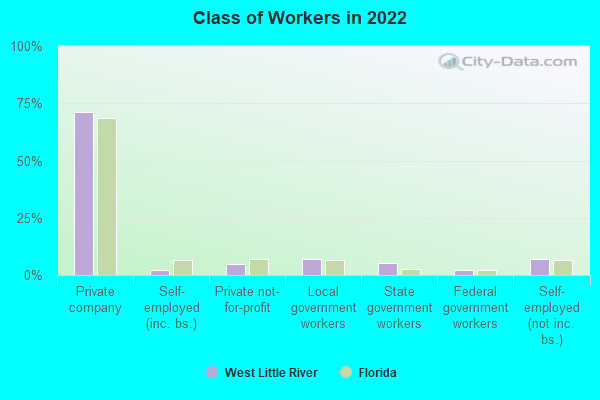
Percentage of workers working in this county: 91.5%Number of people working at home: 1,203 (8.7% of all workers )
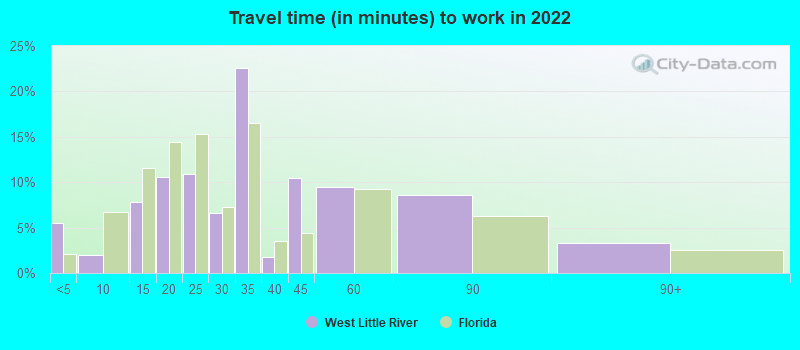
Travel time to work (commute)
Less than 5 minutes: 1925 to 9 minutes: 11510 to 14 minutes: 94615 to 19 minutes: 1,00820 to 24 minutes: 2,17325 to 29 minutes: 78830 to 34 minutes: 2,76835 to 39 minutes: 74440 to 44 minutes: 70645 to 59 minutes: 1,21860 to 89 minutes: 1,20090 or more minutes: 294
Means of transportation to work:
Drove a car alone: 2,757 (61.4%)Carpooled: 426 (9.5%)Bus : 123 (2.7%)Taxi: 166 (3.7%)Worked at home: 1,203 (26.8%)
Unemployment by race in 2022
Unemployment rate for White non-Hispanic residents 0.4% Males11.9% FemalesUnemployment rate for Black residents 9.5% Males7.5% FemalesUnemployment rate for other race residents 7.0% MalesUnemployment rate for two or more race residents 0.3% Males1.5% FemalesUnemployment rate for Hispanic or Latino residents 2.9% Males1.3% Females
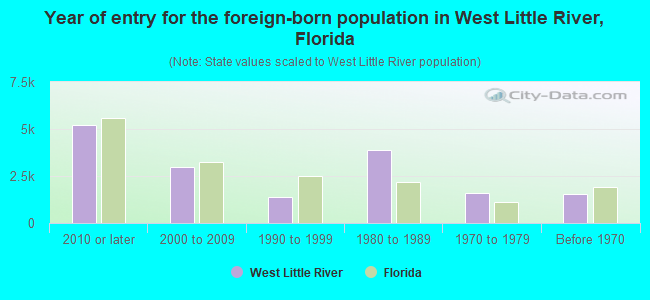
Year of entry for the foreign-born population in West Little River, Florida
5,199 2010 or later 2,988 2000 to 2009 1,361 1990 to 1999 3,875 1980 to 1989 1,581 1970 to 1979 1,557 Before 1970
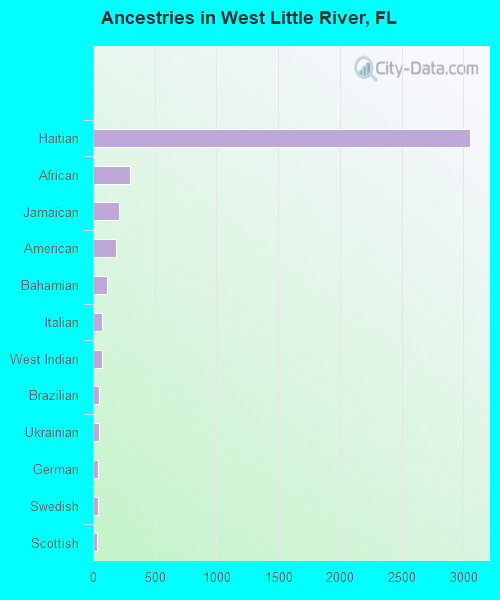
First ancestries reported:
Haitian: 3,054 (12.1%)
African: 301 (1.2%)
Jamaican: 211 (0.8%)
American: 189 (0.7%)
Bahamian: 111 (0.4%)
Italian: 75 (0.3%)
West Indian: 71 (0.3%)
Brazilian: 51 (0.2%)
Ukrainian: 51 (0.2%)
German: 41 (0.2%)
Swedish: 39 (0.2%)
Scottish: 30 (0.1%)
Trinidadian and Tobagonian: 24 (0.09%)
English: 22 (0.09%)
British West Indian: 16 (0.06%)
French: 12 (0.05%)
Iranian: 10 (0.04%)
Belizean: 5 (0.02%) Most common places of birth for foreign-born residents (%): Cuba West Little River:
42.5% (6,158)Florida:
22.0% (1,006,576)
Haiti West Little River:
14.1% (2,038)Florida:
7.5% (342,375)
Nicaragua West Little River:
11.0% (1,589)Florida:
2.3% (105,066)
Honduras West Little River:
8.0% (1,162)Florida:
2.3% (107,160)
Venezuela West Little River:
4.7% (679)Florida:
5.7% (262,042)
El Salvador West Little River:
3.9% (569)Florida:
1.1% (49,838)
Dominican Republic West Little River:
3.6% (523)Florida:
3.0% (137,727)
Colombia West Little River:
3.4% (495)Florida:
6.5% (298,669)
Place of birth for U.S.-born residents:
This state: 15,308Other state: 2,311Northeast: 607Midwest: 197South: 1,403West: 48 93.0% of West Little River residents lived in the same house 1 years ago.
Out of people who lived in different houses, 45.8% lived in this county.
Out of people who lived in different counties, 48.8% lived in Florida.
West Little River:
93.0%State average:
86.3%
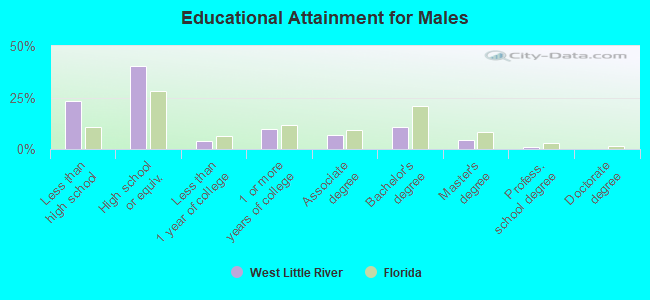
Education attainment for males 25 years and older:
No schooling: 381Nursery to 4th grade: 2405th and 6th grade: 3837th and 8th grade: 2369th grade: 16810th grade: 33511th grade: 32412th grade, no diploma: 612High school graduate (or equivalency): 4,605Less than 1 year of college: 423Some college more than 1 year, no degree: 1,096Associate degree: 778Bachelor's degree: 1,201Master's degree: 506Professional school degree: 123Doctorate degree: 18
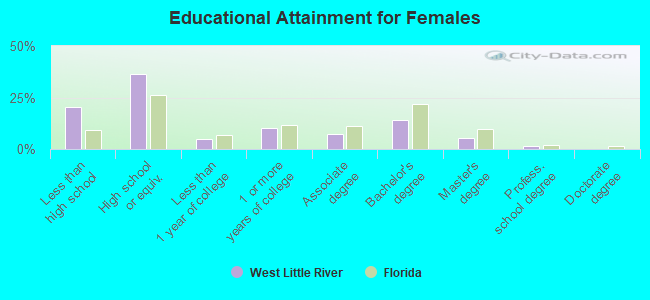
Education attainment for females 25 years and older:
No schooling: 792Nursery to 4th grade: 1655th and 6th grade: 2627th and 8th grade: 1669th grade: 8610th grade: 15411th grade: 24412th grade, no diploma: 537High school graduate (or equivalency): 4,358Less than 1 year of college: 552Some college more than 1 year, no degree: 1,236Associate degree: 882Bachelor's degree: 1,704Master's degree: 622Professional school degree: 163Doctorate degree: 9
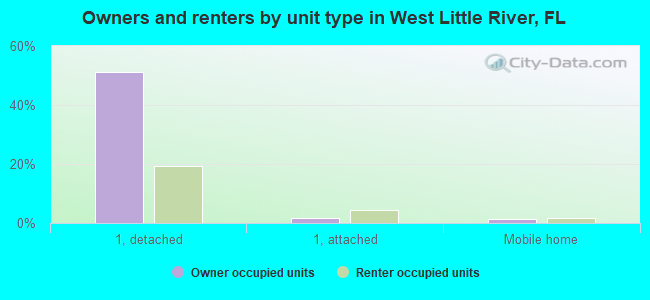
Housing units in structures:
One, detached: 7,684One, attached: 1,066Two: 5213 or 4: 1655 to 9: 21210 to 19: 12420 to 49: 9950 or more: 330Mobile homes: 1,013Median worth of mobile homes: $198,111
Housing units lacking complete plumbing facilities in 2022: 0.8%Housing units lacking complete kitchen facilities in 2022: 1.4%House/condo owner moved in on average 26 years ago
Renter moved in on average 5 years ago
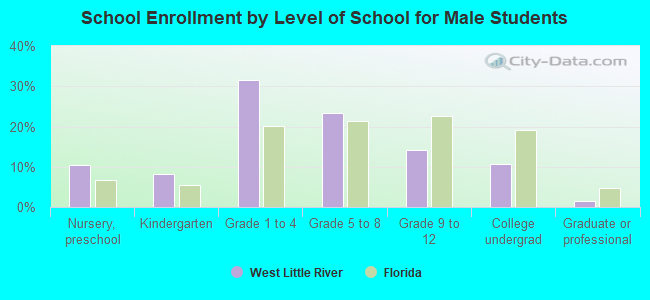
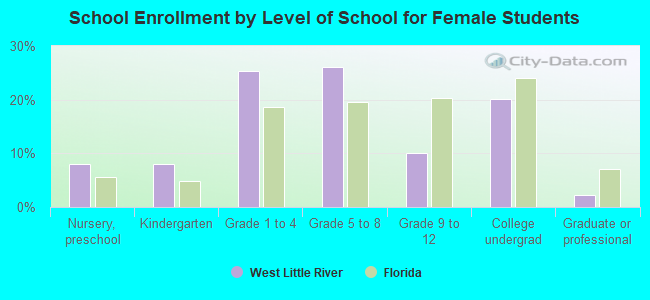
Private vs. public school enrollment:
Students in private schools in grades 1 to 8 (elementary and middle school): 904 Students in private schools in grades 9 to 12 (high school): 48 Students in private undergraduate colleges: 95