West Babylon, NY (New York) Houses and Residents
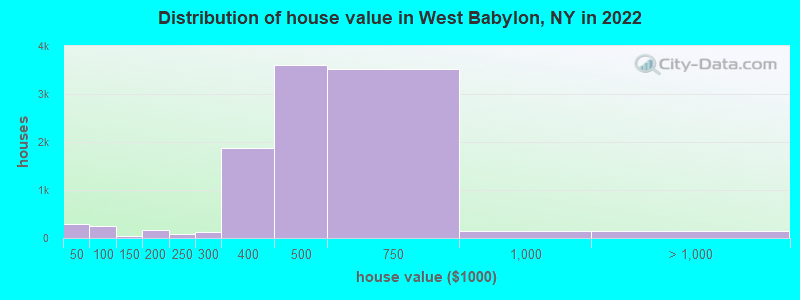
Estimated median house or condo value in 2022: $498,446 (it was $164,800 in 2000 )
West Babylon:
$498,446New York:
$400,400
Lower value quartile - upper value quartile: $402,098 - $574,285Mean price in 2022: Detached houses: $482,112 Here:
$482,112State:
$476,719
Townhouses or other attached units: $585,380 Here:
$585,380State:
$699,270
In 2-unit structures: $546,419 Here:
$546,419State:
$713,077
In 3-to-4-unit structures: $540,442 Here:
$540,442State:
$764,568
In 5-or-more-unit structures: $228,991 Here:
$228,991State:
$912,009
Total population: 43,213 (All urban)
Houses: 14,534 (13,997 occupied: 10,731 owner occupied, 3,260 renter occupied )
% of renters here:
23%State:
46%
Housing density: 1,886 houses/condos per square mile
Median price asked for vacant for-sale houses and condos in 2022: $568,841.
Median contract rent in 2022: over $2,000 (lower quartile is $1,512, upper quartile is over $2,000)
Median rent asked for vacant for-rent units in 2022: $3,553
Median gross rent in West Babylon, NY in 2022: over $2,000
Housing units in West Babylon with a mortgage: 6,695 (846 second mortgage, 82 home equity loan, 683 both second mortgage and home equity loan )Houses without a mortgage: 236
Median household income for houses/condos with a mortgage: $137,223
Median household income for apartments without a mortgage: $110,188
Median monthly housing costs: $2,301
Data:
Median house or condo value ($)
Median house or condo value ($ change since 2000)
Median house or condo value ($) - White
Median house or condo value ($) - Black or African American
Median house or condo value ($) - Asian
Median house or condo value ($) - Hispanic or Latino
Median house or condo value ($) - American Indian and Alaska Native
Median house or condo value ($) - Multirace
Median house or condo value ($) - Other Race
Median price asked for mobile homes ($)
Household density (households per square mile)
Mean house or condo value by units in structure - 1, detached ($)
Mean house or condo value by units in structure - 1, attached ($)
Mean house or condo value by units in structure - 2 ($)
Mean house or condo value by units in structure by units in structure - 3 or 4 ($)
Mean house or condo value by units in structure - 5 or more ($)
Mean house or condo value by units in structure - Boat, RV, van, etc. ($)
Mean house or condo value by units in structure - Mobile home ($)
Median contract rent ($)
Median contract rent - Lower quartile ($)
Median contract rent - Upper quartile ($)
Median gross rent ($)
Urban houses (%)
Rural houses (%)
Houses occupied (%)
Houses occupied (% change since 2000)
Houses owner occupied (%)
Houses owner occupied (% change since 2000)
Houses renter occupied (%)
Houses renter occupied (% change since 2000)
Vacant housing units - For rent (%)
Vacant housing units - For rent (% change since 2000)
Vacant housing units - For sale only (%)
Vacant housing units - For sale only (% change since 2000)
Vacant housing units - Rented or sold, not occupied (%)
Vacant housing units - Rented or sold, not occupied (% change since 2000)
Vacant housing units - For seasonal, recreational, or occasional use (%)
Vacant housing units - For seasonal, recreational, or occasional use (% change since 2000)
Vacant housing units - For migrant workers (%)
Vacant housing units - For migrant workers (% change since 2000)
Vacant housing units - Other vacant (%)
Vacant housing units - Other vacant (% change since 2000)
Median monthly housing costs ($)
Median household income for houses/condos with a mortgage ($)
Median household income for houses/condos without a mortgage ($)
Median household income ($)
Median household income ($) - White
Median household income ($) - Black or African American
Median household income ($) - Asian
Median household income ($) - Hispanic or Latino
Median household income ($) - American Indian and Alaska Native
Median household income ($) - Multirace
Median household income ($) - Other Race
Mortgage status - with mortgage (%)
Mortgage status - with second mortgage (%)
Mortgage status - with home equity loan (%)
Mortgage status - with both second mortgage and home equity loan (%)
Mortgage status - without a mortgage (%)
Median year house/condo built
Median year apartment built
Household type by relationship - Male householder living alone (%)
Household type by relationship - Male householder not living alone (%)
Household type by relationship - Female householder living alone (%)
Household type by relationship - Female householder not living alone (%)
Household type by relationship - Opposite-Sex spouse (%)
Household type by relationship - Same-Sex spouse (%)
Household type by relationship - Opposite-Sex unmarried partner (%)
Household type by relationship - Same-Sex unmarried partner (%)
Household type by relationship - In group quarters (%)
Size of family households - 2-person household (%)
Size of family households - 3-person household (%)
Size of family households - 4-person household (%)
Size of family households - 5-person household (%)
Size of family households - 6-person household (%)
Size of family households - 7-or-more-person household (%)
Size of nonfamily households - 1-person household (%)
Size of nonfamily households - 2-person household (%)
Size of nonfamily households - 3-person household (%)
Size of nonfamily households - 4-person household (%)
Size of nonfamily households - 5-person household (%)
Size of nonfamily households - 6-person household (%)
Size of nonfamily households - 7-or-moreperson household (%)
Year house built - Built 2010 or later (%)
Year house built - Built 2000 to 2009 (%)
Year house built - Built 1990 to 1999 (%)
Year house built - Built 1980 to 1989 (%)
Year house built - Built 1970 to 1979 (%)
Year house built - Built 1960 to 1969 (%)
Year house built - Built 1950 to 1959 (%)
Year house built - Built 1940 to 1949 (%)
Year house built - Built 1939 or earlier (%)
Median number of rooms in houses and condos
Median number of rooms in apartments
Median number of bedrooms in owner occupied houses
Mean number of bedrooms in owner occupied houses
Median number of bedrooms in renter occupied houses
Mean number of bedrooms in renter occupied houses
Median number of vehichles in owner occupied houses
Mean number of vehichles in owner occupied houses
Median number of vehichles in renter occupied houses
Mean number of vehichles in renter occupied houses
Rooms in owner-occupied houses - 1 room (%)
Rooms in owner-occupied houses - 2 rooms (%)
Rooms in owner-occupied houses - 3 rooms (%)
Rooms in owner-occupied houses - 4 rooms (%)
Rooms in owner-occupied houses - 5 rooms (%)
Rooms in owner-occupied houses - 6 rooms (%)
Rooms in owner-occupied houses - 7 rooms (%)
Rooms in owner-occupied houses - 8 rooms (%)
Rooms in owner-occupied houses - 9+ rooms (%)
Rooms in renter-occupied houses - 1 room (%)
Rooms in renter-occupied houses - 2 rooms (%)
Rooms in renter-occupied houses - 3 rooms (%)
Rooms in renter-occupied houses - 4 rooms (%)
Rooms in renter-occupied houses - 5 rooms (%)
Rooms in renter-occupied houses - 6 rooms (%)
Rooms in renter-occupied houses - 7 rooms (%)
Rooms in renter-occupied houses - 8 rooms (%)
Rooms in renter-occupied houses - 9+ rooms (%)
Bedrooms in owner-occupied houses - no bedrooms (%)
Bedrooms in owner-occupied houses - 1 bedroom (%)
Bedrooms in owner-occupied houses - 2 bedrooms (%)
Bedrooms in owner-occupied houses - 3 bedrooms (%)
Bedrooms in owner-occupied houses - 4 bedrooms (%)
Bedrooms in owner-occupied houses - 5+ bedrooms (%)
Bedrooms in renter-occupied houses - no bedrooms (%)
Bedrooms in renter-occupied houses - 1 bedroom (%)
Bedrooms in renter-occupied houses - 2 bedrooms (%)
Bedrooms in renter-occupied houses - 3 bedrooms (%)
Bedrooms in renter-occupied houses - 4 bedrooms (%)
Bedrooms in renter-occupied houses - 5+ bedrooms (%)
Vehicles available in owner-occupied houses - no vehicle available (%)
Vehicles available in owner-occupied houses - 1 vehicle available(%)
Vehicles available in owner-occupied houses - 2 Vehicles available (%)
Vehicles available in owner-occupied houses - 3 Vehicles available (%)
Vehicles available in owner-occupied houses - 4 Vehicles available (%)
Vehicles available in owner-occupied houses - 5+ Vehicles available (%)
Vehicles available in renter-occupied houses - no vehicle available (%)
Vehicles available in renter-occupied houses - 1 vehicle available (%)
Vehicles available in renter-occupied houses - 2 Vehicles available (%)
Vehicles available in renter-occupied houses - 3 Vehicles available (%)
Vehicles available in renter-occupied houses - 4 Vehicles available (%)
Vehicles available in renter-occupied houses - 5+ Vehicles available (%)
Housing units in structures - 1, detached (%)
Housing units in structures - 1, attached (%)
Housing units in structures - 2 (%)
Housing units in structures - 3 or 4 (%)
Housing units in structures - 5 to 9 (%)
Housing units in structures - 10 to 19 (%)
Housing units in structures - 20 to 49 (%)
Housing units in structures - 50 or more (%)
Housing units in structures - Mobile home (%)
Housing units in structures - Boat, RV, van, etc. (%)
Housing units in structures - Owners - 1, detached (%)
Housing units in structures - Owners - 1, attached (%)
Housing units in structures - Owners - 2 (%)
Housing units in structures - Owners - 3 or 4 (%)
Housing units in structures - Owners - 5 to 9 (%)
Housing units in structures - Owners - 10 to 19 (%)
Housing units in structures - Owners - 20 to 49 (%)
Housing units in structures - Owners - 50 or more (%)
Housing units in structures - Owners - Mobile home (%)
Housing units in structures - Owners - Boat, RV, van, etc. (%)
Housing units in structures - Renters - 1, detached (%)
Housing units in structures - Renters - 1, attached (%)
Housing units in structures - Renters - 2 (%)
Housing units in structures - Renters - 3 or 4 (%)
Housing units in structures - Renters - 5 to 9 (%)
Housing units in structures - Renters - 10 to 19 (%)
Housing units in structures - Renters - 20 to 49 (%)
Housing units in structures - Renters - 50 or more (%)
Housing units in structures - Renters - Mobile home (%)
Housing units in structures - Renters - Boat, RV, van, etc. (%)
House/condo owner moved in on average (years ago)
Renter moved in on average (years ago)
Year householder moved into unit - Moved in 1999 to March 2000 (%)
Year householder moved into unit - Moved in 1999 to March 2000 (%) - White
Year householder moved into unit - Moved in 1999 to March 2000 (%) - Black or African American
Year householder moved into unit - Moved in 1999 to March 2000 (%) - Asian
Year householder moved into unit - Moved in 1999 to March 2000 (%) - Hispanic or Latino
Year householder moved into unit - Moved in 1999 to March 2000 (%) - American Indian and Alaska Native
Year householder moved into unit - Moved in 1999 to March 2000 (%) - Multirace
Year householder moved into unit - Moved in 1999 to March 2000 (%) - Other Race
Year householder moved into unit - Moved in 1995 to 1998 (%)
Year householder moved into unit - Moved in 1995 to 1998 (%) - White
Year householder moved into unit - Moved in 1995 to 1998 (%) - Black or African American
Year householder moved into unit - Moved in 1995 to 1998 (%) - Asian
Year householder moved into unit - Moved in 1995 to 1998 (%) - Hispanic or Latino
Year householder moved into unit - Moved in 1995 to 1998 (%) - American Indian and Alaska Native
Year householder moved into unit - Moved in 1995 to 1998 (%) - Multirace
Year householder moved into unit - Moved in 1995 to 1998 (%) - Other Race
Year householder moved into unit - Moved in 1990 to 1994 (%)
Year householder moved into unit - Moved in 1990 to 1994 (%) - White
Year householder moved into unit - Moved in 1990 to 1994 (%) - Black or African American
Year householder moved into unit - Moved in 1990 to 1994 (%) - Asian
Year householder moved into unit - Moved in 1990 to 1994 (%) - Hispanic or Latino
Year householder moved into unit - Moved in 1990 to 1994 (%) - American Indian and Alaska Native
Year householder moved into unit - Moved in 1990 to 1994 (%) - Multirace
Year householder moved into unit - Moved in 1990 to 1994 (%) - Other Race
Year householder moved into unit - Moved in 1980 to 1989 (%)
Year householder moved into unit - Moved in 1980 to 1989 (%) - White
Year householder moved into unit - Moved in 1980 to 1989 (%) - Black or African American
Year householder moved into unit - Moved in 1980 to 1989 (%) - Asian
Year householder moved into unit - Moved in 1980 to 1989 (%) - Hispanic or Latino
Year householder moved into unit - Moved in 1980 to 1989 (%) - American Indian and Alaska Native
Year householder moved into unit - Moved in 1980 to 1989 (%) - Multirace
Year householder moved into unit - Moved in 1980 to 1989 (%) - Other Race
Year householder moved into unit - Moved in 1970 to 1979 (%)
Year householder moved into unit - Moved in 1970 to 1979 (%) - White
Year householder moved into unit - Moved in 1970 to 1979 (%) - Black or African American
Year householder moved into unit - Moved in 1970 to 1979 (%) - Asian
Year householder moved into unit - Moved in 1970 to 1979 (%) - Hispanic or Latino
Year householder moved into unit - Moved in 1970 to 1979 (%) - American Indian and Alaska Native
Year householder moved into unit - Moved in 1970 to 1979 (%) - Multirace
Year householder moved into unit - Moved in 1970 to 1979 (%) - Other Race
Year householder moved into unit - Moved in 1969 or earlier (%)
Year householder moved into unit - Moved in 1969 or earlier (%) - White
Year householder moved into unit - Moved in 1969 or earlier (%) - Black or African American
Year householder moved into unit - Moved in 1969 or earlier (%) - Asian
Year householder moved into unit - Moved in 1969 or earlier (%) - Hispanic or Latino
Year householder moved into unit - Moved in 1969 or earlier (%) - American Indian and Alaska Native
Year householder moved into unit - Moved in 1969 or earlier (%) - Multirace
Year householder moved into unit - Moved in 1969 or earlier (%) - Other Race
Housing units lacking complete plumbing facilities (%)
Housing units lacking complete kitchen facilities (%)
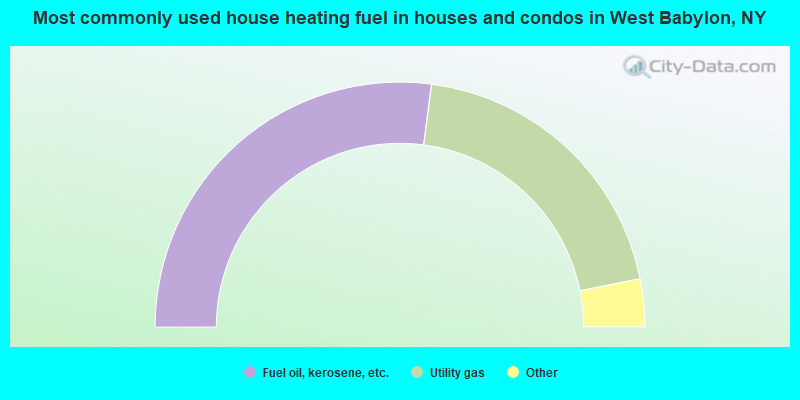
House heating fuel used in houses and condos - Utility gas (%)
House heating fuel used in houses and condos - Bottled, tank, or LP gas (%)
House heating fuel used in houses and condos - Electricity (%)
House heating fuel used in houses and condos - Fuel oil, kerosene, etc. (%)
House heating fuel used in houses and condos - Coal or coke (%)
House heating fuel used in houses and condos - Wood (%)
House heating fuel used in houses and condos - Solar energy (%)
House heating fuel used in houses and condos - Other fuel (%)
House heating fuel used in houses and condos - No fuel used (%)
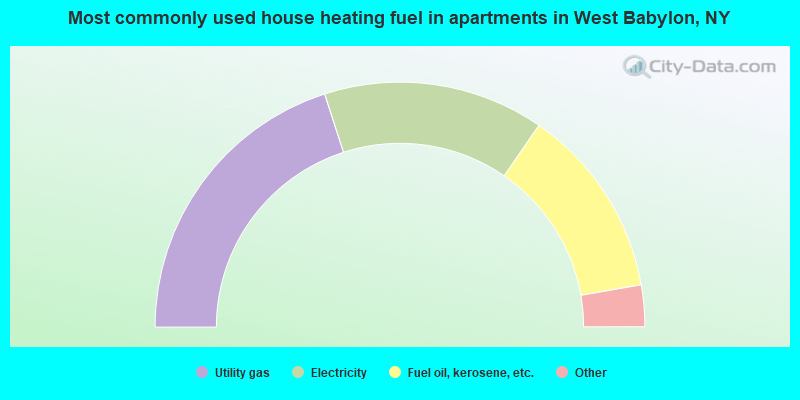
House heating fuel used in apartments - Utility gas (%)
House heating fuel used in apartments - Bottled, tank, or LP gas (%)
House heating fuel used in apartments - Electricity (%)
House heating fuel used in apartments - Fuel oil, kerosene, etc. (%)
House heating fuel used in apartments - Coal or coke (%)
House heating fuel used in apartments - Wood (%)
House heating fuel used in apartments - Solar energy (%)
House heating fuel used in apartments - Other fuel (%)
House heating fuel used in apartments - No fuel used (%)
Median year house/condo built: 1960Median year apartment built: 1968Household type by relationship:
Households: 42,810
Male householders: 6,816 (1,278 living alone ), Female householders: 7,149 (1,707 living alone )7,030 spouses (6,957 opposite-sex spouses ), 1,046 unmarried partners , (1,028 opposite-sex unmarried partners ), 13,422 children (12,608 natural , 240 adopted , 574 stepchildren ), 1,531 grandchildren , 538 brothers or sisters , 979 parents , 0 foster children , 1,488 other relatives , 2,206 non-relatives In group quarters: 599
Size of family households: 3,272 2-persons , 2,330 3-persons , 2,528 4-persons , 1,081 5-persons , 457 6-persons , 241 7-or-more-persons .
Size of nonfamily households: 3,009 1-person , 880 2-persons , 85 3-persons , 18 4-persons , 16 5-persons , 19 7-or-more-persons .
4,492 married couples with children. single-parent households (557 men , 998 women ).
78.5% of residents of West Babylon speak English at home. of residents speak Spanish at home (60% speak English very well , 24% speak English well , 12% speak English not well , 3% don't speak English at all ).of residents speak other Indo-European language at home (61% speak English very well , 23% speak English well , 14% speak English not well , 3% don't speak English at all ).of residents speak Asian or Pacific Island language at home (60% speak English very well , 24% speak English well , 15% speak English not well , 2% don't speak English at all ).of residents speak other language at home (88% speak English very well , 7% speak English well , 5% speak English not well ).
Foreign born population: 6,805 (15.9%)of them are naturalized citizens )
Median number of rooms in houses and condos:
Median number of rooms in apartments
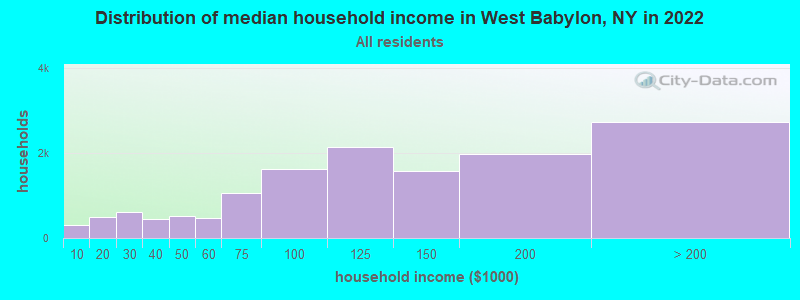
West Babylon, NY household income distribution 308 Less than $10,000482 $10,000 to $19,999604 $20,000 to $29,999452 $30,000 to $39,999518 $40,000 to $49,999469 $50,000 to $59,9991,058 $60,000 to $74,9991,625 $75,000 to $99,9992,146 $100,000 to $124,9991,583 $125,000 to $149,9991,977 $150,000 to $199,9992,727 $200,000 or more
Home value of owner - occupied houses in 2022 in West Babylon, NY 76 Less than $10,0009 $10,000 to $14,99929 $20,000 to $24,99945 $30,000 to $34,99927 $35,000 to $39,99997 $40,000 to $49,99954 $50,000 to $59,99950 $60,000 to $69,99933 $80,000 to $89,99918 $90,000 to $99,99939 $100,000 to $124,9999 $125,000 to $149,99975 $150,000 to $174,99991 $175,000 to $199,99985 $200,000 to $249,999115 $250,000 to $299,9991,869 $300,000 to $399,9993,608 $400,000 to $499,9993,530 $500,000 to $749,999152 $750,000 to $999,99932 $1,500,000 to $1,999,999119 $2,000,000 or moreRent paid by renters in 2022 in West Babylon, NY 43 Less than $1004 $150 to $19970 $350 to $3999 $450 to $49962 $550 to $59930 $600 to $64913 $800 to $8990 $900 to $999255 $1,000 to $1,249151 $1,250 to $1,499765 $1,500 to $1,999744 $2,000 to $2,499591 $2,500 to $2,999158 $3,000 to $3,499105 $3,500 or more267 No cash rent
Percentage of workers working in this county: 67.6%Number of people working at home: 2,223 (9.7% of all workers )
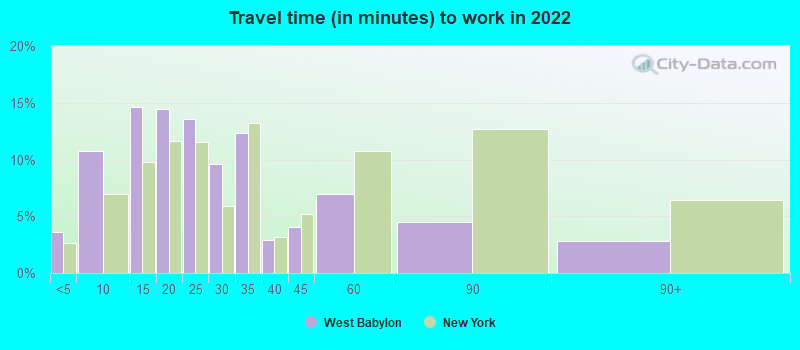
Travel time to work (commute)
Less than 5 minutes: 4355 to 9 minutes: 1,91610 to 14 minutes: 2,45915 to 19 minutes: 2,95020 to 24 minutes: 2,76725 to 29 minutes: 1,43330 to 34 minutes: 2,11435 to 39 minutes: 35540 to 44 minutes: 61745 to 59 minutes: 1,82560 to 89 minutes: 2,23790 or more minutes: 1,418
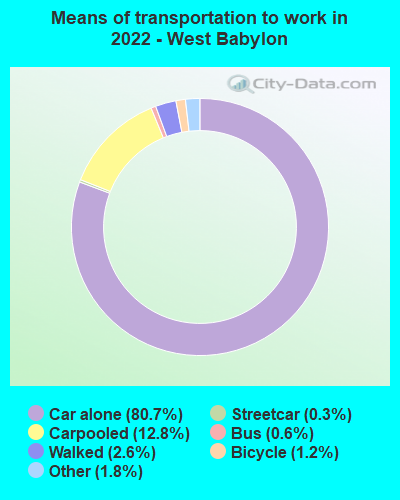
Means of transportation to work:
Drove a car alone: 8,833 (66.6%)Carpooled: 1,607 (12.1%)Bus : 61 (0.5%)Subway or elevated rail : 38 (0.3%)Taxi: 242 (1.8%)Bicycle: 105 (0.8%)Walked: 305 (2.3%)Worked at home: 2,223 (16.8%)
Unemployment by race in 2022
Unemployment rate for White non-Hispanic residents 6.9% Males4.8% FemalesUnemployment rate for Black residents 2.7% Males7.2% FemalesUnemployment rate for other race residents 3.6% Males4.8% FemalesUnemployment rate for two or more race residents 3.6% Males5.1% FemalesUnemployment rate for Hispanic or Latino residents 3.3% Males5.1% Females
Year of entry for the foreign-born population in West Babylon, New York
2,000 2010 or later 1,155 2000 to 2009 1,652 1990 to 1999 933 1980 to 1989 749 1970 to 1979 1,710 Before 1970
First ancestries reported:
Italian: 4,838 (27.0%)
Irish: 2,137 (11.9%)
Jamaican: 810 (4.5%)
Polish: 714 (4.0%)
German: 614 (3.4%)
Haitian: 594 (3.3%)
American: 564 (3.2%)
Turkish: 458 (2.6%)
Trinidadian and Tobagonian: 229 (1.3%)
English: 223 (1.2%)
European: 168 (0.9%)
Russian: 124 (0.7%)
Eastern European: 106 (0.6%)
Guyanese: 99 (0.6%)
Norwegian: 96 (0.5%)
Greek: 67 (0.4%)
Finnish: 56 (0.3%)
Brazilian: 53 (0.3%)
Slovene: 47 (0.3%)
Dutch: 45 (0.3%)
Austrian: 42 (0.2%)
Czechoslovakian: 42 (0.2%)
Ukrainian: 42 (0.2%)
Ghanaian: 41 (0.2%)
Scotch-Irish: 34 (0.2%)
Slovak: 33 (0.2%)
African: 27 (0.2%)
Swiss: 27 (0.2%)
French: 27 (0.2%)
Scottish: 25 (0.1%)
French Canadian: 24 (0.1%)
Scandinavian: 22 (0.1%)
Lithuanian: 16 (0.09%)
Swedish: 16 (0.09%)
Portuguese: 12 (0.07%)
Bahamian: 12 (0.07%)
Ugandan: 11 (0.06%)
Romanian: 8 (0.04%)
Hungarian: 8 (0.04%)
Belizean: 7 (0.04%)
Australian: 5 (0.03%)
Czech: 5 (0.03%)
Armenian: 3 (0.02%) Most common places of birth for foreign-born residents (%): El Salvador West Babylon:
13.2% (831)New York:
2.4% (108,067)
Jamaica West Babylon:
9.9% (624)New York:
5.0% (227,557)
Dominican Republic West Babylon:
9.1% (574)New York:
11.1% (501,040)
Haiti West Babylon:
7.9% (499)New York:
2.8% (126,936)
Turkey West Babylon:
5.2% (329)New York:
0.5% (21,009)
Colombia West Babylon:
5.0% (311)New York:
2.5% (111,920)
Italy West Babylon:
4.9% (310)New York:
1.8% (81,374)
Honduras West Babylon:
4.0% (254)New York:
1.2% (55,571)
Poland West Babylon:
3.4% (216)New York:
1.4% (65,102)
Ecuador West Babylon:
3.2% (202)New York:
3.9% (177,448)
China, excluding Hong Kong and Taiwan West Babylon:
2.5% (154)New York:
9.1% (410,910)
Trinidad and Tobago West Babylon:
2.2% (136)New York:
2.0% (91,428)
Guyana West Babylon:
2.2% (135)New York:
3.8% (172,129)
Peru West Babylon:
1.9% (121)New York:
1.2% (54,759)
St. Lucia West Babylon:
1.7% (109)New York:
0.3% (11,590)
Germany West Babylon:
1.7% (104)New York:
0.9% (38,713)
Pakistan West Babylon:
1.6% (101)New York:
1.4% (62,442)
United Kingdom, excluding England and Scotland West Babylon:
1.5% (95)New York:
0.8% (33,869)
Place of birth for U.S.-born residents:
This state: 32,549Other state: 2,217Northeast: 979Midwest: 232South: 744West: 190 92.3% of West Babylon residents lived in the same house 1 years ago.
Out of people who lived in different houses, 39.3% lived in this county.
Out of people who lived in different counties, 81.4% lived in New York.
West Babylon:
92.3%State average:
89.6%
Education attainment for males 25 years and older:
No schooling: 524Nursery to 4th grade: 665th and 6th grade: 987th and 8th grade: 1269th grade: 2610th grade: 12111th grade: 8612th grade, no diploma: 448High school graduate (or equivalency): 5,104Less than 1 year of college: 999Some college more than 1 year, no degree: 1,445Associate degree: 1,469Bachelor's degree: 2,810Master's degree: 1,596Professional school degree: 378Doctorate degree: 75
Education attainment for females 25 years and older:
No schooling: 644Nursery to 4th grade: 505th and 6th grade: 1467th and 8th grade: 1179th grade: 12410th grade: 10911th grade: 15512th grade, no diploma: 337High school graduate (or equivalency): 4,592Less than 1 year of college: 1,122Some college more than 1 year, no degree: 1,649Associate degree: 1,661Bachelor's degree: 2,777Master's degree: 2,094Professional school degree: 295Doctorate degree: 78
Housing units in structures:
One, detached: 10,950One, attached: 331Two: 1,0283 or 4: 2745 to 9: 27810 to 19: 41120 to 49: 38150 or more: 686Mobile homes: 189Housing units lacking complete plumbing facilities in 2022: 1.2%Housing units lacking complete kitchen facilities in 2022: 1.6%House/condo owner moved in on average 21 years ago
Renter moved in on average 6 years ago
Private vs. public school enrollment:
Students in private schools in grades 1 to 8 (elementary and middle school): 124 Students in private schools in grades 9 to 12 (high school): 133 Students in private undergraduate colleges: 681