Weddington, NC (North Carolina) Houses and Residents
| Weddington: | $820,302 |
| North Carolina: | $280,600 |
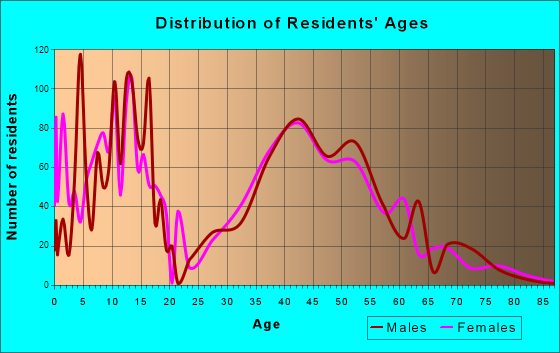
Total population: 10,322 (Urban population: 3,581, Rural population: 3,483 (12 farm, 3,471 nonfarm))
Houses: 4,576 (4,454 occupied: 4,165 owner occupied, 283 renter occupied)
| % of renters here: | 6% |
| State: | 33% |
Housing density: 290 houses/condos per square mile
Median price asked for vacant for-sale houses and condos in 2022: $4,516,597.
Median contract rent in 2022: over $2,000
Median gross rent in Weddington, NC in 2022: over $2,000
Housing units in Weddington with a mortgage: 2,972 (571 second mortgage, 7 home equity loan, 421 both second mortgage and home equity loan)
Houses without a mortgage: 27
Median household income for houses/condos with a mortgage: $198,296
Median household income for apartments without a mortgage: $135,484
Median monthly housing costs: $2,309
Compare current foreclosures near Weddington, NC:
| Photo | Address | Area | Beds / Baths | Price | Details |
|---|---|---|---|---|---|

|
#1
W Franklin St
Monroe, NC 28112
|
2,107 sq. feet
|
2 baths 3 beds |
$254,900
|
show details |

|
#2
Baylor Dr
Rock Hill, SC 29732
|
- sq. feet
|
2 baths 4 beds |
$236,200
|
show details |

|
#3
Haverstraw Ct
Charlotte, NC 28212
|
1,282 sq. feet
|
2 baths 3 beds |
show details | |

|
#4
Concord Hwy
Monroe, NC 28110
|
1,456 sq. feet
|
1 baths 3 beds |
show details | |

|
#5
Lederer Ave
Charlotte, NC 28277
|
3,768 sq. feet
|
4 baths 5 beds |
show details | |

|
#6
Fort Mill Highway , Indian Land, Sc 29707 Aka 806 Fort Mill Highway
Fort Mill, SC 29715
|
1,330 sq. feet
|
2 baths 3 beds |
show details | |

|
#7
Fugate Ave
Charlotte, NC 28205
|
1,472 sq. feet
|
1 baths 3 beds |
show details | |

|
#8
Northgate Trail Dr
Charlotte, NC 28215
|
2,063 sq. feet
|
2 baths 3 beds |
show details | |

|
#9
Trinity Trace Ln
Monroe, NC 28110
|
3,820 sq. feet
|
4 baths 5 beds |
show details | |

|
#10
Lebanon Rd
Charlotte, NC 28227
|
1,374 sq. feet
|
2 baths 3 beds |
show details |
| Photo | Address | Area | Beds / Baths | Price | Details |
|---|---|---|---|---|---|

|
#11
Grover Rogers Rd
Waxhaw, NC 28173
|
1,511 sq. feet
|
2 baths 3 beds |
show details | |

|
#12
Alexander Commons Dr
Monroe, NC 28112
|
2,698 sq. feet
|
3 baths 5 beds |
show details | |

|
#13
John Stevenson Rd
Monroe, NC 28110
|
1,716 sq. feet
|
1 baths 4 beds |
show details | |

|
#14
Tree Haven Dr
Charlotte, NC 28270
|
1,874 sq. feet
|
2 baths 3 beds |
show details | |

|
#15
University Dr
Charlotte, NC 28209
|
1,014 sq. feet
|
1 baths 3 beds |
show details | |

|
#16
Connan Ln
Charlotte, NC 28226
|
1,664 sq. feet
|
2 baths 3 beds |
show details | |

|
#17
Painted Tree Rd
Charlotte, NC 28226
|
1,906 sq. feet
|
2 baths 3 beds |
show details | |

|
#18
Bellflower Ln
Charlotte, NC 28227
|
1,925 sq. feet
|
2 baths 3 beds |
show details | |

|
#19
Silveroak Ln
Charlotte, NC 28277
|
2,270 sq. feet
|
2 baths 4 beds |
show details | |

|
#20
Petrea Ln
Charlotte, NC 28227
|
1,360 sq. feet
|
2 baths 3 beds |
show details |
| Photo | Address | Area | Beds / Baths | Price | Details |
|---|---|---|---|---|---|

|
#21
Clear Hill Ct
Monroe, NC 28110
|
1,522 sq. feet
|
2 baths 3 beds |
show details | |

|
#22
Hanging Moss Trl
Charlotte, NC 28227
|
2,252 sq. feet
|
2 baths 3 beds |
show details | |

|
#23
Rainbow Dr
Charlotte, NC 28227
|
1,905 sq. feet
|
2 baths 3 beds |
show details | |

|
#24
Abode Lilly Ln
Charlotte, NC 28227
|
2,726 sq. feet
|
2 baths 3 beds |
show details | |

|
#25
Cromarty Ln
Charlotte, NC 28227
|
1,103 sq. feet
|
1 baths 3 beds |
show details | |

|
#26
Winding Way Dr
Monroe, NC 28110
|
1,272 sq. feet
|
2 baths 3 beds |
show details | |

|
#27
Love Rd
Monroe, NC 28110
|
1,176 sq. feet
|
3 baths 4 beds |
show details | |

|
#28
Newell Dr
Monroe, NC 28112
|
2,165 sq. feet
|
1 baths 3 beds |
show details | |

|
#29
Quail Ridge Dr
Charlotte, NC 28226
|
2,016 sq. feet
|
2 baths 4 beds |
show details | |

|
#30
Langford Ct
Charlotte, NC 28227
|
1,384 sq. feet
|
2 baths 3 beds |
show details |
| Photo | Address | Area | Beds / Baths | Price | Details |
|---|---|---|---|---|---|

|
#31
Robin Crest Rd
Charlotte, NC 28226
|
1,431 sq. feet
|
2 baths 3 beds |
show details | |

|
#32
Carysbrook Ln
Charlotte, NC 28217
|
1,680 sq. feet
|
2 baths 3 beds |
show details | |

|
#33
Faulconbridge Rd
Charlotte, NC 28227
|
2,130 sq. feet
|
2 baths 4 beds |
show details | |

|
#34
Pisgah Way
Charlotte, NC 28217
|
1,260 sq. feet
|
2 baths 2 beds |
show details | |

|
#35
Lawrence Daniel Dr
Matthews, NC 28104
|
2,250 sq. feet
|
1 baths 3 beds |
show details | |

|
#36
Aldersbrook Dr
Monroe, NC 28110
|
1,419 sq. feet
|
2 baths 3 beds |
show details | |

|
#37
Rolling Sky Dr
Charlotte, NC 28273
|
1,639 sq. feet
|
2 baths 3 beds |
show details | |

|
#38
Downing St
Charlotte, NC 28205
|
1,776 sq. feet
|
2 baths - beds |
show details | |

|
#39
Parkers Crossing Dr
Charlotte, NC 28215
|
1,255 sq. feet
|
2 baths 3 beds |
show details | |

|
#40
Graybark Ave
Charlotte, NC 28205
|
1,316 sq. feet
|
1 baths 3 beds |
show details |
| Photo | Address | Area | Beds / Baths | Price | Details |
|---|---|---|---|---|---|

|
#41
Sudbury Rd
Charlotte, NC 28205
|
1,409 sq. feet
|
1 baths 3 beds |
show details | |

|
#42
Anson St
Charlotte, NC 28209
|
1,280 sq. feet
|
1 baths 2 beds |
show details | |

|
#43
Myers Rd
Monroe, NC 28110
|
1,384 sq. feet
|
2 baths 3 beds |
show details | |

|
#44
Creft Cir
Indian Trail, NC 28079
|
1,960 sq. feet
|
2 baths 4 beds |
show details | |

|
#45
Lanark Ct
Charlotte, NC 28217
|
1,500 sq. feet
|
2 baths 3 beds |
show details | |

|
#46
Edgeview Dr
Indian Trail, NC 28079
|
2,232 sq. feet
|
1 baths 4 beds |
show details | |

|
#47
O Toole Dr
Matthews, NC 28105
|
1,844 sq. feet
|
2 baths 5 beds |
show details | |

|
#48
Heathershire Ln
Matthews, NC 28105
|
2,270 sq. feet
|
2 baths 5 beds |
show details | |

|
#49
Lawrence Daniel Dr
Matthews, NC 28104
|
2,514 sq. feet
|
1 baths 4 beds |
show details | |

|
Check over 1 million property listings on Foreclosure.com!
|
browse all offers | |||

Latest news about housing in Weddington, NC collected exclusively by city-data.com from local newspapers, TV, and radio stations


Median year apartment built: 1989
Household type by relationship:
Households: 13,664- Male householders: 2,388 (230 living alone), Female householders: 2,009 (141 living alone)
3,704 spouses (3,640 opposite-sex spouses), 51 unmarried partners, (51 opposite-sex unmarried partners), 5,042 children (4,850 natural, 76 adopted, 115 stepchildren), 49 grandchildren, 43 brothers or sisters, 237 parents, 0 foster children, 126 other relatives, 10 non-relatives
Size of family households: 1,448 2-persons, 907 3-persons, 1,050 4-persons, 331 5-persons, 205 6-persons, 35 7-or-more-persons.
Size of nonfamily households: 366 1-person, 75 2-persons.
3,741 married couples with children.
142 single-parent households (0 men, 142 women).
85.7% of residents of Weddington speak English at home.
4.2% of residents speak Spanish at home (45% speak English very well, 47% speak English well, 8% speak English not well).
5.9% of residents speak other Indo-European language at home (90% speak English very well, 10% speak English well).
3.2% of residents speak Asian or Pacific Island language at home (90% speak English very well, 6% speak English well, 4% speak English not well).
1.2% of residents speak other language at home (100% speak English very well).
Foreign born population: 2,387 (17.5%)
(72.5% of them are naturalized citizens)
| Here: | 9.9 |
| State: | 6.4 |
| Here: | 6.3 |
| State: | 4.4 |

- Bedrooms in owner-occupied houses and condos in Weddington, North Carolina
- 0no bedroom
- 01 bedroom
- 372 bedrooms
- 7273 bedrooms
- 1,7664 bedrooms
- 1,6365+ bedrooms

- Bedrooms in renter-occupied apartments in Weddington, North Carolina
- 0no bedroom
- 451 bedroom
- 192 bedrooms
- 1263 bedrooms
- 694 bedrooms
- 245+ bedrooms

- Cars and other vehicles available in Weddington in owner-occupied houses/condos
- 12no vehicle
- 4051 vehicle
- 1,9942 vehicles
- 1,0763 vehicles
- 4764 vehicles
- 2015+ vehicles

- Cars and other vehicles available in Weddington in renter-occupied apartments
- 8no vehicle
- 1031 vehicle
- 792 vehicles
- 123 vehicles
- 824 vehicles
- 05+ vehicles

- Rooms in owner-occupied houses in Weddington, North Carolina
- 01 room
- 02 rooms
- 03 rooms
- 384 rooms
- 995 rooms
- 2146 rooms
- 2357 rooms
- 5278 rooms
- 3,0539+ rooms

- Rooms in renter-occupied apartments in Weddington, North Carolina
- 01 room
- 452 rooms
- 193 rooms
- 84 rooms
- 335 rooms
- 396 rooms
- 07 rooms
- 798 rooms
- 619+ rooms


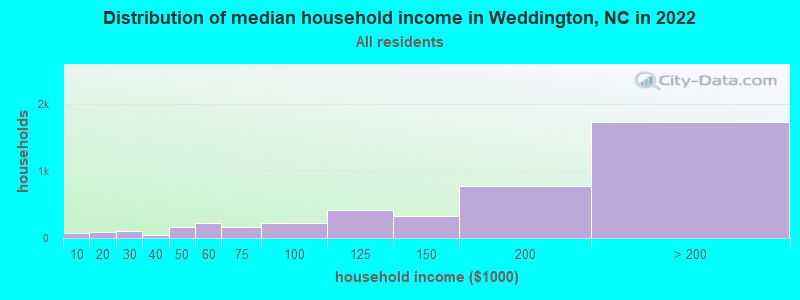
Weddington, NC household income distribution

- 72Less than $10,000
- 97$10,000 to $19,999
- 108$20,000 to $29,999
- 44$30,000 to $39,999
- 163$40,000 to $49,999
- 228$50,000 to $59,999
- 169$60,000 to $74,999
- 219$75,000 to $99,999
- 411$100,000 to $124,999
- 327$125,000 to $149,999
- 784$150,000 to $199,999
- 1,733$200,000 or more
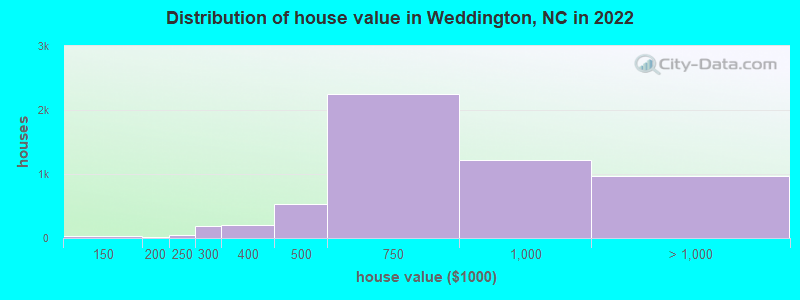
Home value of owner - occupied houses in 2022 in Weddington, NC
-
- 8Less than $10,000
- 8$90,000 to $99,999
- 6$100,000 to $124,999
- 20$125,000 to $149,999
- 15$150,000 to $174,999
- 41$200,000 to $249,999
- 193$250,000 to $299,999
- 205$300,000 to $399,999
- 525$400,000 to $499,999
- 2,246$500,000 to $749,999
- 1,216$750,000 to $999,999
- 344$1,000,000 to $1,499,999
- 482$1,500,000 to $1,999,999
- 141$2,000,000 or more
Rent paid by renters in 2022 in Weddington, NC
-
- 16$300 to $349
- 18$600 to $649
- 41$700 to $749
- 35$1,250 to $1,499
- 52$1,500 to $1,999
- 150$2,000 to $2,499
- 41$2,500 to $2,999
- 29$3,000 to $3,499


Percentage of workers working in this county: 49.1%
Number of people working at home: 1,794 (27.1% of all workers)
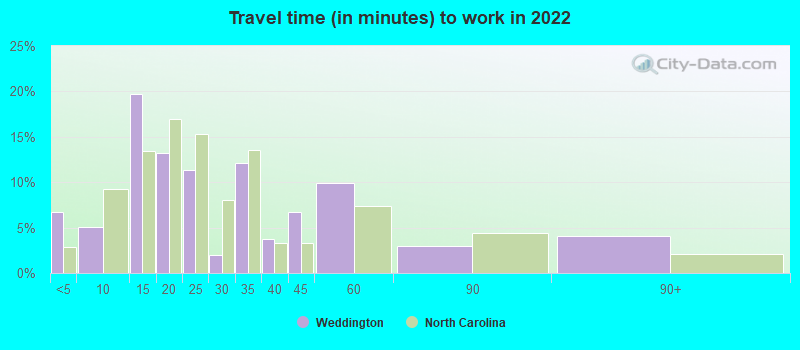
Travel time to work (commute)
- Less than 5 minutes: 146
- 5 to 9 minutes: 202
- 10 to 14 minutes: 441
- 15 to 19 minutes: 1,006
- 20 to 24 minutes: 762
- 25 to 29 minutes: 188
- 30 to 34 minutes: 948
- 35 to 39 minutes: 455
- 40 to 44 minutes: 196
- 45 to 59 minutes: 345
- 60 to 89 minutes: 208
- 90 or more minutes: 101
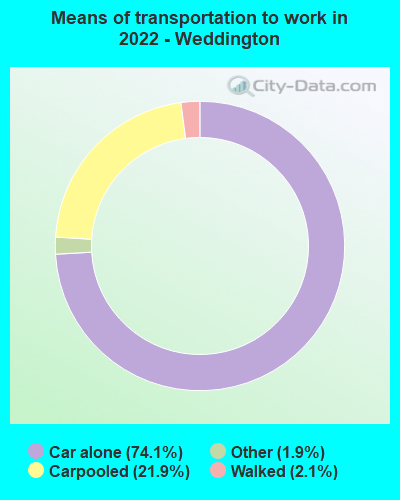
Means of transportation to work:
- Drove a car alone: 1,562 (42.7%)
- Carpooled: 483 (13.2%)
- Taxi: 41 (1.1%)
- Walked: 46 (1.3%)
- Worked at home: 1,944 (53.1%)

- Unemployment by race in 2022
- Unemployment rate for White non-Hispanic residents
- 1.5%Males
- 1.3%Females
- Unemployment rate for Asian residents
- 12.4%Females

- Year of entry for the foreign-born population in Weddington, North Carolina
- 2702010 or later
- 5692000 to 2009
- 5281990 to 1999
- 641980 to 1989
- 451970 to 1979
- 119Before 1970
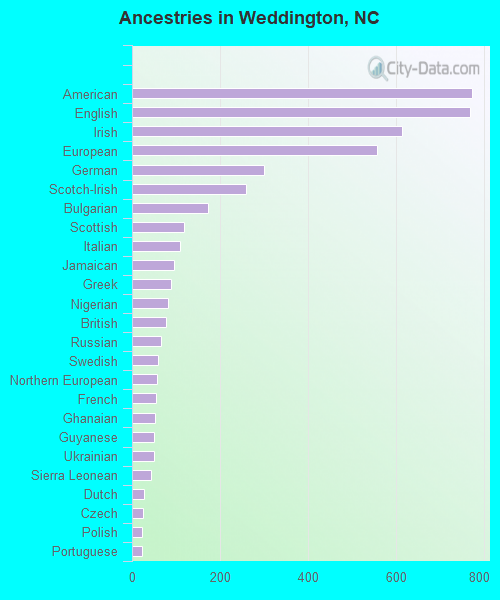
First ancestries reported:
- American: 773 (12.3%)
- English: 768 (12.2%)
- Irish: 613 (9.7%)
- European: 557 (8.8%)
- German: 299 (4.7%)
- Scotch-Irish: 259 (4.1%)
- Bulgarian: 173 (2.7%)
- Scottish: 118 (1.9%)
- Italian: 108 (1.7%)
- Jamaican: 96 (1.5%)
- Greek: 88 (1.4%)
- Nigerian: 81 (1.3%)
- British: 77 (1.2%)
- Russian: 67 (1.1%)
- Swedish: 60 (1.0%)
- Northern European: 57 (0.9%)
- French: 54 (0.9%)
- Ghanaian: 53 (0.8%)
- Guyanese: 51 (0.8%)
- Ukrainian: 50 (0.8%)
- Sierra Leonean: 44 (0.7%)
- Dutch: 27 (0.4%)
- Czech: 25 (0.4%)
- Polish: 23 (0.4%)
- Portuguese: 22 (0.3%)
- Canadian: 19 (0.3%)
- Norwegian: 14 (0.2%)
- Swiss: 13 (0.2%)
- Assyrian: 12 (0.2%)
- Scandinavian: 12 (0.2%)
- Welsh: 10 (0.2%)
- Slovak: 8 (0.1%)
- Hungarian: 4 (0.06%)
- Danish: 3 (0.05%)
Most common places of birth for foreign-born residents (%):
| Weddington: | 22.6% (458) |
| North Carolina: | 9.3% (80,594) |
| Weddington: | 15.6% (316) |
| North Carolina: | 2.1% (18,105) |
| Weddington: | 6.0% (121) |
| North Carolina: | 0.8% (6,645) |
| Weddington: | 5.9% (120) |
| North Carolina: | 1.1% (9,831) |
| Weddington: | 5.8% (118) |
| North Carolina: | 1.2% (10,140) |
| Weddington: | 5.2% (105) |
| North Carolina: | 1.3% (11,419) |
| Weddington: | 3.5% (72) |
| North Carolina: | 0.7% (6,091) |
| Weddington: | 3.4% (70) |
| North Carolina: | 0.9% (8,067) |
| Weddington: | 3.3% (68) |
| North Carolina: | 0.2% (1,485) |
| Weddington: | 3.3% (68) |
| North Carolina: | 24.7% (214,776) |
| Weddington: | 3.3% (67) |
| North Carolina: | 1.1% (9,173) |
| Weddington: | 3.1% (62) |
| North Carolina: | 0.5% (4,673) |
| Weddington: | 2.9% (59) |
| North Carolina: | 0.1% (1,135) |
| Weddington: | 2.5% (50) |
| North Carolina: | 0.3% (2,465) |
| Weddington: | 2.4% (49) |
| North Carolina: | 0.5% (4,233) |
| Weddington: | 2.0% (40) |
| North Carolina: | 0.1% (1,097) |
Place of birth for U.S.-born residents:
- This state: 4,920
- Other state: 6,329
- Northeast: 1,961
- Midwest: 1,365
- South: 2,082
- West: 884
88.4% of Weddington residents lived in the same house 1 years ago.
Out of people who lived in different houses, 17.7% lived in this county.
Out of people who lived in different counties, 67.7% lived in North Carolina.
| Weddington: | 88.4% |
| State average: | 87.3% |
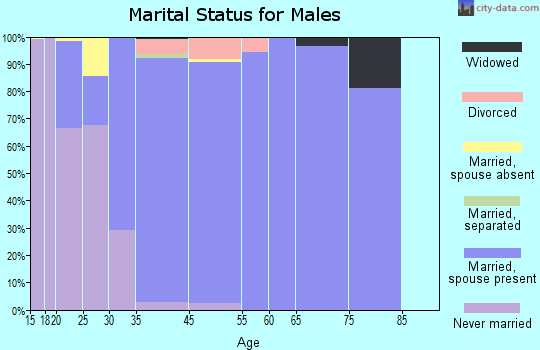
Education attainment for males 25 years and older:
- No schooling: 0
- Nursery to 4th grade: 0
- 5th and 6th grade: 0
- 7th and 8th grade: 39
- 9th grade: 22
- 10th grade: 30
- 11th grade: 0
- 12th grade, no diploma: 36
- High school graduate (or equivalency): 559
- Less than 1 year of college: 216
- Some college more than 1 year, no degree: 515
- Associate degree: 207
- Bachelor's degree: 1,675
- Master's degree: 859
- Professional school degree: 200
- Doctorate degree: 62

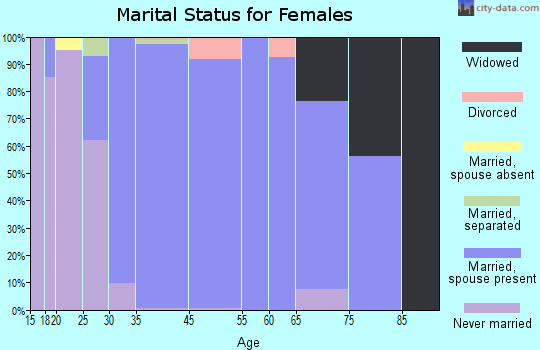
Education attainment for females 25 years and older:
- No schooling: 0
- Nursery to 4th grade: 0
- 5th and 6th grade: 0
- 7th and 8th grade: 43
- 9th grade: 0
- 10th grade: 17
- 11th grade: 0
- 12th grade, no diploma: 7
- High school graduate (or equivalency): 349
- Less than 1 year of college: 472
- Some college more than 1 year, no degree: 315
- Associate degree: 382
- Bachelor's degree: 1,761
- Master's degree: 896
- Professional school degree: 184
- Doctorate degree: 75

Housing units in structures:
- One, detached: 4,527
- One, attached: 30
- Two: 18
House/condo owner moved in on average 8 years ago
Renter moved in on average 1 years ago

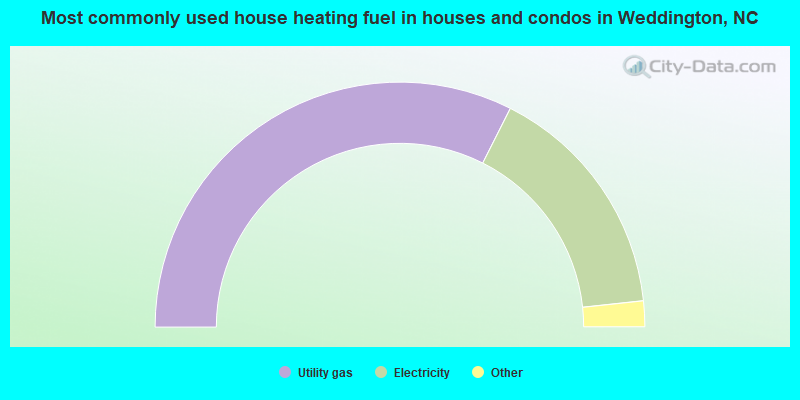
- 64.9%Utility gas
- 31.7%Electricity
- 2.3%Bottled, tank, or LP gas
- 0.8%No fuel used
- 0.2%Wood
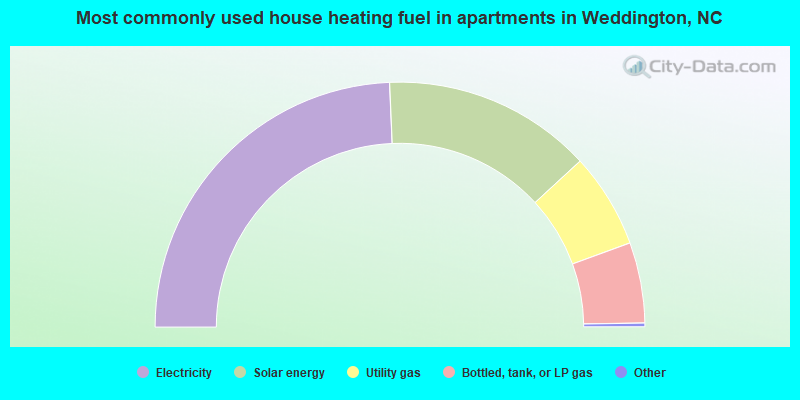
- 48.9%Electricity
- 27.8%Solar energy
- 12.6%Utility gas
- 10.7%Bottled, tank, or LP gas
Private vs. public school enrollment:
| Here: | 41.4% |
| North Carolina: | 13.8% |
| Here: | 16.6% |
| North Carolina: | 11.9% |
| Here: | 22.2% |
| North Carolina: | 19.3% |


