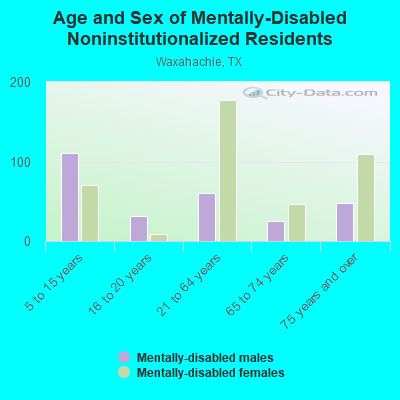
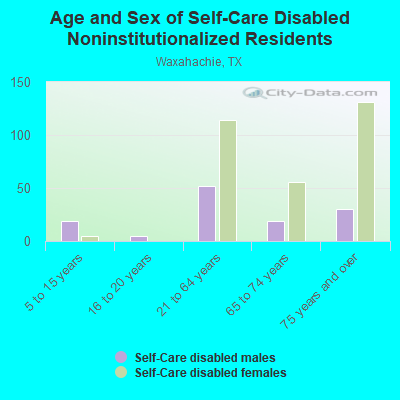
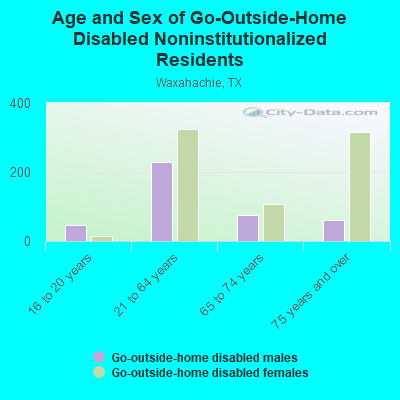
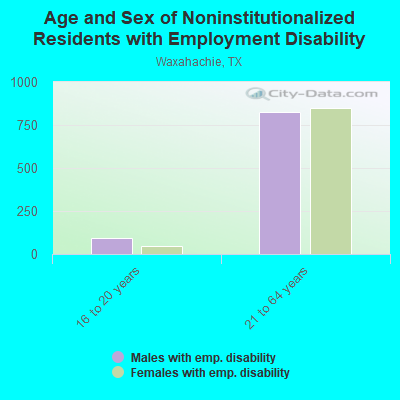
Waxahachie, TX (Texas) Houses and Residents
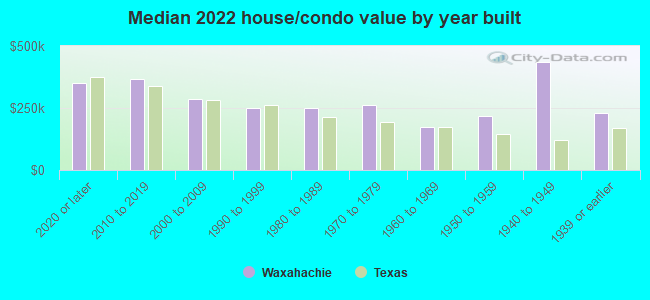
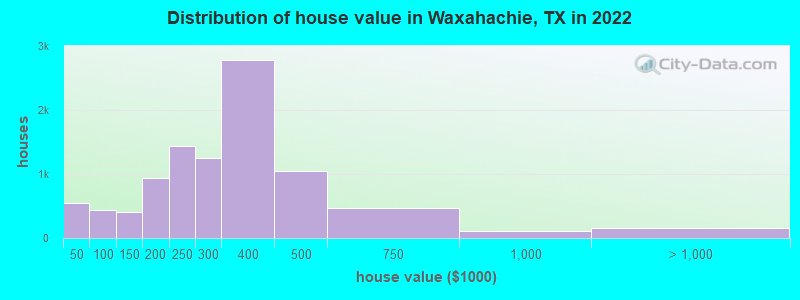
Estimated median house or condo value in 2022: $308,816 (it was $81,300 in 2000 )
Waxahachie:
$308,816Texas:
$275,400
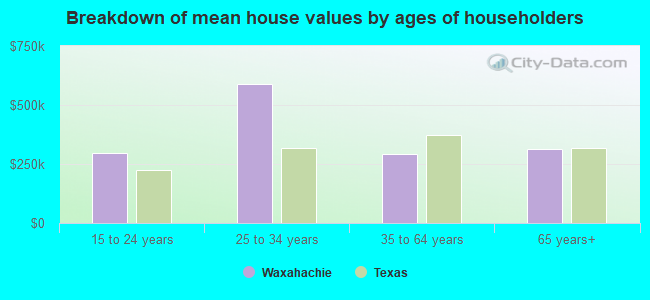
Lower value quartile - upper value quartile: $219,541 - $418,103Mean price in 2022: Detached houses: $269,565 Here:
$269,565State:
$369,058
Townhouses or other attached units: $299,714 Here:
$299,714State:
$327,631
Mobile homes: $47,019 Here:
$47,019State:
$124,413
Total population: 32,344 (Urban population: 19,810 (311 inside urbanized areas, 19,499 inside urban clusters ), Rural population: 1,558 (18 farm, 1,540 nonfarm ))
Houses: 16,729 (15,764 occupied: 9,694 owner occupied, 6,402 renter occupied )
% of renters here:
40%State:
38%
Housing density: 419 houses/condos per square mile
Median price asked for vacant for-sale houses and condos in 2022: $320,782.
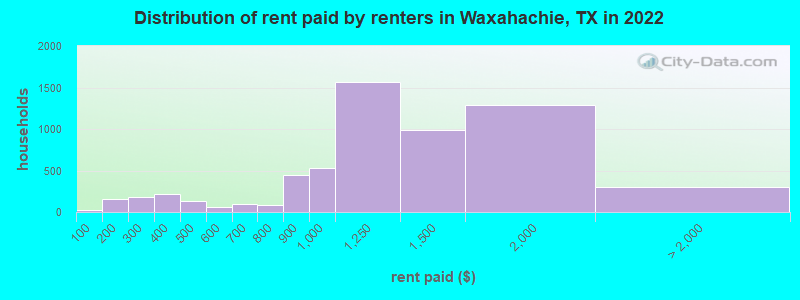
Median contract rent in 2022: $1,255 (lower quartile is $955, upper quartile is $1,694)
Median rent asked for vacant for-rent units in 2022: $2,684
Median gross rent in Waxahachie, TX in 2022: $1,492
Housing units in Waxahachie with a mortgage: 6,762 (69 second mortgage, 0 home equity loan, 21 both second mortgage and home equity loan )Houses without a mortgage: 50
Median household income for houses/condos with a mortgage: $111,027
Median household income for apartments without a mortgage: $71,749
Median monthly housing costs: $1,511
Data:
Median house or condo value ($)
Median house or condo value ($ change since 2000)
Median house or condo value ($) - White
Median house or condo value ($) - Black or African American
Median house or condo value ($) - Asian
Median house or condo value ($) - Hispanic or Latino
Median house or condo value ($) - American Indian and Alaska Native
Median house or condo value ($) - Multirace
Median house or condo value ($) - Other Race
Median price asked for mobile homes ($)
Household density (households per square mile)
Mean house or condo value by units in structure - 1, detached ($)
Mean house or condo value by units in structure - 1, attached ($)
Mean house or condo value by units in structure - 2 ($)
Mean house or condo value by units in structure by units in structure - 3 or 4 ($)
Mean house or condo value by units in structure - 5 or more ($)
Mean house or condo value by units in structure - Boat, RV, van, etc. ($)
Mean house or condo value by units in structure - Mobile home ($)
Median contract rent ($)
Median contract rent - Lower quartile ($)
Median contract rent - Upper quartile ($)
Median gross rent ($)
Urban houses (%)
Rural houses (%)
Houses occupied (%)
Houses occupied (% change since 2000)
Houses owner occupied (%)
Houses owner occupied (% change since 2000)
Houses renter occupied (%)
Houses renter occupied (% change since 2000)
Vacant housing units - For rent (%)
Vacant housing units - For rent (% change since 2000)
Vacant housing units - For sale only (%)
Vacant housing units - For sale only (% change since 2000)
Vacant housing units - Rented or sold, not occupied (%)
Vacant housing units - Rented or sold, not occupied (% change since 2000)
Vacant housing units - For seasonal, recreational, or occasional use (%)
Vacant housing units - For seasonal, recreational, or occasional use (% change since 2000)
Vacant housing units - For migrant workers (%)
Vacant housing units - For migrant workers (% change since 2000)
Vacant housing units - Other vacant (%)
Vacant housing units - Other vacant (% change since 2000)
Median monthly housing costs ($)
Median household income for houses/condos with a mortgage ($)
Median household income for houses/condos without a mortgage ($)
Median household income ($)
Median household income ($) - White
Median household income ($) - Black or African American
Median household income ($) - Asian
Median household income ($) - Hispanic or Latino
Median household income ($) - American Indian and Alaska Native
Median household income ($) - Multirace
Median household income ($) - Other Race
Mortgage status - with mortgage (%)
Mortgage status - with second mortgage (%)
Mortgage status - with home equity loan (%)
Mortgage status - with both second mortgage and home equity loan (%)
Mortgage status - without a mortgage (%)
Median year house/condo built
Median year apartment built
Household type by relationship - Male householder living alone (%)
Household type by relationship - Male householder not living alone (%)
Household type by relationship - Female householder living alone (%)
Household type by relationship - Female householder not living alone (%)
Household type by relationship - Opposite-Sex spouse (%)
Household type by relationship - Same-Sex spouse (%)
Household type by relationship - Opposite-Sex unmarried partner (%)
Household type by relationship - Same-Sex unmarried partner (%)
Household type by relationship - In group quarters (%)
Size of family households - 2-person household (%)
Size of family households - 3-person household (%)
Size of family households - 4-person household (%)
Size of family households - 5-person household (%)
Size of family households - 6-person household (%)
Size of family households - 7-or-more-person household (%)
Size of nonfamily households - 1-person household (%)
Size of nonfamily households - 2-person household (%)
Size of nonfamily households - 3-person household (%)
Size of nonfamily households - 4-person household (%)
Size of nonfamily households - 5-person household (%)
Size of nonfamily households - 6-person household (%)
Size of nonfamily households - 7-or-moreperson household (%)
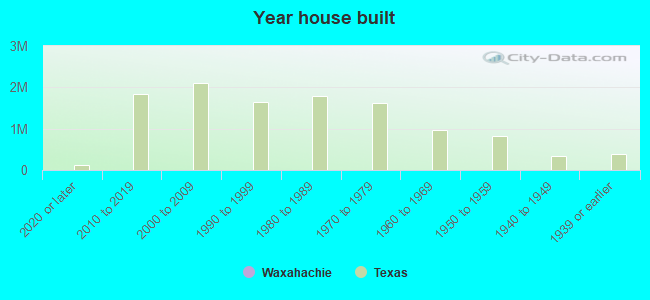
Year house built - Built 2010 or later (%)
Year house built - Built 2000 to 2009 (%)
Year house built - Built 1990 to 1999 (%)
Year house built - Built 1980 to 1989 (%)
Year house built - Built 1970 to 1979 (%)
Year house built - Built 1960 to 1969 (%)
Year house built - Built 1950 to 1959 (%)
Year house built - Built 1940 to 1949 (%)
Year house built - Built 1939 or earlier (%)
Median number of rooms in houses and condos
Median number of rooms in apartments
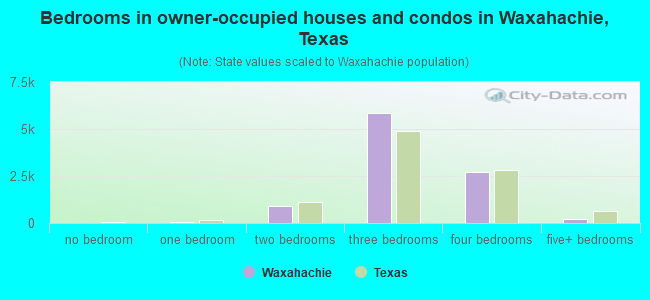
Median number of bedrooms in owner occupied houses
Mean number of bedrooms in owner occupied houses
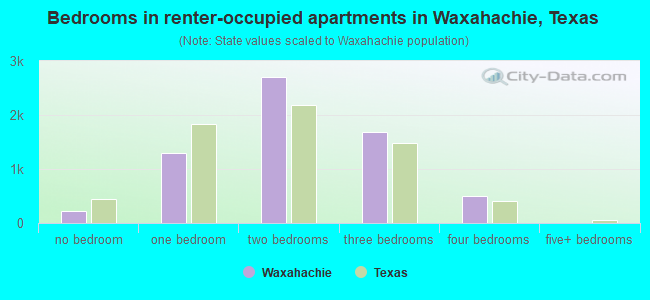
Median number of bedrooms in renter occupied houses
Mean number of bedrooms in renter occupied houses
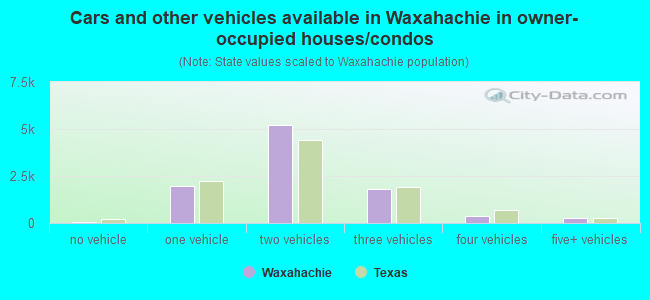
Median number of vehichles in owner occupied houses
Mean number of vehichles in owner occupied houses
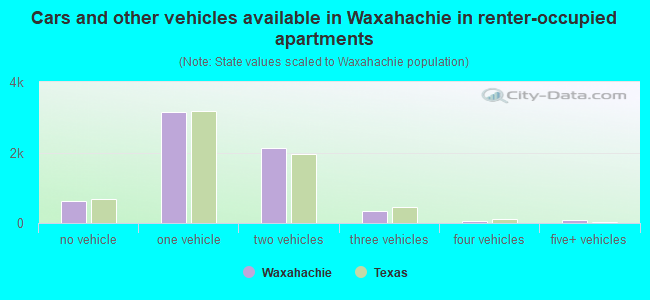
Median number of vehichles in renter occupied houses
Mean number of vehichles in renter occupied houses
Rooms in owner-occupied houses - 1 room (%)
Rooms in owner-occupied houses - 2 rooms (%)
Rooms in owner-occupied houses - 3 rooms (%)
Rooms in owner-occupied houses - 4 rooms (%)
Rooms in owner-occupied houses - 5 rooms (%)
Rooms in owner-occupied houses - 6 rooms (%)
Rooms in owner-occupied houses - 7 rooms (%)
Rooms in owner-occupied houses - 8 rooms (%)
Rooms in owner-occupied houses - 9+ rooms (%)
Rooms in renter-occupied houses - 1 room (%)
Rooms in renter-occupied houses - 2 rooms (%)
Rooms in renter-occupied houses - 3 rooms (%)
Rooms in renter-occupied houses - 4 rooms (%)
Rooms in renter-occupied houses - 5 rooms (%)
Rooms in renter-occupied houses - 6 rooms (%)
Rooms in renter-occupied houses - 7 rooms (%)
Rooms in renter-occupied houses - 8 rooms (%)
Rooms in renter-occupied houses - 9+ rooms (%)
Bedrooms in owner-occupied houses - no bedrooms (%)
Bedrooms in owner-occupied houses - 1 bedroom (%)
Bedrooms in owner-occupied houses - 2 bedrooms (%)
Bedrooms in owner-occupied houses - 3 bedrooms (%)
Bedrooms in owner-occupied houses - 4 bedrooms (%)
Bedrooms in owner-occupied houses - 5+ bedrooms (%)
Bedrooms in renter-occupied houses - no bedrooms (%)
Bedrooms in renter-occupied houses - 1 bedroom (%)
Bedrooms in renter-occupied houses - 2 bedrooms (%)
Bedrooms in renter-occupied houses - 3 bedrooms (%)
Bedrooms in renter-occupied houses - 4 bedrooms (%)
Bedrooms in renter-occupied houses - 5+ bedrooms (%)
Vehicles available in owner-occupied houses - no vehicle available (%)
Vehicles available in owner-occupied houses - 1 vehicle available(%)
Vehicles available in owner-occupied houses - 2 Vehicles available (%)
Vehicles available in owner-occupied houses - 3 Vehicles available (%)
Vehicles available in owner-occupied houses - 4 Vehicles available (%)
Vehicles available in owner-occupied houses - 5+ Vehicles available (%)
Vehicles available in renter-occupied houses - no vehicle available (%)
Vehicles available in renter-occupied houses - 1 vehicle available (%)
Vehicles available in renter-occupied houses - 2 Vehicles available (%)
Vehicles available in renter-occupied houses - 3 Vehicles available (%)
Vehicles available in renter-occupied houses - 4 Vehicles available (%)
Vehicles available in renter-occupied houses - 5+ Vehicles available (%)
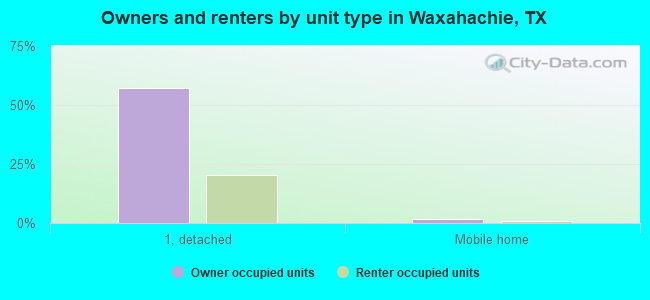
Housing units in structures - 1, detached (%)
Housing units in structures - 1, attached (%)
Housing units in structures - 2 (%)
Housing units in structures - 3 or 4 (%)
Housing units in structures - 5 to 9 (%)
Housing units in structures - 10 to 19 (%)
Housing units in structures - 20 to 49 (%)
Housing units in structures - 50 or more (%)
Housing units in structures - Mobile home (%)
Housing units in structures - Boat, RV, van, etc. (%)
Housing units in structures - Owners - 1, detached (%)
Housing units in structures - Owners - 1, attached (%)
Housing units in structures - Owners - 2 (%)
Housing units in structures - Owners - 3 or 4 (%)
Housing units in structures - Owners - 5 to 9 (%)
Housing units in structures - Owners - 10 to 19 (%)
Housing units in structures - Owners - 20 to 49 (%)
Housing units in structures - Owners - 50 or more (%)
Housing units in structures - Owners - Mobile home (%)
Housing units in structures - Owners - Boat, RV, van, etc. (%)
Housing units in structures - Renters - 1, detached (%)
Housing units in structures - Renters - 1, attached (%)
Housing units in structures - Renters - 2 (%)
Housing units in structures - Renters - 3 or 4 (%)
Housing units in structures - Renters - 5 to 9 (%)
Housing units in structures - Renters - 10 to 19 (%)
Housing units in structures - Renters - 20 to 49 (%)
Housing units in structures - Renters - 50 or more (%)
Housing units in structures - Renters - Mobile home (%)
Housing units in structures - Renters - Boat, RV, van, etc. (%)
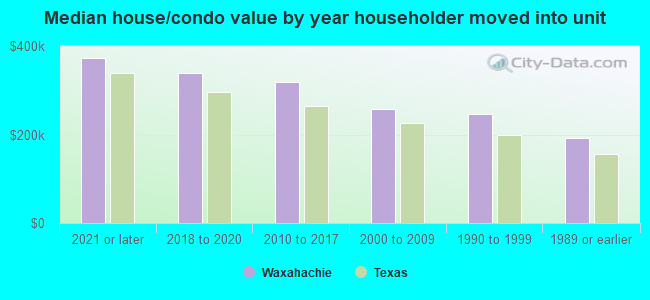
House/condo owner moved in on average (years ago)
Renter moved in on average (years ago)
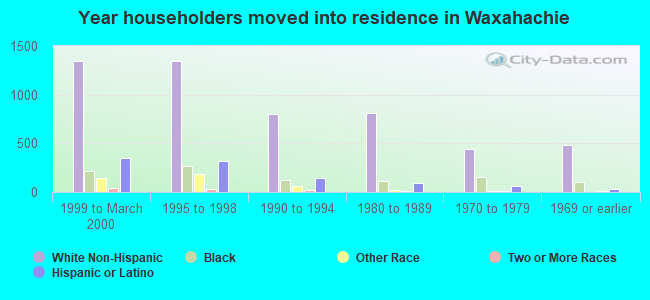
Year householder moved into unit - Moved in 1999 to March 2000 (%)
Year householder moved into unit - Moved in 1999 to March 2000 (%) - White
Year householder moved into unit - Moved in 1999 to March 2000 (%) - Black or African American
Year householder moved into unit - Moved in 1999 to March 2000 (%) - Asian
Year householder moved into unit - Moved in 1999 to March 2000 (%) - Hispanic or Latino
Year householder moved into unit - Moved in 1999 to March 2000 (%) - American Indian and Alaska Native
Year householder moved into unit - Moved in 1999 to March 2000 (%) - Multirace
Year householder moved into unit - Moved in 1999 to March 2000 (%) - Other Race
Year householder moved into unit - Moved in 1995 to 1998 (%)
Year householder moved into unit - Moved in 1995 to 1998 (%) - White
Year householder moved into unit - Moved in 1995 to 1998 (%) - Black or African American
Year householder moved into unit - Moved in 1995 to 1998 (%) - Asian
Year householder moved into unit - Moved in 1995 to 1998 (%) - Hispanic or Latino
Year householder moved into unit - Moved in 1995 to 1998 (%) - American Indian and Alaska Native
Year householder moved into unit - Moved in 1995 to 1998 (%) - Multirace
Year householder moved into unit - Moved in 1995 to 1998 (%) - Other Race
Year householder moved into unit - Moved in 1990 to 1994 (%)
Year householder moved into unit - Moved in 1990 to 1994 (%) - White
Year householder moved into unit - Moved in 1990 to 1994 (%) - Black or African American
Year householder moved into unit - Moved in 1990 to 1994 (%) - Asian
Year householder moved into unit - Moved in 1990 to 1994 (%) - Hispanic or Latino
Year householder moved into unit - Moved in 1990 to 1994 (%) - American Indian and Alaska Native
Year householder moved into unit - Moved in 1990 to 1994 (%) - Multirace
Year householder moved into unit - Moved in 1990 to 1994 (%) - Other Race
Year householder moved into unit - Moved in 1980 to 1989 (%)
Year householder moved into unit - Moved in 1980 to 1989 (%) - White
Year householder moved into unit - Moved in 1980 to 1989 (%) - Black or African American
Year householder moved into unit - Moved in 1980 to 1989 (%) - Asian
Year householder moved into unit - Moved in 1980 to 1989 (%) - Hispanic or Latino
Year householder moved into unit - Moved in 1980 to 1989 (%) - American Indian and Alaska Native
Year householder moved into unit - Moved in 1980 to 1989 (%) - Multirace
Year householder moved into unit - Moved in 1980 to 1989 (%) - Other Race
Year householder moved into unit - Moved in 1970 to 1979 (%)
Year householder moved into unit - Moved in 1970 to 1979 (%) - White
Year householder moved into unit - Moved in 1970 to 1979 (%) - Black or African American
Year householder moved into unit - Moved in 1970 to 1979 (%) - Asian
Year householder moved into unit - Moved in 1970 to 1979 (%) - Hispanic or Latino
Year householder moved into unit - Moved in 1970 to 1979 (%) - American Indian and Alaska Native
Year householder moved into unit - Moved in 1970 to 1979 (%) - Multirace
Year householder moved into unit - Moved in 1970 to 1979 (%) - Other Race
Year householder moved into unit - Moved in 1969 or earlier (%)
Year householder moved into unit - Moved in 1969 or earlier (%) - White
Year householder moved into unit - Moved in 1969 or earlier (%) - Black or African American
Year householder moved into unit - Moved in 1969 or earlier (%) - Asian
Year householder moved into unit - Moved in 1969 or earlier (%) - Hispanic or Latino
Year householder moved into unit - Moved in 1969 or earlier (%) - American Indian and Alaska Native
Year householder moved into unit - Moved in 1969 or earlier (%) - Multirace
Year householder moved into unit - Moved in 1969 or earlier (%) - Other Race
Housing units lacking complete plumbing facilities (%)
Housing units lacking complete kitchen facilities (%)
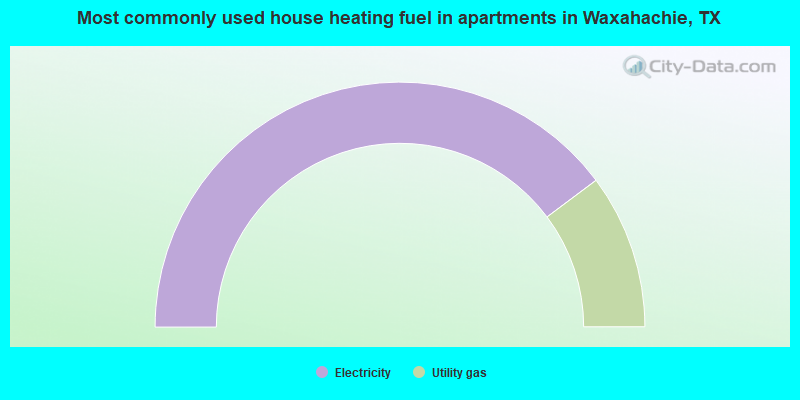
House heating fuel used in houses and condos - Utility gas (%)
House heating fuel used in houses and condos - Bottled, tank, or LP gas (%)
House heating fuel used in houses and condos - Electricity (%)
House heating fuel used in houses and condos - Fuel oil, kerosene, etc. (%)
House heating fuel used in houses and condos - Coal or coke (%)
House heating fuel used in houses and condos - Wood (%)
House heating fuel used in houses and condos - Solar energy (%)
House heating fuel used in houses and condos - Other fuel (%)
House heating fuel used in houses and condos - No fuel used (%)
House heating fuel used in apartments - Utility gas (%)
House heating fuel used in apartments - Bottled, tank, or LP gas (%)
House heating fuel used in apartments - Electricity (%)
House heating fuel used in apartments - Fuel oil, kerosene, etc. (%)
House heating fuel used in apartments - Coal or coke (%)
House heating fuel used in apartments - Wood (%)
House heating fuel used in apartments - Solar energy (%)
House heating fuel used in apartments - Other fuel (%)
House heating fuel used in apartments - No fuel used (%)
Latest news about housing in Waxahachie, TX collected exclusively by city-data.com from local newspapers, TV, and radio stations
Median year house/condo built: 2006Median year apartment built: 2004Household type by relationship:
Households: 45,365
Male householders: 7,523 (1,894 living alone ), Female householders: 8,147 (1,933 living alone )8,076 spouses (8,028 opposite-sex spouses ), 1,106 unmarried partners , (1,069 opposite-sex unmarried partners ), 15,310 children (13,921 natural , 489 adopted , 898 stepchildren ), 1,150 grandchildren , 555 brothers or sisters , 590 parents , 0 foster children , 669 other relatives , 779 non-relatives In group quarters: 1,456
Size of family households: 4,817 2-persons , 2,167 3-persons , 3,191 4-persons , 981 5-persons , 405 6-persons , 211 7-or-more-persons .
Size of nonfamily households: 3,537 1-person , 574 2-persons , 78 3-persons , 38 4-persons .
6,598 married couples with children. single-parent households (855 men , 2,847 women ).
84.6% of residents of Waxahachie speak English at home. of residents speak Spanish at home (74% speak English very well , 12% speak English well , 13% speak English not well , 2% don't speak English at all ).of residents speak other Indo-European language at home (92% speak English very well , 5% speak English well , 3% speak English not well ).of residents speak Asian or Pacific Island language at home (46% speak English very well , 34% speak English well , 20% speak English not well ).of residents speak other language at home (46% speak English very well , 54% speak English well ).
Foreign born population: 2,484 (5.5%)of them are naturalized citizens )
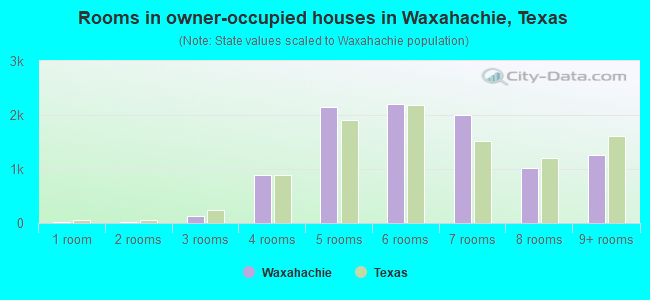
Median number of rooms in houses and condos:
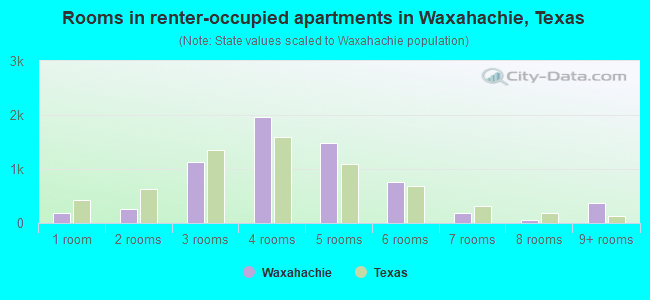
Median number of rooms in apartments
Owner-occupied Renter-occupied
Rooms in owner-occupied houses in Waxahachie, Texas
22 1 room 18 2 rooms 127 3 rooms 892 4 rooms 2,147 5 rooms 2,207 6 rooms 2,002 7 rooms 1,013 8 rooms 1,265 9+ rooms
Rooms in renter-occupied apartments in Waxahachie, Texas
187 1 room 268 2 rooms 1,127 3 rooms 1,968 4 rooms 1,477 5 rooms 757 6 rooms 194 7 rooms 58 8 rooms 367 9+ rooms
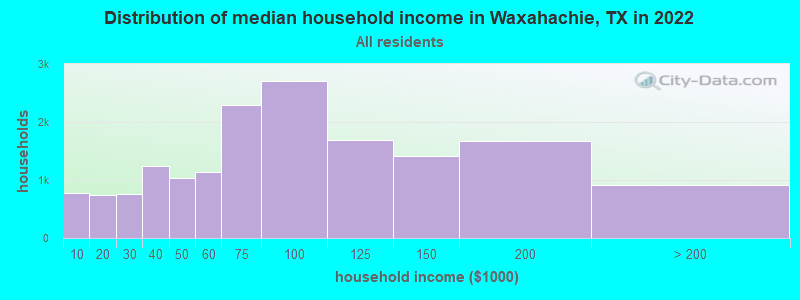
Waxahachie, TX household income distribution 773 Less than $10,000740 $10,000 to $19,999753 $20,000 to $29,9991,241 $30,000 to $39,9991,031 $40,000 to $49,9991,136 $50,000 to $59,9992,290 $60,000 to $74,9992,699 $75,000 to $99,9991,697 $100,000 to $124,9991,406 $125,000 to $149,9991,665 $150,000 to $199,999919 $200,000 or more
Home value of owner - occupied houses in 2022 in Waxahachie, TX 209 Less than $10,000148 $10,000 to $14,9997 $15,000 to $19,99980 $20,000 to $24,99926 $25,000 to $29,99942 $30,000 to $34,99926 $40,000 to $49,99926 $50,000 to $59,99979 $60,000 to $69,99998 $70,000 to $79,99957 $80,000 to $89,999142 $90,000 to $99,999316 $100,000 to $124,99991 $125,000 to $149,999253 $150,000 to $174,999676 $175,000 to $199,9991,434 $200,000 to $249,9991,256 $250,000 to $299,9992,787 $300,000 to $399,9991,048 $400,000 to $499,999460 $500,000 to $749,999104 $750,000 to $999,99985 $1,000,000 to $1,499,99964 $2,000,000 or moreRent paid by renters in 2022 in Waxahachie, TX 26 Less than $10010 $100 to $149142 $150 to $199159 $200 to $24920 $250 to $29999 $300 to $349118 $350 to $399105 $400 to $44922 $450 to $49927 $500 to $54938 $550 to $59962 $600 to $64936 $650 to $69925 $700 to $74959 $750 to $799443 $800 to $899524 $900 to $9991,568 $1,000 to $1,249983 $1,250 to $1,4991,290 $1,500 to $1,999232 $2,000 to $2,49930 $2,500 to $2,99943 No cash rent
Percentage of workers working in this county: 64.2%Number of people working at home: 1,774 (8.0% of all workers )
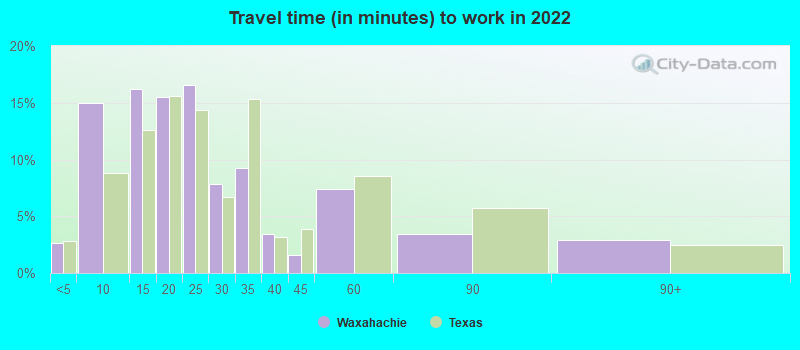
Travel time to work (commute)
Less than 5 minutes: 5965 to 9 minutes: 3,22810 to 14 minutes: 3,18115 to 19 minutes: 2,34720 to 24 minutes: 1,70425 to 29 minutes: 1,42230 to 34 minutes: 2,27535 to 39 minutes: 68040 to 44 minutes: 1,01445 to 59 minutes: 2,30960 to 89 minutes: 1,25490 or more minutes: 487
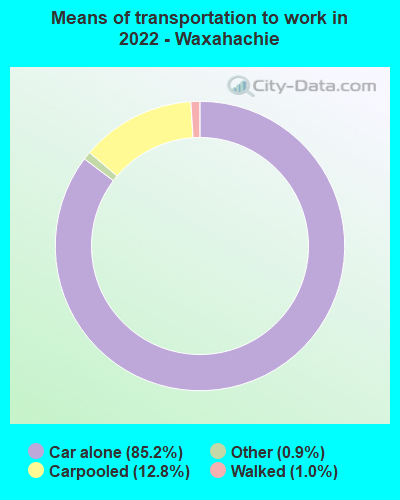
Means of transportation to work:
Drove a car alone: 18,725 (76.3%)Carpooled: 3,051 (12.4%)Ferryboat: 3 (0.0%)Taxi: 249 (1.0%)Bicycle: 21 (0.1%)Walked: 243 (1.0%)Worked at home: 1,774 (7.2%)
Unemployment by race in 2022
Unemployment rate for White non-Hispanic residents 6.6% Males2.1% FemalesUnemployment rate for Black residents 1.8% Males3.1% FemalesUnemployment rate for American Indian and Alaska Native residents 33.7% FemalesUnemployment rate for Asian residents 8.6% FemalesUnemployment rate for other race residents 2.9% Males1.2% FemalesUnemployment rate for two or more race residents 0.5% Males0.5% FemalesUnemployment rate for Hispanic or Latino residents 1.3% Males3.4% Females
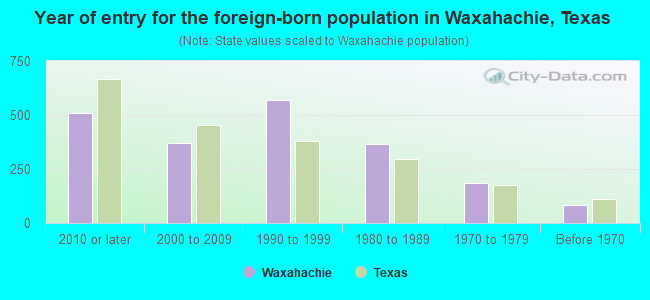
Year of entry for the foreign-born population in Waxahachie, Texas
507 2010 or later 372 2000 to 2009 568 1990 to 1999 368 1980 to 1989 186 1970 to 1979 85 Before 1970
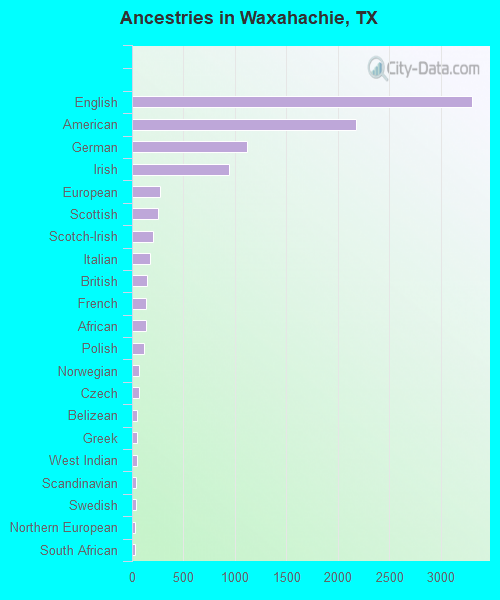
First ancestries reported:
English: 3,306 (15.0%)
American: 2,177 (9.9%)
German: 1,114 (5.1%)
Irish: 948 (4.3%)
European: 275 (1.2%)
Scottish: 254 (1.2%)
Scotch-Irish: 201 (0.9%)
Italian: 171 (0.8%)
British: 144 (0.7%)
French: 134 (0.6%)
African: 133 (0.6%)
Polish: 112 (0.5%)
Norwegian: 70 (0.3%)
Czech: 65 (0.3%)
Belizean: 51 (0.2%)
Greek: 49 (0.2%)
West Indian: 48 (0.2%)
Scandinavian: 41 (0.2%)
Swedish: 39 (0.2%)
Northern European: 32 (0.1%)
South African: 31 (0.1%)
Haitian: 28 (0.1%)
British West Indian: 18 (0.08%)
Lebanese: 15 (0.07%)
Dutch: 12 (0.05%)
Eastern European: 12 (0.05%)
Brazilian: 11 (0.05%)
Portuguese: 11 (0.05%)
Danish: 10 (0.05%)
Hungarian: 10 (0.05%)
Arab: 8 (0.04%)
Russian: 8 (0.04%)
French Canadian: 3 (0.01%) Most common places of birth for foreign-born residents (%): Mexico Waxahachie:
58.9% (1,177)Texas:
48.4% (2,411,723)
Cambodia Waxahachie:
4.5% (89)Texas:
0.2% (9,997)
Cuba Waxahachie:
4.0% (79)Texas:
1.3% (62,978)
Philippines Waxahachie:
3.4% (68)Texas:
2.1% (103,148)
India Waxahachie:
3.2% (64)Texas:
6.1% (306,347)
Germany Waxahachie:
2.9% (57)Texas:
0.8% (37,989)
Belize Waxahachie:
2.1% (43)Texas:
0.1% (4,295)
Greece Waxahachie:
2.1% (42)Texas:
0.1% (3,811)
Thailand Waxahachie:
1.9% (38)Texas:
0.3% (15,368)
Trinidad and Tobago Waxahachie:
1.8% (35)Texas:
0.2% (9,664)
El Salvador Waxahachie:
1.7% (34)Texas:
4.5% (224,455)
Place of birth for U.S.-born residents:
This state: 31,872Other state: 10,336Northeast: 1,100Midwest: 2,158South: 3,742West: 3,376 83.2% of Waxahachie residents lived in the same house 1 years ago.
Out of people who lived in different houses, 32.4% lived in this county.
Out of people who lived in different counties, 77.5% lived in Texas.
Waxahachie:
83.2%State average:
85.7%
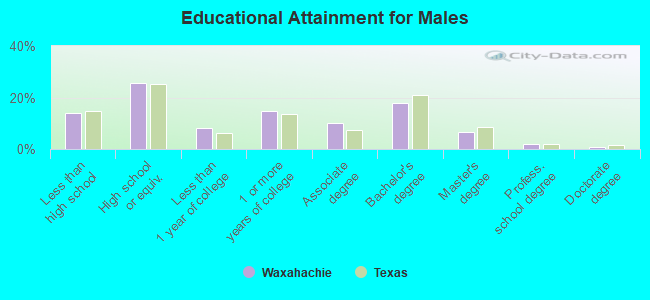
Education attainment for males 25 years and older:
No schooling: 1,061Nursery to 4th grade: 625th and 6th grade: 347th and 8th grade: 349th grade: 18910th grade: 17311th grade: 17012th grade, no diploma: 196High school graduate (or equivalency): 3,500Less than 1 year of college: 1,132Some college more than 1 year, no degree: 2,053Associate degree: 1,410Bachelor's degree: 2,427Master's degree: 880Professional school degree: 291Doctorate degree: 116
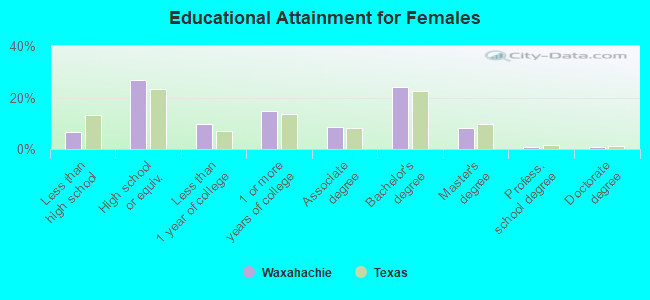
Education attainment for females 25 years and older:
No schooling: 358Nursery to 4th grade: 805th and 6th grade: 1027th and 8th grade: 419th grade: 13810th grade: 3711th grade: 15112th grade, no diploma: 86High school graduate (or equivalency): 3,891Less than 1 year of college: 1,408Some college more than 1 year, no degree: 2,131Associate degree: 1,226Bachelor's degree: 3,522Master's degree: 1,203Professional school degree: 108Doctorate degree: 138
Housing units in structures:
One, detached: 12,251One, attached: 502Two: 2053 or 4: 2355 to 9: 81410 to 19: 81420 to 49: 69550 or more: 821Mobile homes: 389Median worth of mobile homes: $21,553
Housing units lacking complete plumbing facilities in 2022: 1.6%Housing units lacking complete kitchen facilities in 2022: 2.9%House/condo owner moved in on average 6 years ago
Renter moved in on average 2 years ago
Private vs. public school enrollment:
Students in private schools in grades 1 to 8 (elementary and middle school): 264 Students in private schools in grades 9 to 12 (high school): 247 Students in private undergraduate colleges: 1,318