Uniondale, NY (New York) Houses and Residents
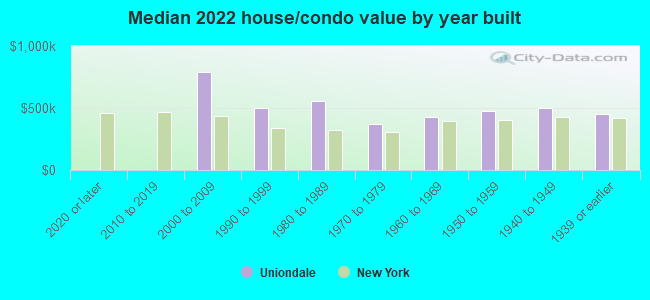
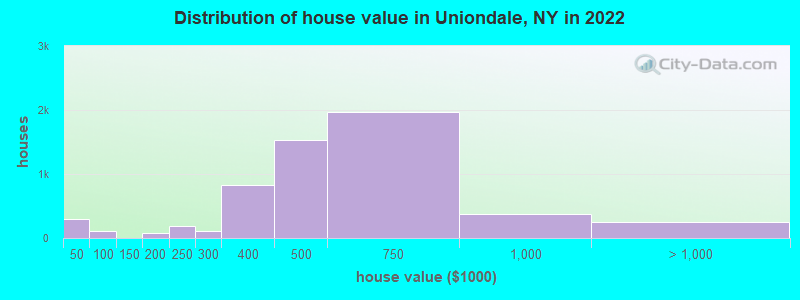
Estimated median house or condo value in 2022: $482,842 (it was $167,400 in 2000 )
Uniondale:
$482,842New York:
$400,400
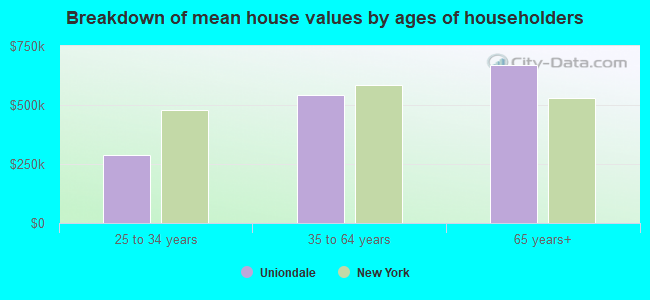
Lower value quartile - upper value quartile: $407,011 - $639,235Mean price in 2022: Detached houses: $452,643 Here:
$452,643State:
$476,719
Townhouses or other attached units: $753,014 Here:
$753,014State:
$699,270
In 2-unit structures: $271,651 Here:
$271,651State:
$713,077
In 5-or-more-unit structures: $1,027,190 Here:
$1,027,190State:
$912,009
Mobile homes: $282,035 Here:
$282,035State:
$88,925
Total population: 24,759 (Urban population: 23,011, Rural population: 0)
Houses: 9,216 (8,737 occupied: 6,291 owner occupied, 2,431 renter occupied )
% of renters here:
28%State:
46%
Housing density: 3,475 houses/condos per square mile
Median price asked for vacant for-sale houses and condos in 2022: $367,136.
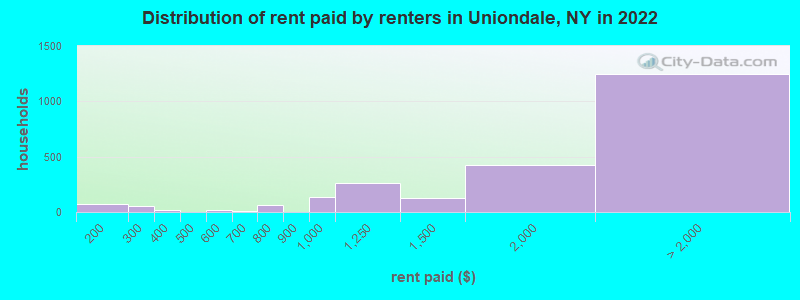
Median contract rent in 2022: over $2,000 (lower quartile is $1,264, upper quartile is over $2,000)
Median rent asked for vacant for-rent units in 2022: $4,883
Median gross rent in Uniondale, NY in 2022: over $2,000
Housing units in Uniondale with a mortgage: 4,418 (247 second mortgage, 0 home equity loan, 186 both second mortgage and home equity loan )Houses without a mortgage: 95
Median household income for houses/condos with a mortgage: $122,334
Median household income for apartments without a mortgage: $116,910
Median monthly housing costs: $2,399
Data:
Median house or condo value ($)
Median house or condo value ($ change since 2000)
Median house or condo value ($) - White
Median house or condo value ($) - Black or African American
Median house or condo value ($) - Asian
Median house or condo value ($) - Hispanic or Latino
Median house or condo value ($) - American Indian and Alaska Native
Median house or condo value ($) - Multirace
Median house or condo value ($) - Other Race
Median price asked for mobile homes ($)
Household density (households per square mile)
Mean house or condo value by units in structure - 1, detached ($)
Mean house or condo value by units in structure - 1, attached ($)
Mean house or condo value by units in structure - 2 ($)
Mean house or condo value by units in structure by units in structure - 3 or 4 ($)
Mean house or condo value by units in structure - 5 or more ($)
Mean house or condo value by units in structure - Boat, RV, van, etc. ($)
Mean house or condo value by units in structure - Mobile home ($)
Median contract rent ($)
Median contract rent - Lower quartile ($)
Median contract rent - Upper quartile ($)
Median gross rent ($)
Urban houses (%)
Rural houses (%)
Houses occupied (%)
Houses occupied (% change since 2000)
Houses owner occupied (%)
Houses owner occupied (% change since 2000)
Houses renter occupied (%)
Houses renter occupied (% change since 2000)
Vacant housing units - For rent (%)
Vacant housing units - For rent (% change since 2000)
Vacant housing units - For sale only (%)
Vacant housing units - For sale only (% change since 2000)
Vacant housing units - Rented or sold, not occupied (%)
Vacant housing units - Rented or sold, not occupied (% change since 2000)
Vacant housing units - For seasonal, recreational, or occasional use (%)
Vacant housing units - For seasonal, recreational, or occasional use (% change since 2000)
Vacant housing units - For migrant workers (%)
Vacant housing units - For migrant workers (% change since 2000)
Vacant housing units - Other vacant (%)
Vacant housing units - Other vacant (% change since 2000)
Median monthly housing costs ($)
Median household income for houses/condos with a mortgage ($)
Median household income for houses/condos without a mortgage ($)
Median household income ($)
Median household income ($) - White
Median household income ($) - Black or African American
Median household income ($) - Asian
Median household income ($) - Hispanic or Latino
Median household income ($) - American Indian and Alaska Native
Median household income ($) - Multirace
Median household income ($) - Other Race
Mortgage status - with mortgage (%)
Mortgage status - with second mortgage (%)
Mortgage status - with home equity loan (%)
Mortgage status - with both second mortgage and home equity loan (%)
Mortgage status - without a mortgage (%)
Median year house/condo built
Median year apartment built
Household type by relationship - Male householder living alone (%)
Household type by relationship - Male householder not living alone (%)
Household type by relationship - Female householder living alone (%)
Household type by relationship - Female householder not living alone (%)
Household type by relationship - Opposite-Sex spouse (%)
Household type by relationship - Same-Sex spouse (%)
Household type by relationship - Opposite-Sex unmarried partner (%)
Household type by relationship - Same-Sex unmarried partner (%)
Household type by relationship - In group quarters (%)
Size of family households - 2-person household (%)
Size of family households - 3-person household (%)
Size of family households - 4-person household (%)
Size of family households - 5-person household (%)
Size of family households - 6-person household (%)
Size of family households - 7-or-more-person household (%)
Size of nonfamily households - 1-person household (%)
Size of nonfamily households - 2-person household (%)
Size of nonfamily households - 3-person household (%)
Size of nonfamily households - 4-person household (%)
Size of nonfamily households - 5-person household (%)
Size of nonfamily households - 6-person household (%)
Size of nonfamily households - 7-or-moreperson household (%)
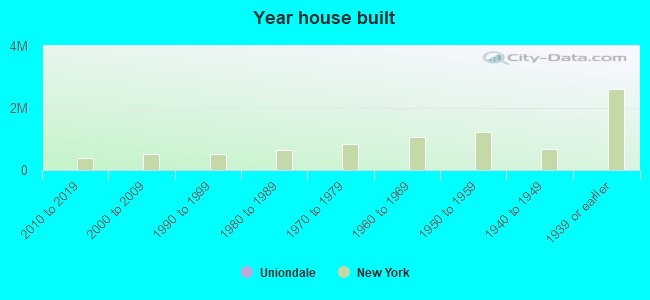
Year house built - Built 2010 or later (%)
Year house built - Built 2000 to 2009 (%)
Year house built - Built 1990 to 1999 (%)
Year house built - Built 1980 to 1989 (%)
Year house built - Built 1970 to 1979 (%)
Year house built - Built 1960 to 1969 (%)
Year house built - Built 1950 to 1959 (%)
Year house built - Built 1940 to 1949 (%)
Year house built - Built 1939 or earlier (%)
Median number of rooms in houses and condos
Median number of rooms in apartments
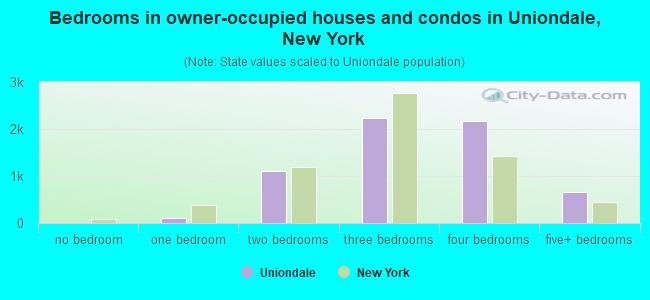
Median number of bedrooms in owner occupied houses
Mean number of bedrooms in owner occupied houses
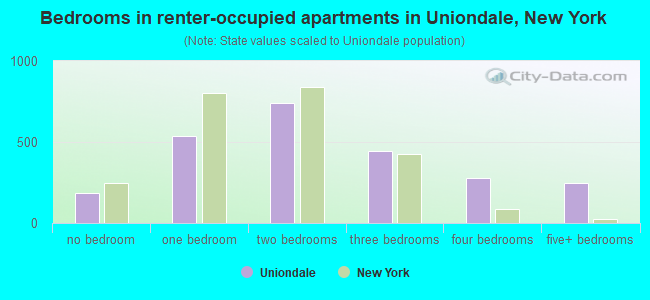
Median number of bedrooms in renter occupied houses
Mean number of bedrooms in renter occupied houses
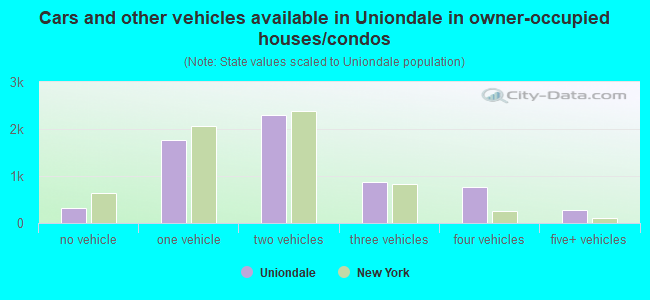
Median number of vehichles in owner occupied houses
Mean number of vehichles in owner occupied houses
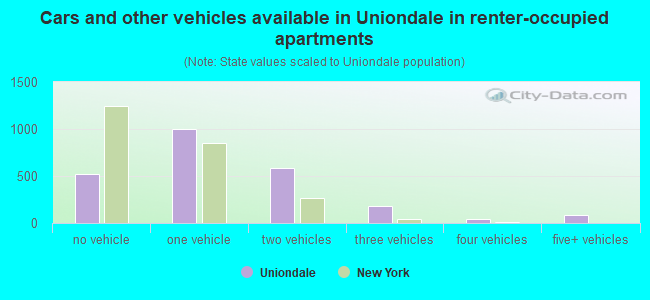
Median number of vehichles in renter occupied houses
Mean number of vehichles in renter occupied houses
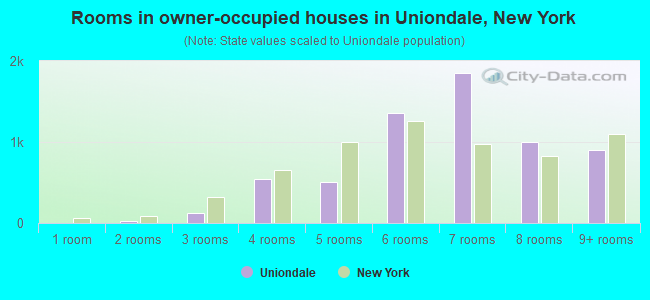
Rooms in owner-occupied houses - 1 room (%)
Rooms in owner-occupied houses - 2 rooms (%)
Rooms in owner-occupied houses - 3 rooms (%)
Rooms in owner-occupied houses - 4 rooms (%)
Rooms in owner-occupied houses - 5 rooms (%)
Rooms in owner-occupied houses - 6 rooms (%)
Rooms in owner-occupied houses - 7 rooms (%)
Rooms in owner-occupied houses - 8 rooms (%)
Rooms in owner-occupied houses - 9+ rooms (%)
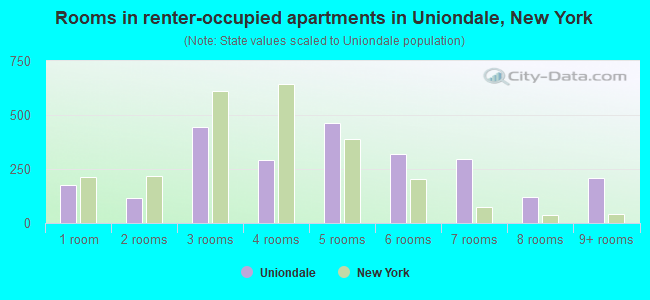
Rooms in renter-occupied houses - 1 room (%)
Rooms in renter-occupied houses - 2 rooms (%)
Rooms in renter-occupied houses - 3 rooms (%)
Rooms in renter-occupied houses - 4 rooms (%)
Rooms in renter-occupied houses - 5 rooms (%)
Rooms in renter-occupied houses - 6 rooms (%)
Rooms in renter-occupied houses - 7 rooms (%)
Rooms in renter-occupied houses - 8 rooms (%)
Rooms in renter-occupied houses - 9+ rooms (%)
Bedrooms in owner-occupied houses - no bedrooms (%)
Bedrooms in owner-occupied houses - 1 bedroom (%)
Bedrooms in owner-occupied houses - 2 bedrooms (%)
Bedrooms in owner-occupied houses - 3 bedrooms (%)
Bedrooms in owner-occupied houses - 4 bedrooms (%)
Bedrooms in owner-occupied houses - 5+ bedrooms (%)
Bedrooms in renter-occupied houses - no bedrooms (%)
Bedrooms in renter-occupied houses - 1 bedroom (%)
Bedrooms in renter-occupied houses - 2 bedrooms (%)
Bedrooms in renter-occupied houses - 3 bedrooms (%)
Bedrooms in renter-occupied houses - 4 bedrooms (%)
Bedrooms in renter-occupied houses - 5+ bedrooms (%)
Vehicles available in owner-occupied houses - no vehicle available (%)
Vehicles available in owner-occupied houses - 1 vehicle available(%)
Vehicles available in owner-occupied houses - 2 Vehicles available (%)
Vehicles available in owner-occupied houses - 3 Vehicles available (%)
Vehicles available in owner-occupied houses - 4 Vehicles available (%)
Vehicles available in owner-occupied houses - 5+ Vehicles available (%)
Vehicles available in renter-occupied houses - no vehicle available (%)
Vehicles available in renter-occupied houses - 1 vehicle available (%)
Vehicles available in renter-occupied houses - 2 Vehicles available (%)
Vehicles available in renter-occupied houses - 3 Vehicles available (%)
Vehicles available in renter-occupied houses - 4 Vehicles available (%)
Vehicles available in renter-occupied houses - 5+ Vehicles available (%)
Housing units in structures - 1, detached (%)
Housing units in structures - 1, attached (%)
Housing units in structures - 2 (%)
Housing units in structures - 3 or 4 (%)
Housing units in structures - 5 to 9 (%)
Housing units in structures - 10 to 19 (%)
Housing units in structures - 20 to 49 (%)
Housing units in structures - 50 or more (%)
Housing units in structures - Mobile home (%)
Housing units in structures - Boat, RV, van, etc. (%)
Housing units in structures - Owners - 1, detached (%)
Housing units in structures - Owners - 1, attached (%)
Housing units in structures - Owners - 2 (%)
Housing units in structures - Owners - 3 or 4 (%)
Housing units in structures - Owners - 5 to 9 (%)
Housing units in structures - Owners - 10 to 19 (%)
Housing units in structures - Owners - 20 to 49 (%)
Housing units in structures - Owners - 50 or more (%)
Housing units in structures - Owners - Mobile home (%)
Housing units in structures - Owners - Boat, RV, van, etc. (%)
Housing units in structures - Renters - 1, detached (%)
Housing units in structures - Renters - 1, attached (%)
Housing units in structures - Renters - 2 (%)
Housing units in structures - Renters - 3 or 4 (%)
Housing units in structures - Renters - 5 to 9 (%)
Housing units in structures - Renters - 10 to 19 (%)
Housing units in structures - Renters - 20 to 49 (%)
Housing units in structures - Renters - 50 or more (%)
Housing units in structures - Renters - Mobile home (%)
Housing units in structures - Renters - Boat, RV, van, etc. (%)
House/condo owner moved in on average (years ago)
Renter moved in on average (years ago)
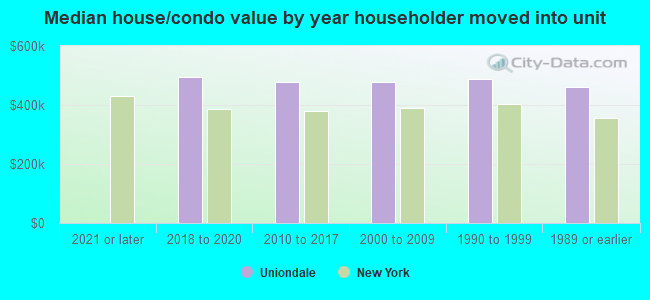
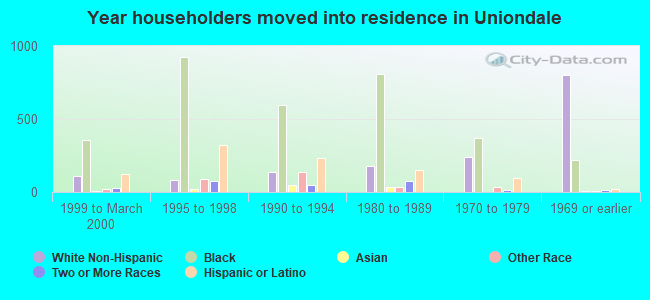
Year householder moved into unit - Moved in 1999 to March 2000 (%)
Year householder moved into unit - Moved in 1999 to March 2000 (%) - White
Year householder moved into unit - Moved in 1999 to March 2000 (%) - Black or African American
Year householder moved into unit - Moved in 1999 to March 2000 (%) - Asian
Year householder moved into unit - Moved in 1999 to March 2000 (%) - Hispanic or Latino
Year householder moved into unit - Moved in 1999 to March 2000 (%) - American Indian and Alaska Native
Year householder moved into unit - Moved in 1999 to March 2000 (%) - Multirace
Year householder moved into unit - Moved in 1999 to March 2000 (%) - Other Race
Year householder moved into unit - Moved in 1995 to 1998 (%)
Year householder moved into unit - Moved in 1995 to 1998 (%) - White
Year householder moved into unit - Moved in 1995 to 1998 (%) - Black or African American
Year householder moved into unit - Moved in 1995 to 1998 (%) - Asian
Year householder moved into unit - Moved in 1995 to 1998 (%) - Hispanic or Latino
Year householder moved into unit - Moved in 1995 to 1998 (%) - American Indian and Alaska Native
Year householder moved into unit - Moved in 1995 to 1998 (%) - Multirace
Year householder moved into unit - Moved in 1995 to 1998 (%) - Other Race
Year householder moved into unit - Moved in 1990 to 1994 (%)
Year householder moved into unit - Moved in 1990 to 1994 (%) - White
Year householder moved into unit - Moved in 1990 to 1994 (%) - Black or African American
Year householder moved into unit - Moved in 1990 to 1994 (%) - Asian
Year householder moved into unit - Moved in 1990 to 1994 (%) - Hispanic or Latino
Year householder moved into unit - Moved in 1990 to 1994 (%) - American Indian and Alaska Native
Year householder moved into unit - Moved in 1990 to 1994 (%) - Multirace
Year householder moved into unit - Moved in 1990 to 1994 (%) - Other Race
Year householder moved into unit - Moved in 1980 to 1989 (%)
Year householder moved into unit - Moved in 1980 to 1989 (%) - White
Year householder moved into unit - Moved in 1980 to 1989 (%) - Black or African American
Year householder moved into unit - Moved in 1980 to 1989 (%) - Asian
Year householder moved into unit - Moved in 1980 to 1989 (%) - Hispanic or Latino
Year householder moved into unit - Moved in 1980 to 1989 (%) - American Indian and Alaska Native
Year householder moved into unit - Moved in 1980 to 1989 (%) - Multirace
Year householder moved into unit - Moved in 1980 to 1989 (%) - Other Race
Year householder moved into unit - Moved in 1970 to 1979 (%)
Year householder moved into unit - Moved in 1970 to 1979 (%) - White
Year householder moved into unit - Moved in 1970 to 1979 (%) - Black or African American
Year householder moved into unit - Moved in 1970 to 1979 (%) - Asian
Year householder moved into unit - Moved in 1970 to 1979 (%) - Hispanic or Latino
Year householder moved into unit - Moved in 1970 to 1979 (%) - American Indian and Alaska Native
Year householder moved into unit - Moved in 1970 to 1979 (%) - Multirace
Year householder moved into unit - Moved in 1970 to 1979 (%) - Other Race
Year householder moved into unit - Moved in 1969 or earlier (%)
Year householder moved into unit - Moved in 1969 or earlier (%) - White
Year householder moved into unit - Moved in 1969 or earlier (%) - Black or African American
Year householder moved into unit - Moved in 1969 or earlier (%) - Asian
Year householder moved into unit - Moved in 1969 or earlier (%) - Hispanic or Latino
Year householder moved into unit - Moved in 1969 or earlier (%) - American Indian and Alaska Native
Year householder moved into unit - Moved in 1969 or earlier (%) - Multirace
Year householder moved into unit - Moved in 1969 or earlier (%) - Other Race
Housing units lacking complete plumbing facilities (%)
Housing units lacking complete kitchen facilities (%)
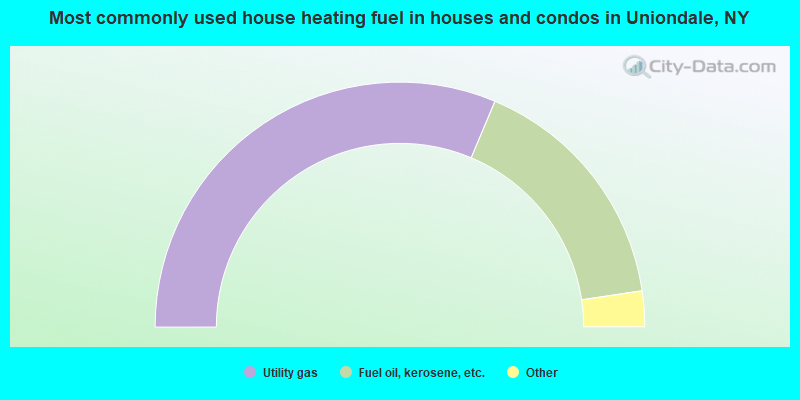
House heating fuel used in houses and condos - Utility gas (%)
House heating fuel used in houses and condos - Bottled, tank, or LP gas (%)
House heating fuel used in houses and condos - Electricity (%)
House heating fuel used in houses and condos - Fuel oil, kerosene, etc. (%)
House heating fuel used in houses and condos - Coal or coke (%)
House heating fuel used in houses and condos - Wood (%)
House heating fuel used in houses and condos - Solar energy (%)
House heating fuel used in houses and condos - Other fuel (%)
House heating fuel used in houses and condos - No fuel used (%)
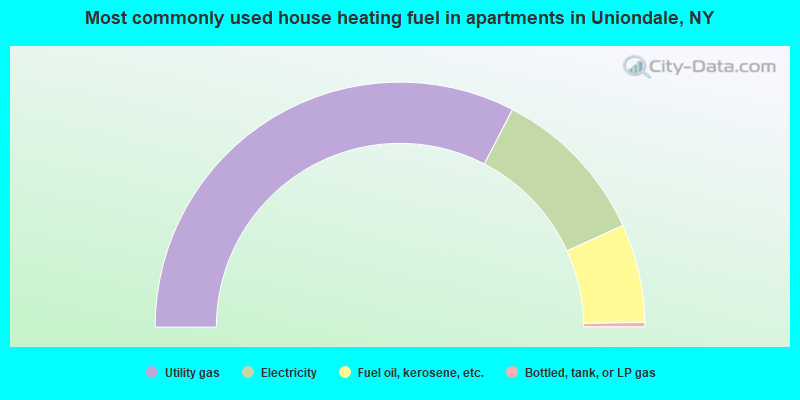
House heating fuel used in apartments - Utility gas (%)
House heating fuel used in apartments - Bottled, tank, or LP gas (%)
House heating fuel used in apartments - Electricity (%)
House heating fuel used in apartments - Fuel oil, kerosene, etc. (%)
House heating fuel used in apartments - Coal or coke (%)
House heating fuel used in apartments - Wood (%)
House heating fuel used in apartments - Solar energy (%)
House heating fuel used in apartments - Other fuel (%)
House heating fuel used in apartments - No fuel used (%)
Latest news about housing in Uniondale, NY collected exclusively by city-data.com from local newspapers, TV, and radio stations
Median year house/condo built: 1953Median year apartment built: 1958Household type by relationship:
Households: 33,062
Male householders: 4,554 (741 living alone ), Female householders: 4,107 (1,142 living alone )3,742 spouses (3,622 opposite-sex spouses ), 583 unmarried partners , (583 opposite-sex unmarried partners ), 8,424 children (7,768 natural , 104 adopted , 551 stepchildren ), 1,304 grandchildren , 823 brothers or sisters , 1,051 parents , 121 foster children , 2,192 other relatives , 2,368 non-relatives In group quarters: 3,786
Size of family households: 1,674 2-persons , 1,382 3-persons , 1,248 4-persons , 862 5-persons , 483 6-persons , 754 7-or-more-persons .
Size of nonfamily households: 1,963 1-person , 192 2-persons , 51 3-persons , 10 4-persons , 12 5-persons , 10 6-persons , 117 7-or-more-persons .
2,453 married couples with children. single-parent households (812 men , 962 women ).
52.1% of residents of Uniondale speak English at home. of residents speak Spanish at home (43% speak English very well , 21% speak English well , 30% speak English not well , 6% don't speak English at all ).of residents speak other Indo-European language at home (68% speak English very well , 25% speak English well , 6% speak English not well , 1% don't speak English at all ).of residents speak Asian or Pacific Island language at home (51% speak English very well , 18% speak English well , 26% speak English not well , 5% don't speak English at all ).of residents speak other language at home (78% speak English very well , 11% speak English well , 9% speak English not well , 2% don't speak English at all ).
Foreign born population: 12,127 (36.7%)of them are naturalized citizens )
Median number of rooms in houses and condos:
Median number of rooms in apartments
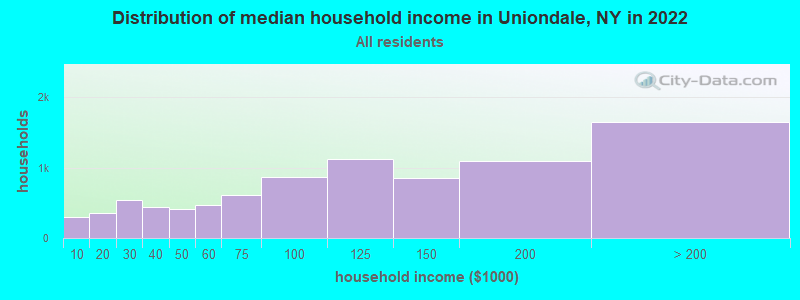
Uniondale, NY household income distribution 304 Less than $10,000353 $10,000 to $19,999538 $20,000 to $29,999439 $30,000 to $39,999413 $40,000 to $49,999465 $50,000 to $59,999615 $60,000 to $74,999874 $75,000 to $99,9991,125 $100,000 to $124,999860 $125,000 to $149,9991,095 $150,000 to $199,9991,650 $200,000 or more
Home value of owner - occupied houses in 2022 in Uniondale, NY 265 Less than $10,0006 $20,000 to $24,99922 $40,000 to $49,99916 $50,000 to $59,99939 $60,000 to $69,99925 $90,000 to $99,9996 $125,000 to $149,99965 $150,000 to $174,99914 $175,000 to $199,999184 $200,000 to $249,999104 $250,000 to $299,999823 $300,000 to $399,9991,527 $400,000 to $499,9991,973 $500,000 to $749,999382 $750,000 to $999,999199 $1,000,000 to $1,499,99945 $2,000,000 or moreRent paid by renters in 2022 in Uniondale, NY 64 $100 to $14912 $150 to $19944 $200 to $2497 $250 to $29919 $350 to $39915 $550 to $5998 $600 to $64962 $750 to $799133 $900 to $999263 $1,000 to $1,249125 $1,250 to $1,499424 $1,500 to $1,999161 $2,000 to $2,499223 $2,500 to $2,999289 $3,000 to $3,499467 $3,500 or more102 No cash rent
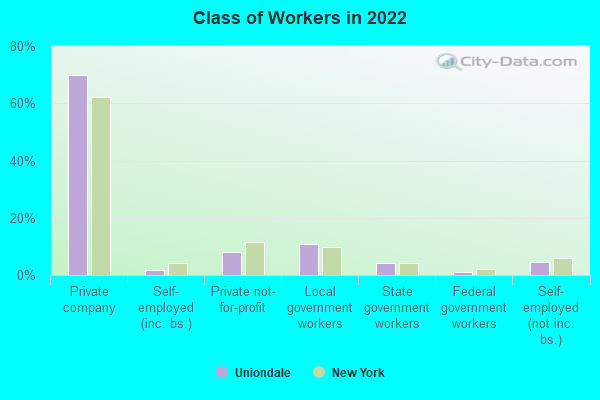
Percentage of workers working in this county: 71.7%Number of people working at home: 1,385 (9.1% of all workers )
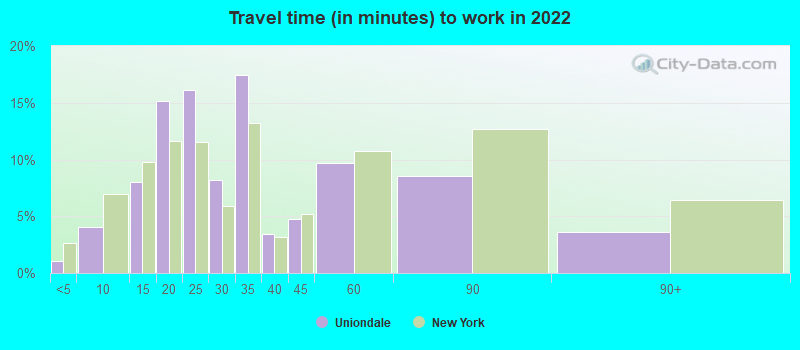
Travel time to work (commute)
Less than 5 minutes: 1715 to 9 minutes: 1,07610 to 14 minutes: 1,48915 to 19 minutes: 1,86420 to 24 minutes: 1,47925 to 29 minutes: 1,01230 to 34 minutes: 2,04135 to 39 minutes: 16140 to 44 minutes: 45545 to 59 minutes: 1,31060 to 89 minutes: 1,51590 or more minutes: 1,001
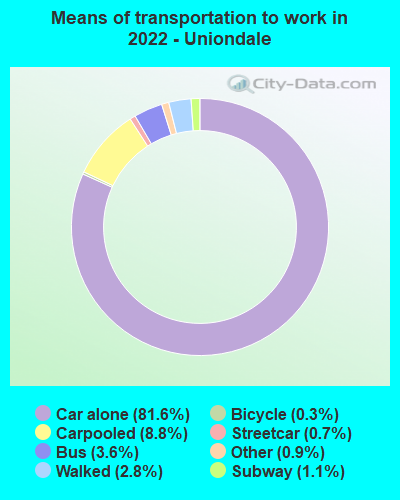
Means of transportation to work:
Drove a car alone: 26,776 (76.2%)Carpooled: 2,805 (8.0%)Bus : 1,141 (3.2%)Subway or elevated rail : 216 (0.6%)Long-distance train or commuter rail : 326 (0.9%)Light rail, streetcar or trolley : 7 (0.0%)Taxi: 433 (1.2%)Bicycle: 170 (0.5%)Walked: 984 (2.8%)Worked at home: 1,385 (3.9%)
Unemployment by race in 2022
Unemployment rate for White non-Hispanic residents 6.1% Males6.0% FemalesUnemployment rate for Black residents 6.6% Males7.1% FemalesUnemployment rate for Asian residents 6.4% MalesUnemployment rate for other race residents 4.7% Males5.9% FemalesUnemployment rate for two or more race residents 3.2% Males7.8% FemalesUnemployment rate for Hispanic or Latino residents 5.0% Males5.0% Females
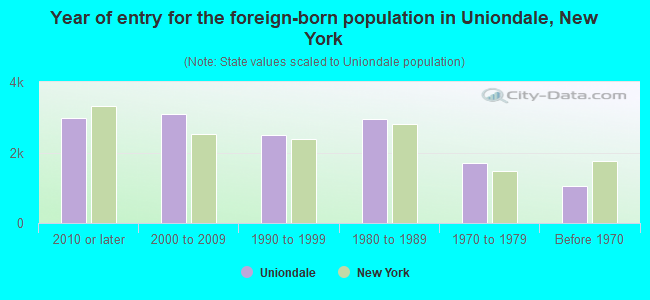
Year of entry for the foreign-born population in Uniondale, New York
2,972 2010 or later 3,093 2000 to 2009 2,485 1990 to 1999 2,944 1980 to 1989 1,698 1970 to 1979 1,054 Before 1970
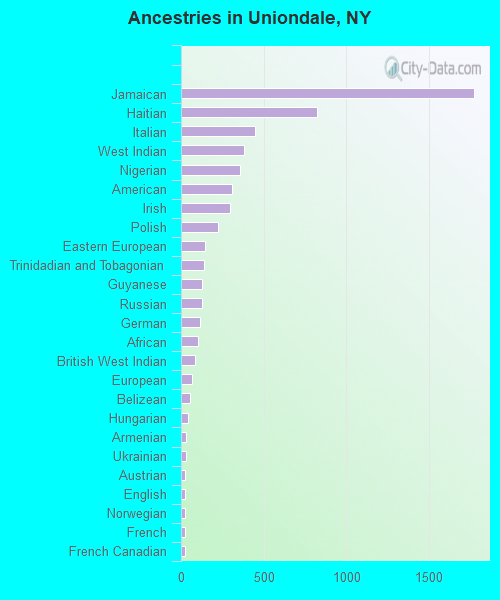
First ancestries reported:
Jamaican: 1,777 (9.0%)
Haitian: 824 (4.2%)
Italian: 451 (2.3%)
West Indian: 384 (1.9%)
Nigerian: 357 (1.8%)
American: 308 (1.6%)
Irish: 297 (1.5%)
Polish: 227 (1.1%)
Eastern European: 148 (0.7%)
Trinidadian and Tobagonian: 141 (0.7%)
Guyanese: 125 (0.6%)
Russian: 125 (0.6%)
German: 115 (0.6%)
African: 103 (0.5%)
British West Indian: 86 (0.4%)
European: 66 (0.3%)
Belizean: 56 (0.3%)
Hungarian: 40 (0.2%)
Armenian: 33 (0.2%)
Ukrainian: 29 (0.1%)
Austrian: 24 (0.1%)
English: 24 (0.1%)
Norwegian: 23 (0.1%)
French: 22 (0.1%)
French Canadian: 22 (0.1%)
Scotch-Irish: 22 (0.1%)
Lithuanian: 21 (0.1%)
Romanian: 20 (0.1%)
Greek: 18 (0.09%)
Barbadian: 16 (0.08%)
U.S. Virgin Islander: 13 (0.07%)
Dutch West Indian: 12 (0.06%)
Moroccan: 8 (0.04%)
Syrian: 7 (0.04%)
Dutch: 6 (0.03%)
Latvian: 6 (0.03%)
Maltese: 3 (0.02%) Most common places of birth for foreign-born residents (%): El Salvador Uniondale:
32.3% (3,785)New York:
2.4% (108,067)
Jamaica Uniondale:
14.8% (1,740)New York:
5.0% (227,557)
Honduras Uniondale:
8.4% (987)New York:
1.2% (55,571)
Dominican Republic Uniondale:
6.2% (729)New York:
11.1% (501,040)
Haiti Uniondale:
6.1% (717)New York:
2.8% (126,936)
Mexico Uniondale:
4.4% (512)New York:
4.8% (214,559)
Guyana Uniondale:
3.1% (358)New York:
3.8% (172,129)
Ecuador Uniondale:
3.0% (348)New York:
3.9% (177,448)
Guatemala Uniondale:
2.6% (308)New York:
1.4% (61,245)
Nigeria Uniondale:
2.0% (240)New York:
0.7% (33,746)
Colombia Uniondale:
2.0% (238)New York:
2.5% (111,920)
Peru Uniondale:
1.8% (209)New York:
1.2% (54,759)
Place of birth for U.S.-born residents:
This state: 16,544Other state: 2,942Northeast: 891Midwest: 487South: 941West: 647 87.4% of Uniondale residents lived in the same house 1 years ago.
Out of people who lived in different houses, 28.0% lived in this county.
Out of people who lived in different counties, 66.0% lived in New York.
Uniondale:
87.4%State average:
89.6%
Education attainment for males 25 years and older:
No schooling: 497Nursery to 4th grade: 1635th and 6th grade: 3787th and 8th grade: 2869th grade: 26110th grade: 9211th grade: 6512th grade, no diploma: 434High school graduate (or equivalency): 2,800Less than 1 year of college: 479Some college more than 1 year, no degree: 937Associate degree: 634Bachelor's degree: 1,232Master's degree: 1,031Professional school degree: 544Doctorate degree: 61
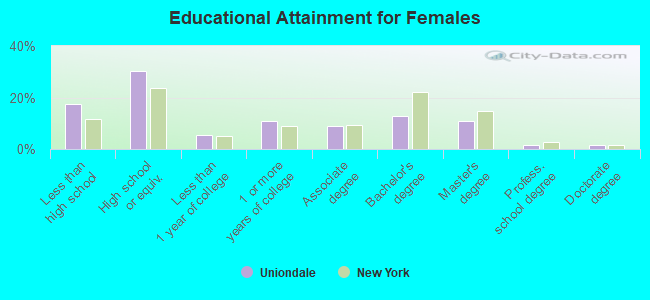
Education attainment for females 25 years and older:
No schooling: 493Nursery to 4th grade: 2515th and 6th grade: 3237th and 8th grade: 2229th grade: 33510th grade: 4611th grade: 7512th grade, no diploma: 131High school graduate (or equivalency): 3,233Less than 1 year of college: 579Some college more than 1 year, no degree: 1,154Associate degree: 978Bachelor's degree: 1,389Master's degree: 1,185Professional school degree: 153Doctorate degree: 172
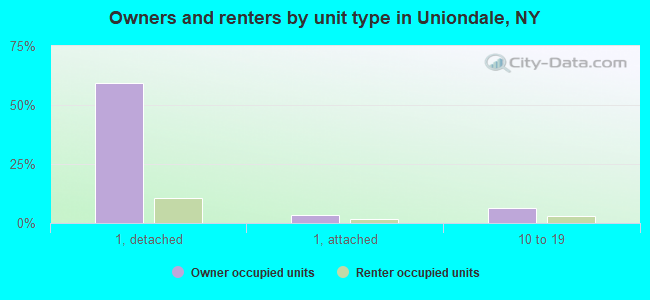
Housing units in structures:
One, detached: 6,509One, attached: 461Two: 2753 or 4: 1885 to 9: 18810 to 19: 79620 to 49: 19250 or more: 554Mobile homes: 48Median worth of mobile homes: $290,658
Housing units lacking complete plumbing facilities in 2022: 0.6%Housing units lacking complete kitchen facilities in 2022: 2.7%House/condo owner moved in on average 16 years ago
Renter moved in on average 2 years ago
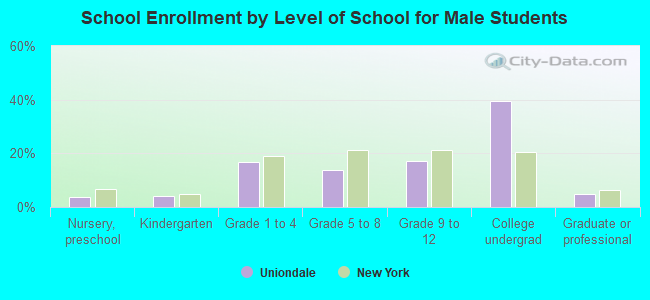
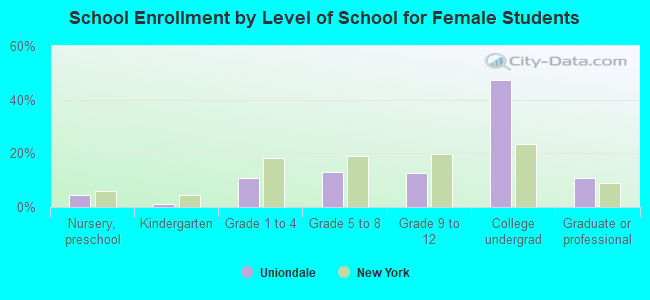
Private vs. public school enrollment:
Students in private schools in grades 1 to 8 (elementary and middle school): 281 Students in private schools in grades 9 to 12 (high school): 147 Students in private undergraduate colleges: 2,501