Housing density: 3,116 houses/condos per square mile
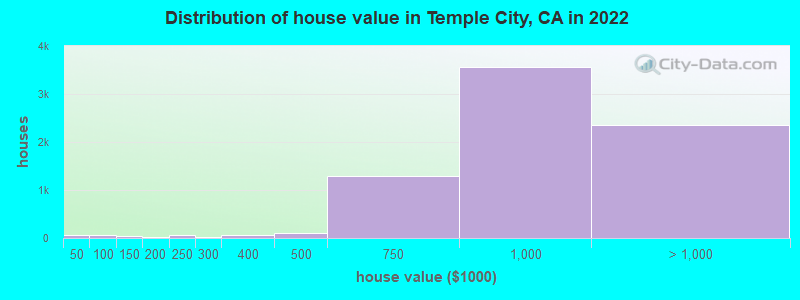
Median price asked for vacant for-sale houses and condos in 2022 in this county: $1,291,802.
Median contract rent in 2022: $1,854 (lower quartile is $1,429, upper quartile is over $2,000)
Median rent asked for vacant for-rent units in 2022: $3,283
Median gross rent in Temple City, CA in 2022: $1,975
Housing units in Temple City with a mortgage: 4,005 (355 second mortgage, 0 home equity loan, 193 both second mortgage and home equity loan) Houses without a mortgage: 44
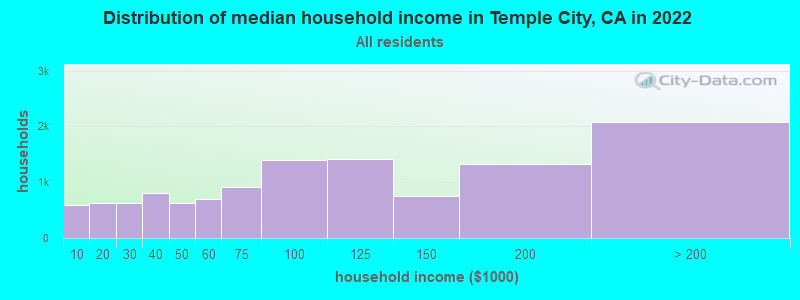
Median household income for houses/condos with a mortgage: $147,846
Median household income for apartments without a mortgage: $85,771
Median monthly housing costs: $1,937
Compare current foreclosures near Temple City, CA:
4,995 married couples with children.
1,646 single-parent households (636 men, 1,010 women).
33.8% of residents of Temple City speak English at home.
10.8% of residents speak Spanish at home (58% speak English very well, 20% speak English well, 15% speak English not well, 7% don't speak English at all).
2.8% of residents speak other Indo-European language at home (81% speak English very well, 7% speak English well, 10% speak English not well, 2% don't speak English at all).
51.9% of residents speak Asian or Pacific Island language at home (44% speak English very well, 26% speak English well, 21% speak English not well, 9% don't speak English at all).
0.5% of residents speak other language at home (80% speak English very well, 17% speak English well, 3% speak English not well).
Foreign born population: 17,675 (50.0%)
(68.3% of them are naturalized citizens)
Percentage of workers working in this county: 93.0% Number of people working at home: 2,849 (17.3% of all workers)
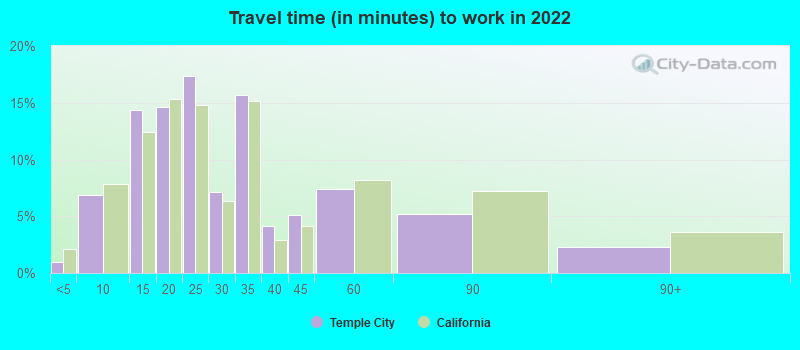
Travel time to work (commute)
Less than 5 minutes: 118
5 to 9 minutes: 708
10 to 14 minutes: 1,199
15 to 19 minutes: 1,847
20 to 24 minutes: 2,063
25 to 29 minutes: 784
30 to 34 minutes: 2,498
35 to 39 minutes: 324
40 to 44 minutes: 668
45 to 59 minutes: 1,488
60 to 89 minutes: 1,363
90 or more minutes: 509
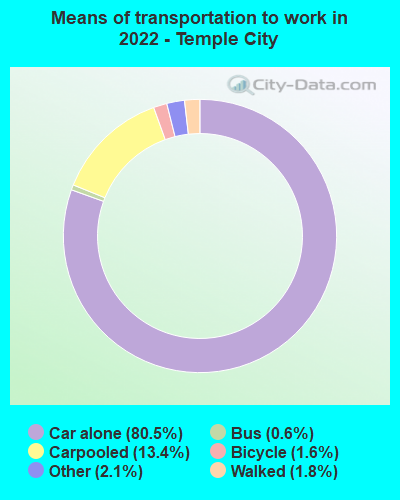
Means of transportation to work:
Drove a car alone: 4,689 (56.2%)
Carpooled: 863 (10.3%)
Bus: 31 (0.4%)
Taxi: 132 (1.6%)
Bicycle: 97 (1.2%)
Walked: 112 (1.3%)
Worked at home: 2,849 (34.1%)
Unemployment by race in 2022
Unemployment rate for White non-Hispanic residents
4.6%Males
8.0%Females
Unemployment rate for American Indian and Alaska Native residents
10.4%Females
Unemployment rate for Asian residents
4.6%Males
3.2%Females
Unemployment rate for other race residents
14.6%Males
2.5%Females
Unemployment rate for two or more race residents
4.0%Males
7.3%Females
Unemployment rate for Hispanic or Latino residents
7.2%Males
9.1%Females
Year of entry for the foreign-born population in Temple City, California
4,0662010 or later
3,6362000 to 2009
3,5401990 to 1999
4,5861980 to 1989
2,3611970 to 1979
1,394Before 1970
First ancestries reported:
English: 430 (1.8%)
American: 302 (1.3%)
German: 273 (1.1%)
Italian: 243 (1.0%)
South African: 169 (0.7%)
Irish: 134 (0.6%)
Iranian: 125 (0.5%)
European: 103 (0.4%)
Scottish: 83 (0.3%)
Armenian: 62 (0.3%)
Greek: 59 (0.2%)
Dutch: 55 (0.2%)
Polish: 42 (0.2%)
Russian: 40 (0.2%)
Hungarian: 37 (0.2%)
Ukrainian: 31 (0.1%)
British: 29 (0.1%)
Nigerian: 26 (0.1%)
Finnish: 23 (0.10%)
French: 18 (0.08%)
Syrian: 17 (0.07%)
Norwegian: 16 (0.07%)
Egyptian: 13 (0.05%)
Croatian: 13 (0.05%)
Scotch-Irish: 12 (0.05%)
Northern European: 8 (0.03%)
French Canadian: 8 (0.03%)
Welsh: 8 (0.03%)
Scandinavian: 6 (0.03%)
Swedish: 6 (0.03%)
Afghan: 6 (0.03%)
Canadian: 5 (0.02%)
Brazilian: 5 (0.02%)
Most common places of birth for foreign-born residents (%):
China, excluding Hong Kong and Taiwan
Temple City:
37.0% (6,540)
California:
6.6% (684,672)
Vietnam
Temple City:
15.3% (2,707)
California:
4.9% (512,335)
Taiwan
Temple City:
12.6% (2,221)
California:
1.7% (176,274)
Mexico
Temple City:
8.1% (1,435)
California:
37.2% (3,881,193)
Hong Kong
Temple City:
4.9% (873)
California:
1.0% (105,215)
Philippines
Temple City:
3.7% (647)
California:
7.8% (818,297)
Korea
Temple City:
2.7% (477)
California:
3.0% (315,248)
Indonesia
Temple City:
1.8% (317)
California:
0.4% (39,097)
Cambodia
Temple City:
1.6% (284)
California:
0.5% (51,974)
Place of birth for U.S.-born residents:
This state: 14,802
Other state: 2,468
Northeast: 550
Midwest: 901
South: 609
West: 390
92.3% of Temple City residents lived in the same house 1 years ago. Out of people who lived in different houses, 43.1% lived in this county. Out of people who lived in different counties, 74.3% lived in California.
Temple City:
92.3%
State average:
88.9%
Education attainment for males 25 years and older:
No schooling: 292
Nursery to 4th grade: 92
5th and 6th grade: 138
7th and 8th grade: 136
9th grade: 34
10th grade: 80
11th grade: 75
12th grade, no diploma: 468
High school graduate (or equivalency): 2,717
Less than 1 year of college: 561
Some college more than 1 year, no degree: 1,311
Associate degree: 774
Bachelor's degree: 3,538
Master's degree: 1,358
Professional school degree: 233
Doctorate degree: 225
Education attainment for females 25 years and older:
No schooling: 513
Nursery to 4th grade: 126
5th and 6th grade: 252
7th and 8th grade: 221
9th grade: 62
10th grade: 96
11th grade: 89
12th grade, no diploma: 334
High school graduate (or equivalency): 3,088
Less than 1 year of college: 645
Some college more than 1 year, no degree: 1,319
Associate degree: 1,313
Bachelor's degree: 3,709
Master's degree: 1,464
Professional school degree: 341
Doctorate degree: 187
Housing units in structures:
One, detached: 9,809
One, attached: 757
Two: 260
3 or 4: 442
5 to 9: 432
10 to 19: 488
20 to 49: 105
50 or more: 117
Mobile homes: 99
Housing units lacking complete plumbing facilities in 2022: 1.3%
Housing units lacking complete kitchen facilities in 2022: 2.8%
House/condo owner moved in on average 17 years ago