Taylor Creek, FL (Florida) Houses and Residents
| Taylor Creek: | $136,938 |
| Florida: | $354,100 |
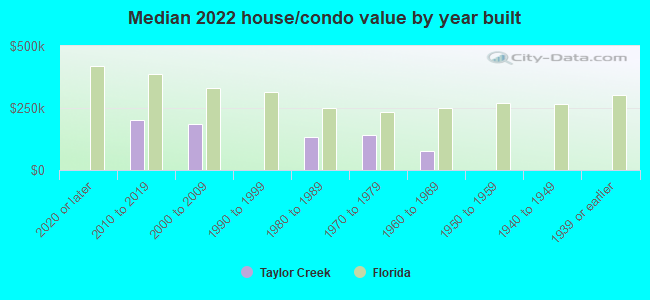
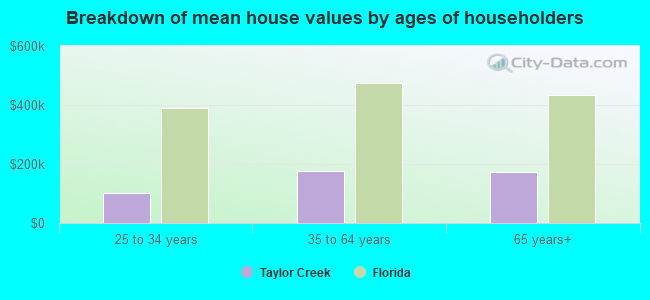
Mean price in 2022:
Detached houses: $260,337
Here: $260,337 State: $500,941 Mobile homes: $123,485
Here: $123,485 State: $113,202 Occupied boats, RVs, vans, etc.: $14,525
Here: $14,525 State: $73,933
Total population: 4,348 (Urban population: 4,201 (all inside urban clusters), Rural population: 213 (all nonfarm))
Houses: 2,788 (2,118 occupied: 1,581 owner occupied, 582 renter occupied)
| % of renters here: | 27% |
| State: | 33% |
Housing density: 698 houses/condos per square mile
Median price asked for vacant for-sale houses and condos in 2022: $532,200.
Median contract rent in 2022: $803 (lower quartile is $641, upper quartile is $1,060)
Median rent asked for vacant for-rent units in 2022: $758
Median gross rent in Taylor Creek, FL in 2022: $982
Housing units in Taylor Creek with a mortgage: 608 (50 second mortgage, 0 home equity loan, 51 both second mortgage and home equity loan)
Houses without a mortgage: 60
Median household income for houses/condos with a mortgage: $56,246
Median household income for apartments without a mortgage: $32,922
Median monthly housing costs: $799
Compare current foreclosures near Taylor Creek, FL:
| Photo | Address | Area | Beds / Baths | Price | Details |
|---|---|---|---|---|---|

|
#1
SE 91st Trl
Okeechobee, FL 34974
|
1,726 sq. feet
|
- baths - beds |
$34,700
|
show details |

|
#2
Carlton Rd
Port Saint Lucie, FL 34987
|
2,034 sq. feet
|
2 baths 4 beds |
show details | |

|
#3
SE 39th Ter
Okeechobee, FL 34974
|
2,341 sq. feet
|
2 baths 4 beds |
show details | |

|
#4
NE 3rd St
Okeechobee, FL 34972
|
1,665 sq. feet
|
2 baths 3 beds |
show details | |

|
#5
SE 28th St
Okeechobee, FL 34974
|
1,864 sq. feet
|
1 baths 2 beds |
show details | |

|
#6
Us Highway 441 SE
Okeechobee, FL 34974
|
1,352 sq. feet
|
2 baths 4 beds |
show details | |

|
#7
SE 8th Ave
Okeechobee, FL 34974
|
3,104 sq. feet
|
2 baths 4 beds |
show details | |

|
#8
Chobee Loop
Okeechobee, FL 34974
|
936 sq. feet
|
2 baths 2 beds |
show details | |

|
#9
NW 37th Ave
Okeechobee, FL 34972
|
2,920 sq. feet
|
2 baths 4 beds |
show details | |

|
#10
SE 43rd Trce
Okeechobee, FL 34974
|
2,000 sq. feet
|
2 baths 3 beds |
show details |
| Photo | Address | Area | Beds / Baths | Price | Details |
|---|---|---|---|---|---|

|
#11
SW 5th Ave
Okeechobee, FL 34974
|
1,613 sq. feet
|
1 baths 3 beds |
show details | |

|
#12
NW 37th Ave
Okeechobee, FL 34972
|
1,268 sq. feet
|
2 baths 3 beds |
show details | |

|
#13
NW 39th Ave
Okeechobee, FL 34972
|
2,788 sq. feet
|
2 baths 2 beds |
show details | |

|
#14
NW 22nd Ave
Okeechobee, FL 34972
|
1,972 sq. feet
|
2 baths 3 beds |
show details | |

|
#15
NW 81st Ct
Okeechobee, FL 34972
|
1,452 sq. feet
|
2 baths 3 beds |
show details | |

|
#16
NE 54th Trl
Okeechobee, FL 34972
|
3,258 sq. feet
|
2 baths 3 beds |
show details | |

|
#17
SE 38th Trl
Okeechobee, FL 34974
|
2,090 sq. feet
|
2 baths 3 beds |
show details | |

|
#18
SW 19th St
Okeechobee, FL 34974
|
1,410 sq. feet
|
1 baths 2 beds |
show details | |

|
#19
SW 5th Ave
Okeechobee, FL 34974
|
3,454 sq. feet
|
2 baths 3 beds |
show details | |

|
#20
NE 28th Ave
Okeechobee, FL 34972
|
3,967 sq. feet
|
3 baths 3 beds |
show details |
| Photo | Address | Area | Beds / Baths | Price | Details |
|---|---|---|---|---|---|

|
#21
Lake Cir
Okeechobee, FL 34974
|
884 sq. feet
|
2 baths 3 beds |
show details | |

|
#22
Palm Ct
Okeechobee, FL 34974
|
1,344 sq. feet
|
2 baths 2 beds |
show details | |

|
#23
NE 4th Ln
Okeechobee, FL 34974
|
1,320 sq. feet
|
2 baths - beds |
show details | |

|
#24
SE 10th Ave
Okeechobee, FL 34974
|
2,109 sq. feet
|
1 baths - beds |
show details | |

|
#25
SE 6th Ln
Okeechobee, FL 34974
|
2,857 sq. feet
|
2 baths - beds |
show details | |

|
#26
SW Tommy Clements St
Indiantown, FL 34956
|
1,953 sq. feet
|
4 baths 3 beds |
show details | |

|
#27
NW 80th Dr
Okeechobee, FL 34972
|
1,152 sq. feet
|
1 baths - beds |
show details | |

|
#28
NE 6th St
Okeechobee, FL 34972
|
2,898 sq. feet
|
1 baths - beds |
show details | |

|
#29
SE 8th St
Okeechobee, FL 34974
|
2,550 sq. feet
|
2 baths - beds |
show details | |

|
#30
NW 4th St
Okeechobee, FL 34972
|
760 sq. feet
|
1 baths - beds |
show details |
| Photo | Address | Area | Beds / Baths | Price | Details |
|---|---|---|---|---|---|

|
#31
SW 19th St
Okeechobee, FL 34974
|
1,312 sq. feet
|
2 baths - beds |
show details | |

|
#32
SE 68th Dr
Okeechobee, FL 34974
|
1,222 sq. feet
|
1 baths - beds |
show details | |

|
#33
SW 11th Ave
Okeechobee, FL 34974
|
1,560 sq. feet
|
2 baths - beds |
show details | |

|
#34
NW 81st Ct
Okeechobee, FL 34972
|
1,440 sq. feet
|
2 baths - beds |
show details | |

|
#35
SE 27th St
Okeechobee, FL 34974
|
1,792 sq. feet
|
2 baths - beds |
show details | |

|
#36
SE 27th St
Okeechobee, FL 34974
|
3,296 sq. feet
|
2 baths - beds |
show details | |

|
#37
NW 90th Ct
Okeechobee, FL 34972
|
936 sq. feet
|
1 baths - beds |
show details | |

|
#38
SE 8th St
Okeechobee, FL 34974
|
1,232 sq. feet
|
1 baths - beds |
show details | |

|
#39
SE 27th St
Okeechobee, FL 34974
|
2,067 sq. feet
|
2 baths - beds |
show details | |

|
#40
SE 31st St
Okeechobee, FL 34974
|
1,273 sq. feet
|
2 baths - beds |
show details |
| Photo | Address | Area | Beds / Baths | Price | Details |
|---|---|---|---|---|---|

|
#41
NE 29th Ave
Okeechobee, FL 34972
|
1,030 sq. feet
|
1 baths - beds |
show details | |

|
#42
SE 14th Ave
Okeechobee, FL 34974
|
1,312 sq. feet
|
2 baths - beds |
show details | |

|
#43
SE 25th St
Okeechobee, FL 34974
|
1,721 sq. feet
|
2 baths - beds |
show details | |

|
#44
NW 115th Dr
Okeechobee, FL 34972
|
1,322 sq. feet
|
1 baths - beds |
show details | |

|
#45
NE 101st St
Okeechobee, FL 34972
|
- sq. feet
|
- baths - beds |
show details | |

|
#46
NE 96th Ave
Okeechobee, FL 34974
|
1,296 sq. feet
|
- baths - beds |
show details | |

|
#47
NW 160th St
Okeechobee, FL 34972
|
- sq. feet
|
- baths - beds |
show details | |

|
#48
NW 7th St
Okeechobee, FL 34972
|
1,296 sq. feet
|
- baths - beds |
show details | |

|
#49
SW Rucks Dairy Rd
Okeechobee, FL 34974
|
- sq. feet
|
- baths - beds |
show details | |

|
Check over 1 million property listings on Foreclosure.com!
|
browse all offers | |||


 | WHAT'S HAPPENING THIS WEEKEND! fairs, festivals, etc. (386 replies) |
| Commuting Between Melbourne and Orlando - Best and Fastest Route to Avoid Tolls (13 replies) |
| Job in Orlando but want to live at the beach (15 replies) |
| Good cheap land in Florida for a mobile home (52 replies) |
| Ft. Pierce, a bad neighborhood? (47 replies) |
| Need Boat Storage (1 reply) |

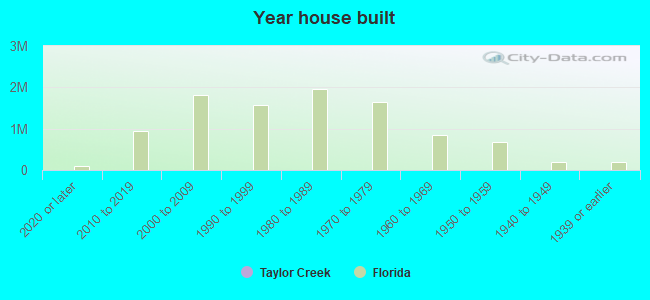
Median year apartment built: 1984
Household type by relationship:
Households: 4,694- Male householders: 1,190 (453 living alone), Female householders: 915 (320 living alone)
749 spouses (731 opposite-sex spouses), 299 unmarried partners, (290 opposite-sex unmarried partners), 871 children (779 natural, 0 adopted, 92 stepchildren), 112 grandchildren, 20 brothers or sisters, 20 parents, 0 foster children, 164 other relatives, 350 non-relatives
Size of family households: 738 2-persons, 195 3-persons, 169 4-persons, 20 5-persons, 118 6-persons.
Size of nonfamily households: 790 1-person, 123 2-persons, 9 3-persons.
175 married couples with children.
474 single-parent households (304 men, 170 women).
78.0% of residents of Taylor Creek speak English at home.
22.2% of residents speak Spanish at home (38% speak English very well, 39% speak English well, 10% speak English not well, 13% don't speak English at all).
0.2% of residents speak other Indo-European language at home (100% speak English very well).
Foreign born population: 431 (9.2%)
(22.7% of them are naturalized citizens)
| Here: | 4.8 |
| State: | 5.9 |
| Here: | 3.9 |
| State: | 4.2 |
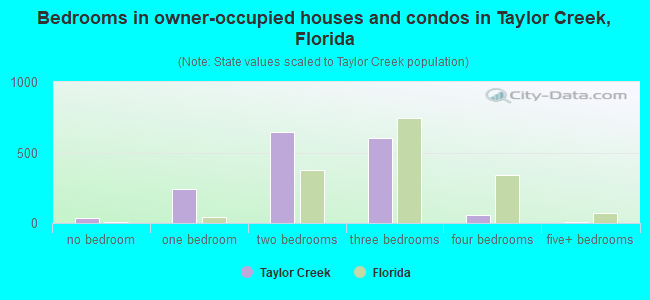
- Bedrooms in owner-occupied houses and condos in Taylor Creek, Florida
- 32no bedroom
- 2411 bedroom
- 6432 bedrooms
- 6023 bedrooms
- 564 bedrooms
- 75+ bedrooms

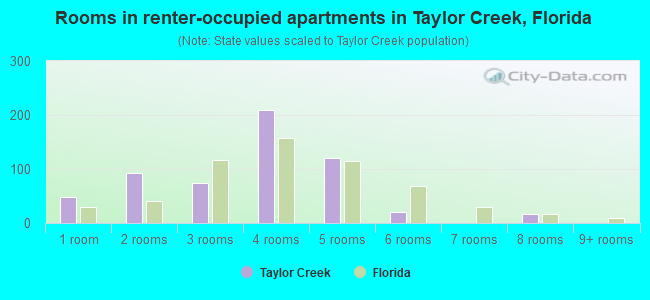
- Bedrooms in renter-occupied apartments in Taylor Creek, Florida
- 48no bedroom
- 1431 bedroom
- 3242 bedrooms
- 683 bedrooms
- 04 bedrooms
- 05+ bedrooms
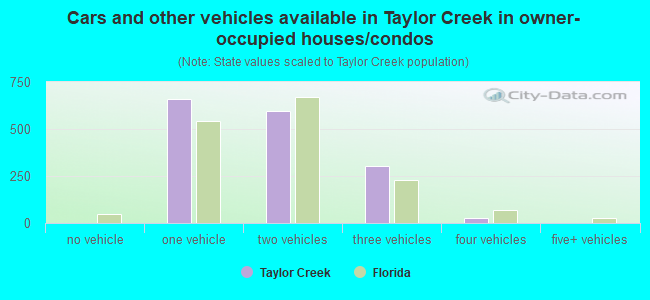
- Cars and other vehicles available in Taylor Creek in owner-occupied houses/condos
- 0no vehicle
- 6591 vehicle
- 5962 vehicles
- 3013 vehicles
- 254 vehicles
- 05+ vehicles
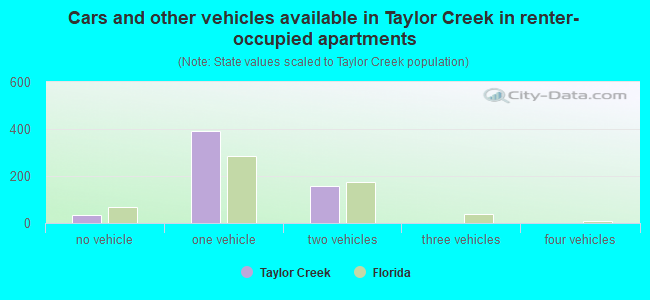
- Cars and other vehicles available in Taylor Creek in renter-occupied apartments
- 34no vehicle
- 3901 vehicle
- 1582 vehicles
- 03 vehicles
- 04 vehicles
- 05+ vehicles
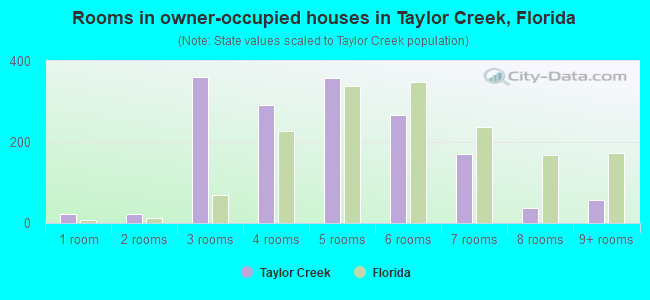
- Rooms in owner-occupied houses in Taylor Creek, Florida
- 221 room
- 212 rooms
- 3613 rooms
- 2914 rooms
- 3575 rooms
- 2676 rooms
- 1707 rooms
- 368 rooms
- 569+ rooms
- Rooms in renter-occupied apartments in Taylor Creek, Florida
- 481 room
- 932 rooms
- 743 rooms
- 2104 rooms
- 1205 rooms
- 206 rooms
- 07 rooms
- 178 rooms
- 09+ rooms

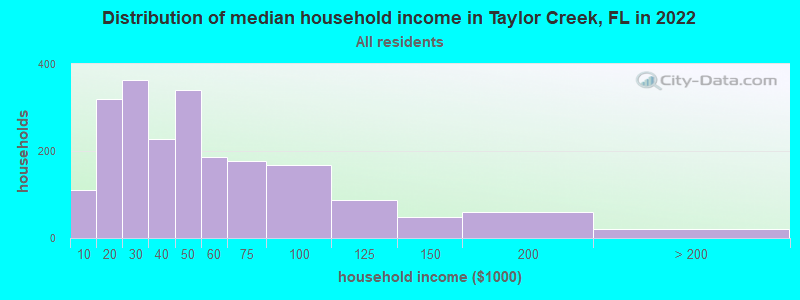
Taylor Creek, FL household income distribution

- 110Less than $10,000
- 320$10,000 to $19,999
- 363$20,000 to $29,999
- 227$30,000 to $39,999
- 340$40,000 to $49,999
- 186$50,000 to $59,999
- 178$60,000 to $74,999
- 167$75,000 to $99,999
- 87$100,000 to $124,999
- 48$125,000 to $149,999
- 59$150,000 to $199,999
- 20$200,000 or more
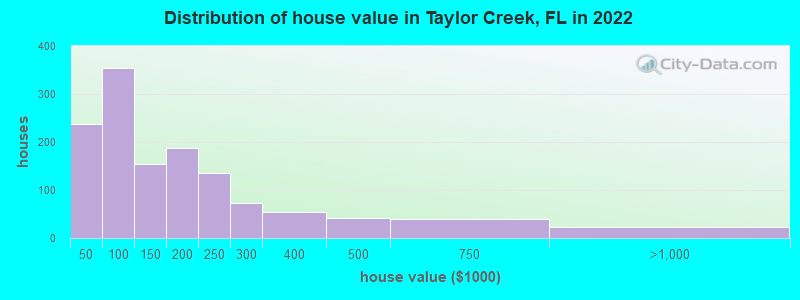
Home value of owner - occupied houses in 2022 in Taylor Creek, FL
-
- 115Less than $10,000
- 18$10,000 to $14,999
- 19$15,000 to $19,999
- 49$20,000 to $24,999
- 33$30,000 to $34,999
- 71$50,000 to $59,999
- 90$60,000 to $69,999
- 50$70,000 to $79,999
- 110$80,000 to $89,999
- 31$90,000 to $99,999
- 129$100,000 to $124,999
- 25$125,000 to $149,999
- 147$150,000 to $174,999
- 39$175,000 to $199,999
- 134$200,000 to $249,999
- 73$250,000 to $299,999
- 53$300,000 to $399,999
- 41$400,000 to $499,999
- 39$500,000 to $749,999
- 23$750,000 to $999,999
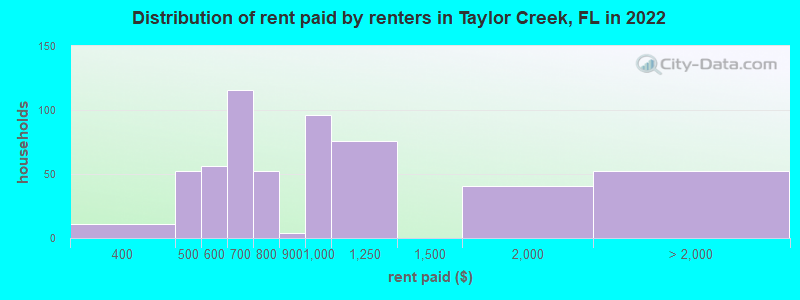
Rent paid by renters in 2022 in Taylor Creek, FL
-
- 11$300 to $349
- 52$400 to $449
- 49$500 to $549
- 6$550 to $599
- 116$600 to $649
- 44$700 to $749
- 7$750 to $799
- 4$800 to $899
- 95$900 to $999
- 75$1,000 to $1,249
- 41$1,500 to $1,999
- 52No cash rent
Percentage of workers working in this county: 77.3%
Number of people working at home: 11 (0.7% of all workers)
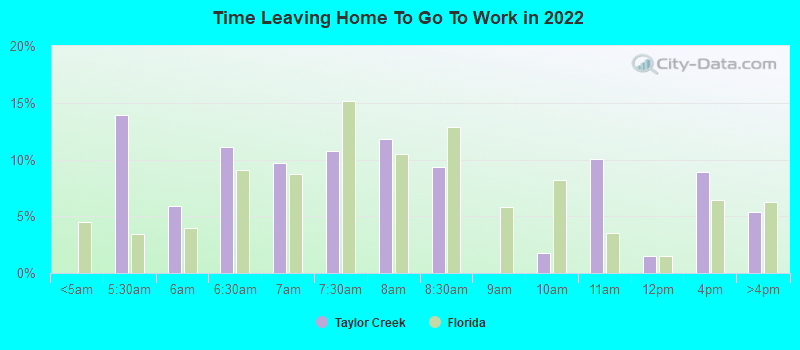
Travel time to work (commute)
- Less than 5 minutes: 93
- 5 to 9 minutes: 150
- 10 to 14 minutes: 298
- 15 to 19 minutes: 187
- 20 to 24 minutes: 98
- 25 to 29 minutes: 180
- 30 to 34 minutes: 24
- 35 to 39 minutes: 10
- 40 to 44 minutes: 128
- 45 to 59 minutes: 49
- 60 to 89 minutes: 169
- 90 or more minutes: 58
Means of transportation to work:
- Drove a car alone: 1,042 (79.5%)
- Carpooled: 206 (15.7%)
- Other means: 43 (3.3%)
- Worked at home: 20 (1.5%)
- Unemployment by race in 2022
- Unemployment rate for White non-Hispanic residents
- 11.0%Males
- 7.2%Females
- Unemployment rate for Hispanic or Latino residents
- 9.8%Males
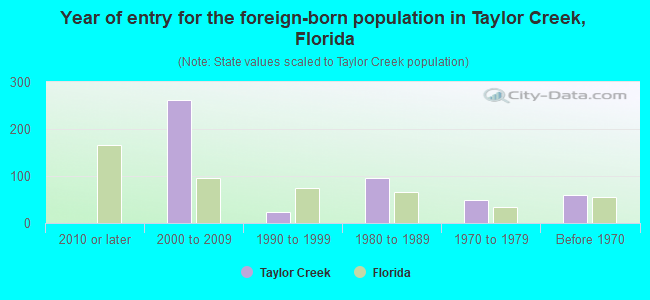
- Year of entry for the foreign-born population in Taylor Creek, Florida
- 02010 or later
- 2622000 to 2009
- 231990 to 1999
- 961980 to 1989
- 501970 to 1979
- 59Before 1970

First ancestries reported:
- American: 295 (11.0%)
- Irish: 228 (8.5%)
- German: 198 (7.4%)
- English: 195 (7.3%)
- Scottish: 93 (3.5%)
- European: 74 (2.8%)
- Italian: 42 (1.6%)
- Canadian: 40 (1.5%)
- Scotch-Irish: 34 (1.3%)
- Swedish: 22 (0.8%)
- Danish: 18 (0.7%)
- Eastern European: 18 (0.7%)
- French: 18 (0.7%)
- Polish: 17 (0.6%)
- British: 14 (0.5%)
- Lebanese: 12 (0.4%)
- Romanian: 11 (0.4%)
- Russian: 11 (0.4%)
- French Canadian: 8 (0.3%)
- Norwegian: 7 (0.3%)
- Trinidadian and Tobagonian: 7 (0.3%)
Most common places of birth for foreign-born residents (%):
| Taylor Creek: | 71.0% (306) |
| Florida: | 5.6% (257,152) |
| Taylor Creek: | 9.5% (41) |
| Florida: | 2.4% (109,132) |
| Taylor Creek: | 7.9% (34) |
| Florida: | 22.0% (1,006,576) |
| Taylor Creek: | 3.5% (15) |
| Florida: | 0.0% (1,033) |
| Taylor Creek: | 1.6% (7) |
| Florida: | 1.0% (43,642) |
Place of birth for U.S.-born residents:
- This state: 1,572
- Other state: 2,625
- Northeast: 630
- Midwest: 662
- South: 1,176
- West: 148
92.2% of Taylor Creek residents lived in the same house 1 years ago.
Out of people who lived in different houses, 22.2% lived in this county.
Out of people who lived in different counties, 46.0% lived in Florida.
| Taylor Creek: | 92.2% |
| State average: | 86.3% |
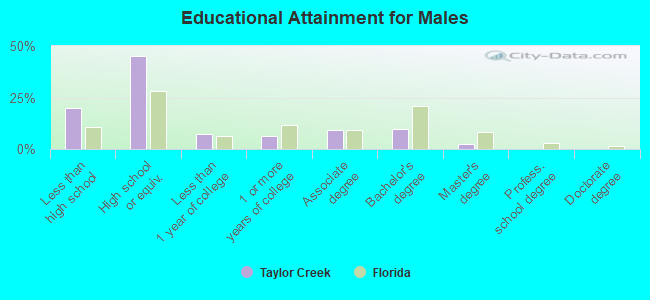
Education attainment for males 25 years and older:
- No schooling: 22
- Nursery to 4th grade: 0
- 5th and 6th grade: 53
- 7th and 8th grade: 0
- 9th grade: 80
- 10th grade: 56
- 11th grade: 29
- 12th grade, no diploma: 124
- High school graduate (or equivalency): 829
- Less than 1 year of college: 136
- Some college more than 1 year, no degree: 115
- Associate degree: 166
- Bachelor's degree: 176
- Master's degree: 46
- Professional school degree: 0
- Doctorate degree: 0
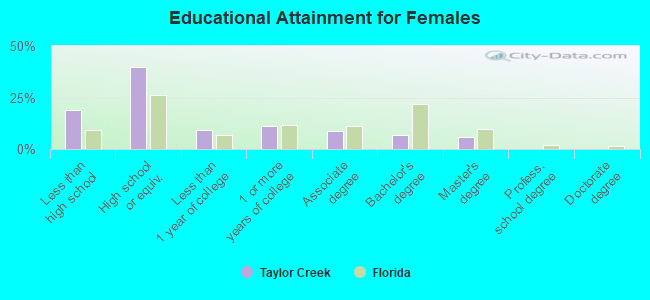
Education attainment for females 25 years and older:
- No schooling: 66
- Nursery to 4th grade: 0
- 5th and 6th grade: 96
- 7th and 8th grade: 9
- 9th grade: 97
- 10th grade: 9
- 11th grade: 27
- 12th grade, no diploma: 15
- High school graduate (or equivalency): 671
- Less than 1 year of college: 152
- Some college more than 1 year, no degree: 188
- Associate degree: 147
- Bachelor's degree: 111
- Master's degree: 98
- Professional school degree: 0
- Doctorate degree: 0


Housing units in structures:
- One, detached: 991
- One, attached: 8
- Two: 8
- 5 to 9: 109
- 20 to 49: 11
- Mobile homes: 1,562
- Boats, RVs, vans, etc.: 98
Median worth of mobile homes: $97,528
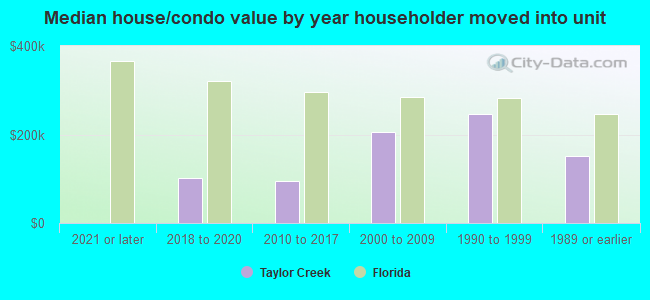
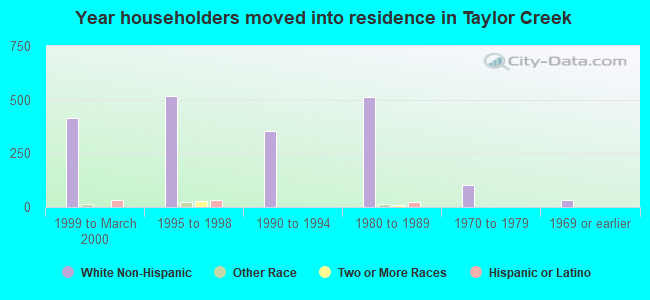
House/condo owner moved in on average 7 years ago
Renter moved in on average 5 years ago
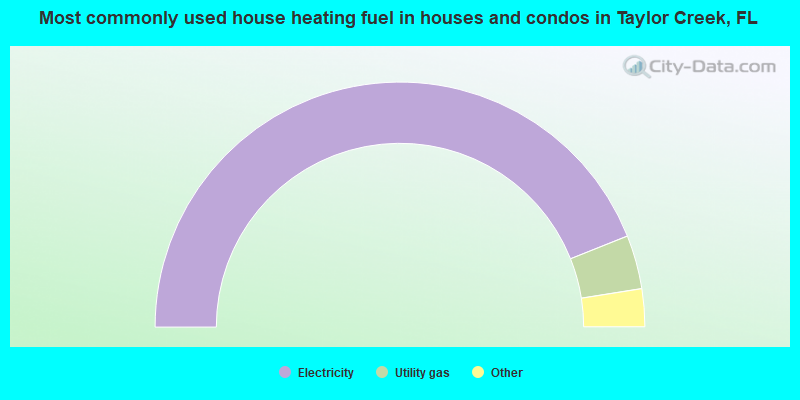
- 87.9%Electricity
- 7.1%Utility gas
- 2.8%Bottled, tank, or LP gas
- 2.1%No fuel used
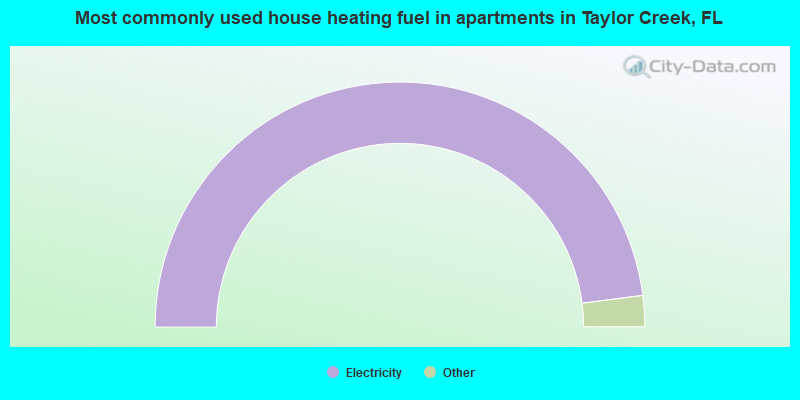
- 96.0%Electricity
- 2.5%Fuel oil, kerosene, etc.
- 1.5%No fuel used
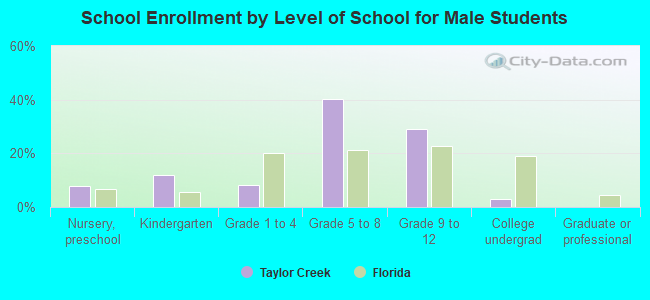
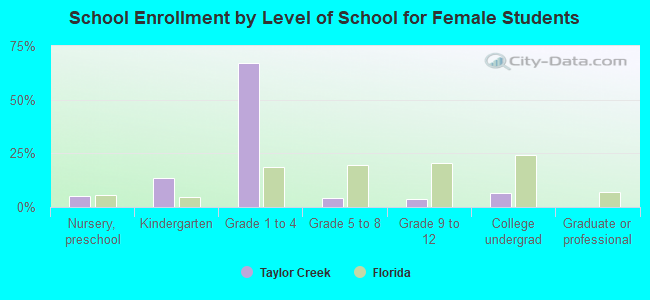
Private vs. public school enrollment:
| Here: | 0.0% |
| Florida: | 15.8% |
| Here: | 0.0% |
| Florida: | 12.9% |
| Here: | 42.5% |
| Florida: | 23.6% |