Syosset, NY (New York) Houses and Residents
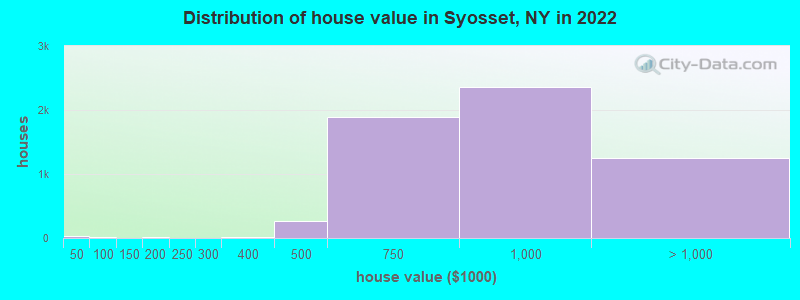
Estimated median house or condo value in 2022: $842,986 (it was $325,800 in 2000 )
Syosset:
$842,986New York:
$400,400
Lower value quartile - upper value quartile: $673,926 - $1,011,063Mean price in 2022: Detached houses: $934,697 Here:
$934,697State:
$476,719
Townhouses or other attached units: $755,620 Here:
$755,620State:
$699,270
In 2-unit structures: $523,370 Here:
$523,370State:
$713,077
In 3-to-4-unit structures: $378,260 Here:
$378,260State:
$764,568
Total population: 18,829 (Urban population: 18,544, Rural population: 0)
Houses: 6,300 (6,133 occupied: 5,606 owner occupied, 516 renter occupied )
% of renters here:
8%State:
46%
Housing density: 1,264 houses/condos per square mile
Median price asked for vacant for-sale houses and condos in 2022: $4,871,719.
Median gross rent in Syosset, NY in 2022: $-628,812,763
Housing units in Syosset with a mortgage: 3,430 (485 second mortgage, 15 home equity loan, 440 both second mortgage and home equity loan )Houses without a mortgage: 169
Median household income for houses/condos with a mortgage: $234,262
Median household income for apartments without a mortgage: $119,668
Median monthly housing costs: $3,216
Data:
Median house or condo value ($)
Median house or condo value ($ change since 2000)
Median house or condo value ($) - White
Median house or condo value ($) - Black or African American
Median house or condo value ($) - Asian
Median house or condo value ($) - Hispanic or Latino
Median house or condo value ($) - American Indian and Alaska Native
Median house or condo value ($) - Multirace
Median house or condo value ($) - Other Race
Median price asked for mobile homes ($)
Household density (households per square mile)
Mean house or condo value by units in structure - 1, detached ($)
Mean house or condo value by units in structure - 1, attached ($)
Mean house or condo value by units in structure - 2 ($)
Mean house or condo value by units in structure by units in structure - 3 or 4 ($)
Mean house or condo value by units in structure - 5 or more ($)
Mean house or condo value by units in structure - Boat, RV, van, etc. ($)
Mean house or condo value by units in structure - Mobile home ($)
Median contract rent ($)
Median contract rent - Lower quartile ($)
Median contract rent - Upper quartile ($)
Median gross rent ($)
Urban houses (%)
Rural houses (%)
Houses occupied (%)
Houses occupied (% change since 2000)
Houses owner occupied (%)
Houses owner occupied (% change since 2000)
Houses renter occupied (%)
Houses renter occupied (% change since 2000)
Vacant housing units - For rent (%)
Vacant housing units - For rent (% change since 2000)
Vacant housing units - For sale only (%)
Vacant housing units - For sale only (% change since 2000)
Vacant housing units - Rented or sold, not occupied (%)
Vacant housing units - Rented or sold, not occupied (% change since 2000)
Vacant housing units - For seasonal, recreational, or occasional use (%)
Vacant housing units - For seasonal, recreational, or occasional use (% change since 2000)
Vacant housing units - For migrant workers (%)
Vacant housing units - For migrant workers (% change since 2000)
Vacant housing units - Other vacant (%)
Vacant housing units - Other vacant (% change since 2000)
Median monthly housing costs ($)
Median household income for houses/condos with a mortgage ($)
Median household income for houses/condos without a mortgage ($)
Median household income ($)
Median household income ($) - White
Median household income ($) - Black or African American
Median household income ($) - Asian
Median household income ($) - Hispanic or Latino
Median household income ($) - American Indian and Alaska Native
Median household income ($) - Multirace
Median household income ($) - Other Race
Mortgage status - with mortgage (%)
Mortgage status - with second mortgage (%)
Mortgage status - with home equity loan (%)
Mortgage status - with both second mortgage and home equity loan (%)
Mortgage status - without a mortgage (%)
Median year house/condo built
Median year apartment built
Household type by relationship - Male householder living alone (%)
Household type by relationship - Male householder not living alone (%)
Household type by relationship - Female householder living alone (%)
Household type by relationship - Female householder not living alone (%)
Household type by relationship - Opposite-Sex spouse (%)
Household type by relationship - Same-Sex spouse (%)
Household type by relationship - Opposite-Sex unmarried partner (%)
Household type by relationship - Same-Sex unmarried partner (%)
Household type by relationship - In group quarters (%)
Size of family households - 2-person household (%)
Size of family households - 3-person household (%)
Size of family households - 4-person household (%)
Size of family households - 5-person household (%)
Size of family households - 6-person household (%)
Size of family households - 7-or-more-person household (%)
Size of nonfamily households - 1-person household (%)
Size of nonfamily households - 2-person household (%)
Size of nonfamily households - 3-person household (%)
Size of nonfamily households - 4-person household (%)
Size of nonfamily households - 5-person household (%)
Size of nonfamily households - 6-person household (%)
Size of nonfamily households - 7-or-moreperson household (%)
Year house built - Built 2010 or later (%)
Year house built - Built 2000 to 2009 (%)
Year house built - Built 1990 to 1999 (%)
Year house built - Built 1980 to 1989 (%)
Year house built - Built 1970 to 1979 (%)
Year house built - Built 1960 to 1969 (%)
Year house built - Built 1950 to 1959 (%)
Year house built - Built 1940 to 1949 (%)
Year house built - Built 1939 or earlier (%)
Median number of rooms in houses and condos
Median number of rooms in apartments
Median number of bedrooms in owner occupied houses
Mean number of bedrooms in owner occupied houses
Median number of bedrooms in renter occupied houses
Mean number of bedrooms in renter occupied houses
Median number of vehichles in owner occupied houses
Mean number of vehichles in owner occupied houses
Median number of vehichles in renter occupied houses
Mean number of vehichles in renter occupied houses
Rooms in owner-occupied houses - 1 room (%)
Rooms in owner-occupied houses - 2 rooms (%)
Rooms in owner-occupied houses - 3 rooms (%)
Rooms in owner-occupied houses - 4 rooms (%)
Rooms in owner-occupied houses - 5 rooms (%)
Rooms in owner-occupied houses - 6 rooms (%)
Rooms in owner-occupied houses - 7 rooms (%)
Rooms in owner-occupied houses - 8 rooms (%)
Rooms in owner-occupied houses - 9+ rooms (%)
Rooms in renter-occupied houses - 1 room (%)
Rooms in renter-occupied houses - 2 rooms (%)
Rooms in renter-occupied houses - 3 rooms (%)
Rooms in renter-occupied houses - 4 rooms (%)
Rooms in renter-occupied houses - 5 rooms (%)
Rooms in renter-occupied houses - 6 rooms (%)
Rooms in renter-occupied houses - 7 rooms (%)
Rooms in renter-occupied houses - 8 rooms (%)
Rooms in renter-occupied houses - 9+ rooms (%)
Bedrooms in owner-occupied houses - no bedrooms (%)
Bedrooms in owner-occupied houses - 1 bedroom (%)
Bedrooms in owner-occupied houses - 2 bedrooms (%)
Bedrooms in owner-occupied houses - 3 bedrooms (%)
Bedrooms in owner-occupied houses - 4 bedrooms (%)
Bedrooms in owner-occupied houses - 5+ bedrooms (%)
Bedrooms in renter-occupied houses - no bedrooms (%)
Bedrooms in renter-occupied houses - 1 bedroom (%)
Bedrooms in renter-occupied houses - 2 bedrooms (%)
Bedrooms in renter-occupied houses - 3 bedrooms (%)
Bedrooms in renter-occupied houses - 4 bedrooms (%)
Bedrooms in renter-occupied houses - 5+ bedrooms (%)
Vehicles available in owner-occupied houses - no vehicle available (%)
Vehicles available in owner-occupied houses - 1 vehicle available(%)
Vehicles available in owner-occupied houses - 2 Vehicles available (%)
Vehicles available in owner-occupied houses - 3 Vehicles available (%)
Vehicles available in owner-occupied houses - 4 Vehicles available (%)
Vehicles available in owner-occupied houses - 5+ Vehicles available (%)
Vehicles available in renter-occupied houses - no vehicle available (%)
Vehicles available in renter-occupied houses - 1 vehicle available (%)
Vehicles available in renter-occupied houses - 2 Vehicles available (%)
Vehicles available in renter-occupied houses - 3 Vehicles available (%)
Vehicles available in renter-occupied houses - 4 Vehicles available (%)
Vehicles available in renter-occupied houses - 5+ Vehicles available (%)
Housing units in structures - 1, detached (%)
Housing units in structures - 1, attached (%)
Housing units in structures - 2 (%)
Housing units in structures - 3 or 4 (%)
Housing units in structures - 5 to 9 (%)
Housing units in structures - 10 to 19 (%)
Housing units in structures - 20 to 49 (%)
Housing units in structures - 50 or more (%)
Housing units in structures - Mobile home (%)
Housing units in structures - Boat, RV, van, etc. (%)
Housing units in structures - Owners - 1, detached (%)
Housing units in structures - Owners - 1, attached (%)
Housing units in structures - Owners - 2 (%)
Housing units in structures - Owners - 3 or 4 (%)
Housing units in structures - Owners - 5 to 9 (%)
Housing units in structures - Owners - 10 to 19 (%)
Housing units in structures - Owners - 20 to 49 (%)
Housing units in structures - Owners - 50 or more (%)
Housing units in structures - Owners - Mobile home (%)
Housing units in structures - Owners - Boat, RV, van, etc. (%)
Housing units in structures - Renters - 1, detached (%)
Housing units in structures - Renters - 1, attached (%)
Housing units in structures - Renters - 2 (%)
Housing units in structures - Renters - 3 or 4 (%)
Housing units in structures - Renters - 5 to 9 (%)
Housing units in structures - Renters - 10 to 19 (%)
Housing units in structures - Renters - 20 to 49 (%)
Housing units in structures - Renters - 50 or more (%)
Housing units in structures - Renters - Mobile home (%)
Housing units in structures - Renters - Boat, RV, van, etc. (%)
House/condo owner moved in on average (years ago)
Renter moved in on average (years ago)
Year householder moved into unit - Moved in 1999 to March 2000 (%)
Year householder moved into unit - Moved in 1999 to March 2000 (%) - White
Year householder moved into unit - Moved in 1999 to March 2000 (%) - Black or African American
Year householder moved into unit - Moved in 1999 to March 2000 (%) - Asian
Year householder moved into unit - Moved in 1999 to March 2000 (%) - Hispanic or Latino
Year householder moved into unit - Moved in 1999 to March 2000 (%) - American Indian and Alaska Native
Year householder moved into unit - Moved in 1999 to March 2000 (%) - Multirace
Year householder moved into unit - Moved in 1999 to March 2000 (%) - Other Race
Year householder moved into unit - Moved in 1995 to 1998 (%)
Year householder moved into unit - Moved in 1995 to 1998 (%) - White
Year householder moved into unit - Moved in 1995 to 1998 (%) - Black or African American
Year householder moved into unit - Moved in 1995 to 1998 (%) - Asian
Year householder moved into unit - Moved in 1995 to 1998 (%) - Hispanic or Latino
Year householder moved into unit - Moved in 1995 to 1998 (%) - American Indian and Alaska Native
Year householder moved into unit - Moved in 1995 to 1998 (%) - Multirace
Year householder moved into unit - Moved in 1995 to 1998 (%) - Other Race
Year householder moved into unit - Moved in 1990 to 1994 (%)
Year householder moved into unit - Moved in 1990 to 1994 (%) - White
Year householder moved into unit - Moved in 1990 to 1994 (%) - Black or African American
Year householder moved into unit - Moved in 1990 to 1994 (%) - Asian
Year householder moved into unit - Moved in 1990 to 1994 (%) - Hispanic or Latino
Year householder moved into unit - Moved in 1990 to 1994 (%) - American Indian and Alaska Native
Year householder moved into unit - Moved in 1990 to 1994 (%) - Multirace
Year householder moved into unit - Moved in 1990 to 1994 (%) - Other Race
Year householder moved into unit - Moved in 1980 to 1989 (%)
Year householder moved into unit - Moved in 1980 to 1989 (%) - White
Year householder moved into unit - Moved in 1980 to 1989 (%) - Black or African American
Year householder moved into unit - Moved in 1980 to 1989 (%) - Asian
Year householder moved into unit - Moved in 1980 to 1989 (%) - Hispanic or Latino
Year householder moved into unit - Moved in 1980 to 1989 (%) - American Indian and Alaska Native
Year householder moved into unit - Moved in 1980 to 1989 (%) - Multirace
Year householder moved into unit - Moved in 1980 to 1989 (%) - Other Race
Year householder moved into unit - Moved in 1970 to 1979 (%)
Year householder moved into unit - Moved in 1970 to 1979 (%) - White
Year householder moved into unit - Moved in 1970 to 1979 (%) - Black or African American
Year householder moved into unit - Moved in 1970 to 1979 (%) - Asian
Year householder moved into unit - Moved in 1970 to 1979 (%) - Hispanic or Latino
Year householder moved into unit - Moved in 1970 to 1979 (%) - American Indian and Alaska Native
Year householder moved into unit - Moved in 1970 to 1979 (%) - Multirace
Year householder moved into unit - Moved in 1970 to 1979 (%) - Other Race
Year householder moved into unit - Moved in 1969 or earlier (%)
Year householder moved into unit - Moved in 1969 or earlier (%) - White
Year householder moved into unit - Moved in 1969 or earlier (%) - Black or African American
Year householder moved into unit - Moved in 1969 or earlier (%) - Asian
Year householder moved into unit - Moved in 1969 or earlier (%) - Hispanic or Latino
Year householder moved into unit - Moved in 1969 or earlier (%) - American Indian and Alaska Native
Year householder moved into unit - Moved in 1969 or earlier (%) - Multirace
Year householder moved into unit - Moved in 1969 or earlier (%) - Other Race
Housing units lacking complete plumbing facilities (%)
Housing units lacking complete kitchen facilities (%)
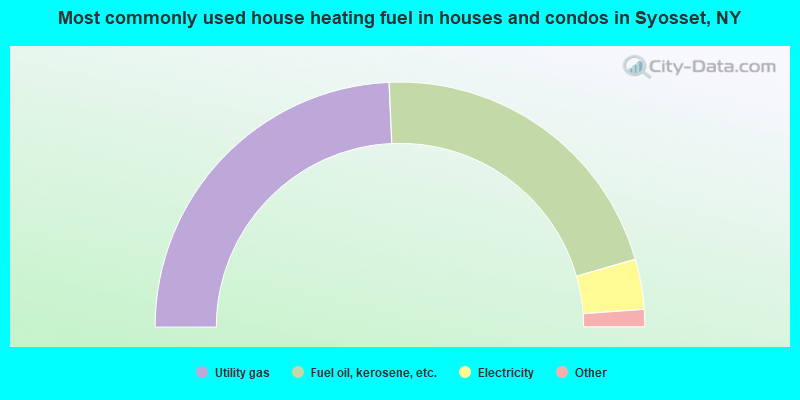
House heating fuel used in houses and condos - Utility gas (%)
House heating fuel used in houses and condos - Bottled, tank, or LP gas (%)
House heating fuel used in houses and condos - Electricity (%)
House heating fuel used in houses and condos - Fuel oil, kerosene, etc. (%)
House heating fuel used in houses and condos - Coal or coke (%)
House heating fuel used in houses and condos - Wood (%)
House heating fuel used in houses and condos - Solar energy (%)
House heating fuel used in houses and condos - Other fuel (%)
House heating fuel used in houses and condos - No fuel used (%)
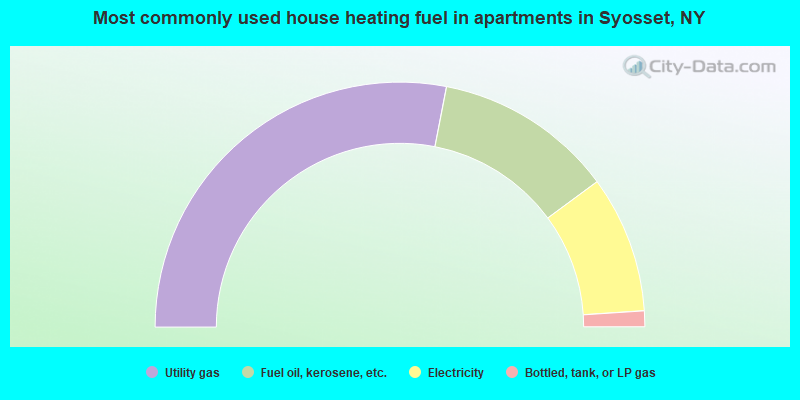
House heating fuel used in apartments - Utility gas (%)
House heating fuel used in apartments - Bottled, tank, or LP gas (%)
House heating fuel used in apartments - Electricity (%)
House heating fuel used in apartments - Fuel oil, kerosene, etc. (%)
House heating fuel used in apartments - Coal or coke (%)
House heating fuel used in apartments - Wood (%)
House heating fuel used in apartments - Solar energy (%)
House heating fuel used in apartments - Other fuel (%)
House heating fuel used in apartments - No fuel used (%)
Latest news about housing in Syosset, NY collected exclusively by city-data.com from local newspapers, TV, and radio stations
Median year house/condo built: 1958Median year apartment built: 1973Household type by relationship:
Households: 18,733
Male householders: 3,339 (386 living alone ), Female householders: 2,741 (470 living alone )4,696 spouses (4,682 opposite-sex spouses ), 127 unmarried partners , (117 opposite-sex unmarried partners ), 6,787 children (6,741 natural , 30 adopted , 14 stepchildren ), 165 grandchildren , 54 brothers or sisters , 347 parents , 0 foster children , 128 other relatives , 168 non-relatives In group quarters: 176
Size of family households: 1,500 2-persons , 1,416 3-persons , 1,485 4-persons , 567 5-persons , 123 6-persons , 41 7-or-more-persons .
Size of nonfamily households: 893 1-person , 39 2-persons , 20 3-persons .
4,533 married couples with children. single-parent households (82 men , 122 women ).
64.1% of residents of Syosset speak English at home. of residents speak Spanish at home (71% speak English very well , 8% speak English well , 14% speak English not well , 8% don't speak English at all ).of residents speak other Indo-European language at home (85% speak English very well , 9% speak English well , 5% speak English not well , 1% don't speak English at all ).of residents speak Asian or Pacific Island language at home (63% speak English very well , 21% speak English well , 16% speak English not well , 1% don't speak English at all ).of residents speak other language at home (96% speak English very well , 4% speak English well ).
Foreign born population: 4,792 (25.6%)of them are naturalized citizens )
Median number of rooms in houses and condos:
Median number of rooms in apartments
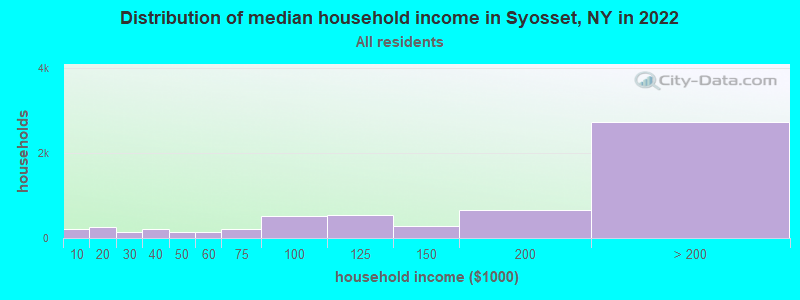
Syosset, NY household income distribution 202 Less than $10,000263 $10,000 to $19,999146 $20,000 to $29,999216 $30,000 to $39,999152 $40,000 to $49,999150 $50,000 to $59,999212 $60,000 to $74,999513 $75,000 to $99,999549 $100,000 to $124,999293 $125,000 to $149,999667 $150,000 to $199,9992,728 $200,000 or more
Home value of owner - occupied houses in 2022 in Syosset, NY 27 Less than $10,00011 $50,000 to $59,99911 $70,000 to $79,99910 $175,000 to $199,9995 $200,000 to $249,99922 $300,000 to $399,999259 $400,000 to $499,9991,885 $500,000 to $749,9992,365 $750,000 to $999,999924 $1,000,000 to $1,499,999259 $1,500,000 to $1,999,99971 $2,000,000 or moreRent paid by renters in 2022 in Syosset, NY 32 $250 to $29970 $300 to $349100 $400 to $44920 $500 to $54922 $1,250 to $1,49915 $2,000 to $2,49958 $2,500 to $2,99940 $3,000 to $3,499111 $3,500 or more32 No cash rent
Percentage of workers working in this county: 60.6%Number of people working at home: 1,934 (22.3% of all workers )
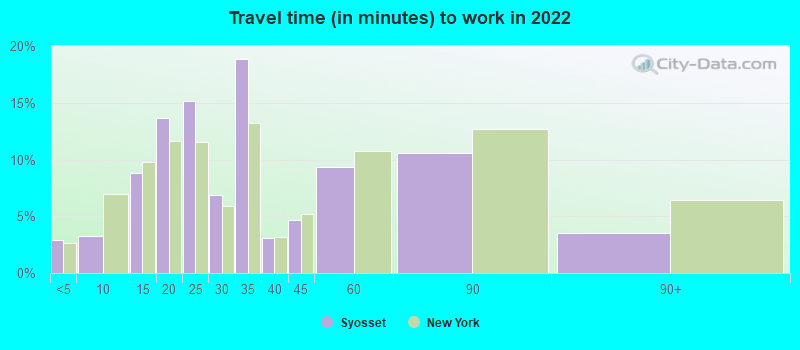
Travel time to work (commute)
Less than 5 minutes: 1975 to 9 minutes: 38110 to 14 minutes: 82715 to 19 minutes: 55420 to 24 minutes: 61325 to 29 minutes: 43230 to 34 minutes: 64335 to 39 minutes: 12940 to 44 minutes: 44245 to 59 minutes: 64760 to 89 minutes: 1,20090 or more minutes: 811
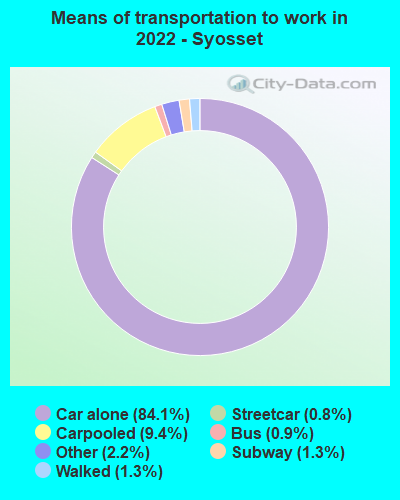
Means of transportation to work:
Drove a car alone: 8,991 (70.8%)Carpooled: 974 (7.7%)Bus : 93 (0.7%)Subway or elevated rail : 77 (0.6%)Long-distance train or commuter rail : 118 (0.9%)Taxi: 332 (2.6%)Bicycle: 7 (0.1%)Walked: 150 (1.2%)Worked at home: 1,934 (15.2%)
Unemployment by race in 2022
Unemployment rate for White non-Hispanic residents 4.0% Males4.1% FemalesUnemployment rate for Asian residents 2.4% Males0.6% FemalesUnemployment rate for other race residents 14.0% MalesUnemployment rate for Hispanic or Latino residents 7.0% Males
Year of entry for the foreign-born population in Syosset, New York
950 2010 or later 1,063 2000 to 2009 1,197 1990 to 1999 843 1980 to 1989 641 1970 to 1979 1,060 Before 1970
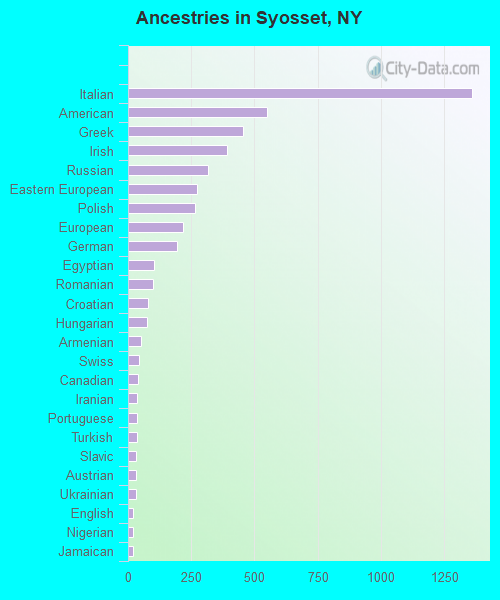
First ancestries reported:
Italian: 1,359 (12.8%)
American: 548 (5.1%)
Greek: 453 (4.3%)
Irish: 392 (3.7%)
Russian: 315 (3.0%)
Eastern European: 271 (2.5%)
Polish: 265 (2.5%)
European: 217 (2.0%)
German: 192 (1.8%)
Egyptian: 104 (1.0%)
Romanian: 99 (0.9%)
Croatian: 80 (0.8%)
Hungarian: 74 (0.7%)
Armenian: 51 (0.5%)
Swiss: 44 (0.4%)
Canadian: 38 (0.4%)
Iranian: 37 (0.3%)
Portuguese: 35 (0.3%)
Turkish: 35 (0.3%)
Slavic: 33 (0.3%)
Austrian: 32 (0.3%)
Ukrainian: 32 (0.3%)
English: 20 (0.2%)
Nigerian: 20 (0.2%)
Jamaican: 20 (0.2%)
Israeli: 17 (0.2%)
Iraqi: 16 (0.2%)
Estonian: 15 (0.1%)
Scotch-Irish: 15 (0.1%)
Lithuanian: 13 (0.1%)
Slovak: 9 (0.08%)
Czech: 7 (0.07%)
British: 5 (0.05%) Most common places of birth for foreign-born residents (%): China, excluding Hong Kong and Taiwan Syosset:
24.3% (1,126)New York:
9.1% (410,910)
India Syosset:
17.9% (828)New York:
3.5% (158,432)
Korea Syosset:
13.5% (627)New York:
1.8% (82,786)
Hong Kong Syosset:
4.9% (229)New York:
0.9% (42,220)
Uruguay Syosset:
3.1% (143)New York:
0.1% (5,566)
Egypt Syosset:
2.8% (128)New York:
0.6% (27,385)
Taiwan Syosset:
2.0% (92)New York:
0.7% (30,619)
Bangladesh Syosset:
2.0% (92)New York:
2.6% (117,288)
Europe, n.e.c. Syosset:
1.8% (83)New York:
0.1% (2,567)
Canada Syosset:
1.8% (82)New York:
1.3% (59,107)
Greece Syosset:
1.7% (79)New York:
0.6% (28,604)
Dominican Republic Syosset:
1.6% (75)New York:
11.1% (501,040)
Place of birth for U.S.-born residents:
This state: 12,498Other state: 1,193Northeast: 521Midwest: 241South: 339West: 86 92.0% of Syosset residents lived in the same house 1 years ago.
Out of people who lived in different houses, 20.9% lived in this county.
Out of people who lived in different counties, 90.9% lived in New York.
Syosset:
92.0%State average:
89.6%
Education attainment for males 25 years and older:
No schooling: 24Nursery to 4th grade: 245th and 6th grade: 97th and 8th grade: 379th grade: 1210th grade: 011th grade: 012th grade, no diploma: 56High school graduate (or equivalency): 767Less than 1 year of college: 207Some college more than 1 year, no degree: 348Associate degree: 418Bachelor's degree: 1,800Master's degree: 1,319Professional school degree: 806Doctorate degree: 278
Education attainment for females 25 years and older:
No schooling: 84Nursery to 4th grade: 225th and 6th grade: 67th and 8th grade: 499th grade: 1010th grade: 011th grade: 1012th grade, no diploma: 88High school graduate (or equivalency): 617Less than 1 year of college: 284Some college more than 1 year, no degree: 340Associate degree: 423Bachelor's degree: 2,390Master's degree: 1,688Professional school degree: 437Doctorate degree: 104
Housing units in structures:
One, detached: 5,596One, attached: 282Two: 1663 or 4: 385 to 9: 4510 to 19: 11050 or more: 52Mobile homes: 9Housing units lacking complete plumbing facilities in 2022: 0.1%Housing units lacking complete kitchen facilities in 2022: 0.4%House/condo owner moved in on average 15 years ago
Renter moved in on average 2 years ago
Private vs. public school enrollment:
Students in private schools in grades 1 to 8 (elementary and middle school): 52 Students in private schools in grades 9 to 12 (high school): 46 Students in private undergraduate colleges: 289