St. Paul, OR (Oregon) Houses and Residents
| St. Paul: | $523,234 |
| Oregon: | $475,600 |
Mean price in 2022:
Detached houses: $485,033
Here: $485,033 State: $562,872
Total population: 430 (Urban population: 0, Rural population: 382 (all nonfarm))
Houses: 140 (140 occupied: 118 owner occupied, 23 renter occupied)
| % of renters here: | 16% |
| State: | 37% |
Housing density: 487 houses/condos per square mile
Median price asked for vacant for-sale houses and condos in 2022 in this county: $312,124.
Median contract rent in 2022: $1,232 (lower quartile is $977, upper quartile is $1,415)
Median gross rent in St. Paul, OR in 2022: $1,531
Housing units in St. Paul with a mortgage: 71 (4 second mortgage, 0 home equity loan, 4 both second mortgage and home equity loan)
Houses without a mortgage: 0
Median household income for houses/condos with a mortgage: $126,659
Median household income for apartments without a mortgage: $60,045
Median monthly housing costs: $1,645
Compare current foreclosures near St. Paul, OR:
| Photo | Address | Area | Beds / Baths | Price | Details |
|---|---|---|---|---|---|

|
#1
Woodland Ave
Woodburn, OR 97071
|
1,708 sq. feet
|
2 baths 3 beds |
$390,000
|
show details |

|
#2
S Olive St
Yamhill, OR 97148
|
1,696 sq. feet
|
2 baths 3 beds |
show details | |

|
#3
Dearborn Ave NE
Salem, OR 97303
|
1,656 sq. feet
|
2 baths 3 beds |
show details | |

|
#4
Umpqua Rd
Woodburn, OR 97071
|
922 sq. feet
|
2 baths 2 beds |
show details | |

|
#5
N Main St
Newberg, OR 97132
|
1,422 sq. feet
|
1 baths 2 beds |
show details | |

|
#6
W Lincoln St
Woodburn, OR 97071
|
952 sq. feet
|
1 baths 3 beds |
show details | |

|
#7
SW King George Dr
Portland, OR 97224
|
1,136 sq. feet
|
1 baths 2 beds |
show details | |

|
#8
SW Snowdale St Unit 104
Beaverton, OR 97007
|
655 sq. feet
|
1 baths 1 beds |
show details | |

|
#9
Joels Pl
Lafayette, OR 97127
|
1,338 sq. feet
|
2 baths 3 beds |
show details | |

|
#10
SW Tanoak Ln
Tualatin, OR 97062
|
1,430 sq. feet
|
3 baths 3 beds |
show details |
| Photo | Address | Area | Beds / Baths | Price | Details |
|---|---|---|---|---|---|

|
#11
Blaine St
Woodburn, OR 97071
|
1,056 sq. feet
|
1 baths 4 beds |
show details | |

|
#12
SW Lucas Dr
Tualatin, OR 97062
|
2,280 sq. feet
|
3 baths 3 beds |
show details | |

|
#13
SW Mohawk St
Tualatin, OR 97062
|
852 sq. feet
|
1 baths 2 beds |
show details | |

|
#14
Teal Ln NE
Aurora, OR 97002
|
- sq. feet
|
2 baths 3 beds |
show details | |

|
#15
Morfitt St
Hubbard, OR 97032
|
1,620 sq. feet
|
2 baths 3 beds |
show details | |

|
#16
S Linda Ln
Canby, OR 97013
|
1,848 sq. feet
|
2 baths 3 beds |
show details | |

|
#17
SW 126th Ave
Portland, OR 97224
|
3,896 sq. feet
|
2 baths 4 beds |
show details | |

|
#18
NE Golden Leaf Ln
Mcminnville, OR 97128
|
2,490 sq. feet
|
3 baths 4 beds |
show details | |

|
#19
Arcade Ave NE
Salem, OR 97303
|
1,495 sq. feet
|
1 baths 3 beds |
show details | |

|
#20
N Locust St
Canby, OR 97013
|
1,301 sq. feet
|
1 baths 2 beds |
show details |
| Photo | Address | Area | Beds / Baths | Price | Details |
|---|---|---|---|---|---|

|
#21
Sagrada Cir N
Salem, OR 97303
|
1,460 sq. feet
|
2 baths 3 beds |
show details | |

|
#22
SE 3rd Ave
Canby, OR 97013
|
828 sq. feet
|
1 baths 2 beds |
show details | |

|
#23
Hazelgreen Rd NE
Salem, OR 97305
|
1,236 sq. feet
|
2 baths 3 beds |
show details | |

|
#24
SW 102nd Pl
Tualatin, OR 97062
|
2,199 sq. feet
|
2 baths 3 beds |
show details | |

|
#25
SE Logan Ln
Dundee, OR 97115
|
1,200 sq. feet
|
2 baths 3 beds |
show details | |

|
#26
SW Neugebauer Rd
Hillsboro, OR 97123
|
3,030 sq. feet
|
3 baths 3 beds |
show details | |

|
#27
SW Brown St
Tualatin, OR 97062
|
3,131 sq. feet
|
3 baths 5 beds |
show details | |

|
#28
SW Ash Meadows Blvd Apt 19
Wilsonville, OR 97070
|
1,240 sq. feet
|
2 baths 2 beds |
show details | |

|
#29
SW Ruth St
Wilsonville, OR 97070
|
1,644 sq. feet
|
2 baths 3 beds |
show details | |

|
#30
SW Aspen Ridge Dr
Portland, OR 97224
|
4,339 sq. feet
|
3 baths 4 beds |
show details |
| Photo | Address | Area | Beds / Baths | Price | Details |
|---|---|---|---|---|---|

|
#31
Crater Ave N
Salem, OR 97303
|
1,297 sq. feet
|
2 baths 3 beds |
show details | |

|
#32
Middle Grove Dr NE
Salem, OR 97305
|
1,392 sq. feet
|
2 baths 3 beds |
show details | |

|
#33
SW Sagehen St
Beaverton, OR 97007
|
1,666 sq. feet
|
2 baths 2 beds |
show details | |

|
#34
NE Dog Ridge Rd
Newberg, OR 97132
|
4,208 sq. feet
|
3 baths 3 beds |
show details | |

|
#35
SW Canterbury Ln Ste 103
Portland, OR 97224
|
1,373 sq. feet
|
3 baths 3 beds |
show details | |

|
#36
Northgate Ave NE
Salem, OR 97301
|
1,204 sq. feet
|
2 baths 3 beds |
show details | |

|
#37
Steven St
Woodburn, OR 97071
|
1,476 sq. feet
|
2 baths 3 beds |
show details | |

|
#38
Portland Rd Ne, Unit 8
Salem, OR 97305
|
1,152 sq. feet
|
2 baths 2 beds |
show details | |

|
#39
S Knott St
Canby, OR 97013
|
2,802 sq. feet
|
3 baths 6 beds |
show details | |

|
#40
S West Sagehen St
Beaverton, OR 97007
|
1,666 sq. feet
|
2 baths 2 beds |
show details |
| Photo | Address | Area | Beds / Baths | Price | Details |
|---|---|---|---|---|---|

|
#41
SW Sattler St
Portland, OR 97224
|
2,048 sq. feet
|
2 baths 4 beds |
show details | |

|
#42
SW Canterbury Ln Ste 103
Portland, OR 97224
|
1,028 sq. feet
|
3 baths 2 beds |
show details | |

|
#43
Lockhaven Dr NE
Salem, OR 97303
|
1,219 sq. feet
|
2 baths 2 beds |
show details | |

|
#44
Chemawa Rd NE
Salem, OR 97303
|
1,060 sq. feet
|
1 baths 2 beds |
show details | |

|
#45
Wooddale Ave NE
Salem, OR 97301
|
1,193 sq. feet
|
1 baths 3 beds |
show details | |

|
#46
Baker Creek Rd
Mcminnville, OR 97128
|
2,594 sq. feet
|
2 baths 3 beds |
show details | |

|
#47
Brian Ct NE
Salem, OR 97303
|
2,463 sq. feet
|
2 baths 4 beds |
show details | |

|
#48
Kalmia Dr NE
Salem, OR 97303
|
1,892 sq. feet
|
2 baths 4 beds |
show details | |

|
#49
N Ivy St
Canby, OR 97013
|
2,830 sq. feet
|
2 baths 4 beds |
show details | |

|
Check over 1 million property listings on Foreclosure.com!
|
browse all offers | |||


Median year apartment built: 2002
Household type by relationship:
Households: 402- Male householders: 58 (5 living alone), Female householders: 79 (21 living alone)
106 spouses (106 opposite-sex spouses), 3 unmarried partners, (3 opposite-sex unmarried partners), 116 children (111 natural, 5 adopted, 0 stepchildren), 10 grandchildren, 6 brothers or sisters, 7 parents, 0 foster children, 1 other relatives, 15 non-relatives
Size of family households: 45 2-persons, 16 3-persons, 21 4-persons, 10 5-persons, 11 6-persons.
Size of nonfamily households: 28 1-person, 4 2-persons, 4 3-persons.
69 married couples with children.
6 single-parent households (6 men, 0 women).
88.2% of residents of St. Paul speak English at home.
9.7% of residents speak Spanish at home (95% speak English very well, 5% speak English well).
Foreign born population: 27 (6.7%)
(63.0% of them are naturalized citizens)
| Here: | 6.9 |
| State: | 6.2 |
| Here: | 5.2 |
| State: | 4.0 |

- Bedrooms in owner-occupied houses and condos in St. Paul, Oregon
- 1no bedroom
- 41 bedroom
- 122 bedrooms
- 583 bedrooms
- 364 bedrooms
- 65+ bedrooms

- Bedrooms in renter-occupied apartments in St. Paul, Oregon
- 0no bedroom
- 01 bedroom
- 52 bedrooms
- 183 bedrooms
- 14 bedrooms
- 05+ bedrooms

- Cars and other vehicles available in St. Paul in owner-occupied houses/condos
- 5no vehicle
- 101 vehicle
- 482 vehicles
- 243 vehicles
- 244 vehicles
- 75+ vehicles

- Cars and other vehicles available in St. Paul in renter-occupied apartments
- 1no vehicle
- 81 vehicle
- 92 vehicles
- 13 vehicles
- 44 vehicles
- 05+ vehicles

- Rooms in owner-occupied houses in St. Paul, Oregon
- 11 room
- 02 rooms
- 43 rooms
- 34 rooms
- 85 rooms
- 296 rooms
- 297 rooms
- 228 rooms
- 229+ rooms

- Rooms in renter-occupied apartments in St. Paul, Oregon
- 01 room
- 02 rooms
- 03 rooms
- 74 rooms
- 65 rooms
- 46 rooms
- 07 rooms
- 58 rooms
- 19+ rooms


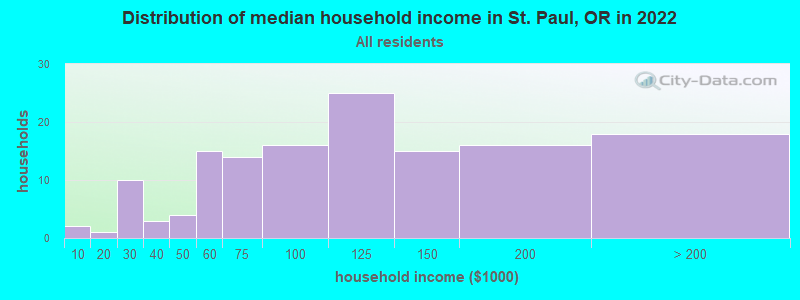
St. Paul, OR household income distribution

- 2Less than $10,000
- 1$10,000 to $19,999
- 10$20,000 to $29,999
- 3$30,000 to $39,999
- 4$40,000 to $49,999
- 15$50,000 to $59,999
- 14$60,000 to $74,999
- 16$75,000 to $99,999
- 25$100,000 to $124,999
- 15$125,000 to $149,999
- 16$150,000 to $199,999
- 18$200,000 or more
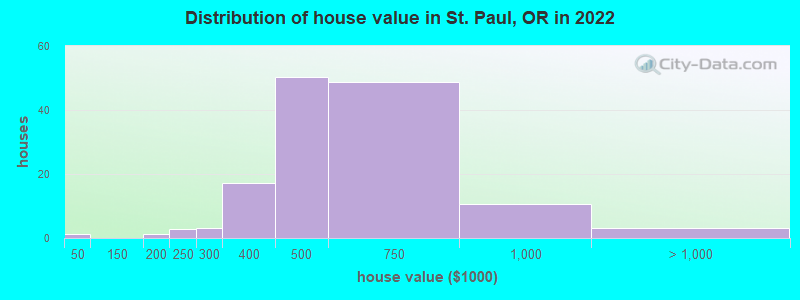
Home value of owner - occupied houses in 2022 in St. Paul, OR
-
- 1$35,000 to $39,999
- 0$150,000 to $174,999
- 0$175,000 to $199,999
- 2$200,000 to $249,999
- 3$250,000 to $299,999
- 17$300,000 to $399,999
- 50$400,000 to $499,999
- 48$500,000 to $749,999
- 10$750,000 to $999,999
- 3$1,000,000 to $1,499,999
Rent paid by renters in 2022 in St. Paul, OR
-
- 0$600 to $649
- 0$650 to $699
- 7$900 to $999
- 1$1,000 to $1,249
- 14$1,250 to $1,499

Percentage of workers working in this county: 61.7%
Number of people working at home: 21 (10.0% of all workers)
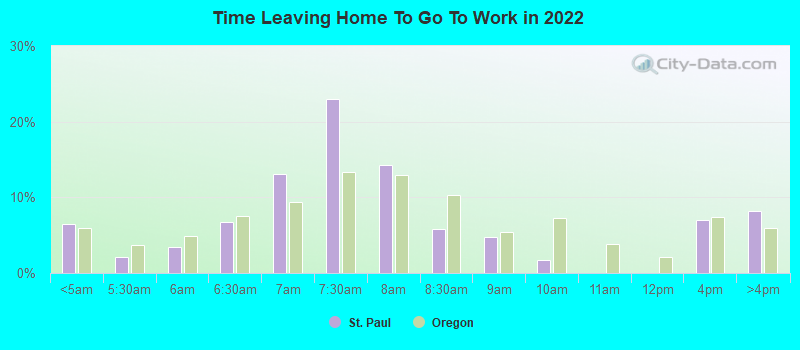
Travel time to work (commute)
- Less than 5 minutes: 24
- 5 to 9 minutes: 27
- 10 to 14 minutes: 16
- 15 to 19 minutes: 23
- 20 to 24 minutes: 20
- 25 to 29 minutes: 20
- 30 to 34 minutes: 12
- 35 to 39 minutes: 2
- 40 to 44 minutes: 13
- 45 to 59 minutes: 15
- 60 to 89 minutes: 1
- 90 or more minutes: 2
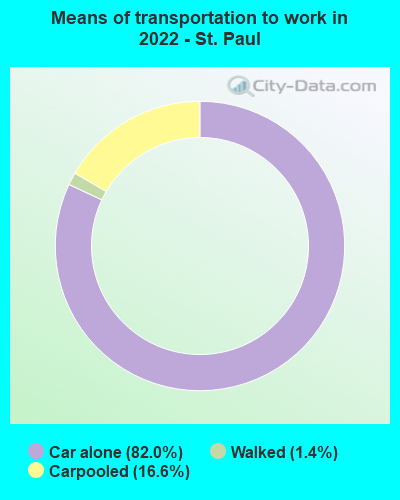
Means of transportation to work:
- Drove a car alone: 399 (74.6%)
- Carpooled: 69 (12.9%)
- Walked: 4 (0.7%)
- Worked at home: 35 (6.5%)
- Unemployment by race in 2022
- Unemployment rate for White non-Hispanic residents
- 1.1%Females

- Year of entry for the foreign-born population in St. Paul, Oregon
- 12010 or later
- 32000 to 2009
- 01990 to 1999
- 71980 to 1989
- 61970 to 1979
- 2Before 1970

First ancestries reported:
- English: 27 (15.7%)
- American: 24 (13.9%)
- German: 23 (13.3%)
- European: 10 (5.8%)
- Irish: 7 (4.1%)
- Dutch: 2 (1.2%)
- Italian: 2 (1.2%)
- Belgian: 1 (0.6%)
- French Canadian: 1 (0.6%)
- Polish: 1 (0.6%)
Most common places of birth for foreign-born residents (%):
| St. Paul: | 87.5% (21) |
| Oregon: | 33.9% (140,109) |
| St. Paul: | 4.2% (1) |
| Oregon: | 2.8% (11,450) |
Place of birth for U.S.-born residents:
- This state: 274
- Other state: 91
- Northeast: 3
- Midwest: 11
- South: 31
- West: 47
99.8% of St. Paul residents lived in the same house 1 years ago.
Out of people who lived in different houses, 50.0% lived in this county.
| St. Paul: | 99.8% |
| State average: | 85.5% |
Education attainment for males 25 years and older:
- No schooling: 0
- Nursery to 4th grade: 0
- 5th and 6th grade: 0
- 7th and 8th grade: 0
- 9th grade: 1
- 10th grade: 0
- 11th grade: 1
- 12th grade, no diploma: 0
- High school graduate (or equivalency): 43
- Less than 1 year of college: 13
- Some college more than 1 year, no degree: 11
- Associate degree: 11
- Bachelor's degree: 62
- Master's degree: 2
- Professional school degree: 0
- Doctorate degree: 0

Education attainment for females 25 years and older:
- No schooling: 0
- Nursery to 4th grade: 0
- 5th and 6th grade: 0
- 7th and 8th grade: 1
- 9th grade: 0
- 10th grade: 0
- 11th grade: 0
- 12th grade, no diploma: 2
- High school graduate (or equivalency): 43
- Less than 1 year of college: 16
- Some college more than 1 year, no degree: 22
- Associate degree: 18
- Bachelor's degree: 27
- Master's degree: 9
- Professional school degree: 0
- Doctorate degree: 0


Housing units in structures:
- One, detached: 134
- One, attached: 4
- Two: 1
- Mobile homes: 1
House/condo owner moved in on average 15 years ago
Renter moved in on average 6 years ago

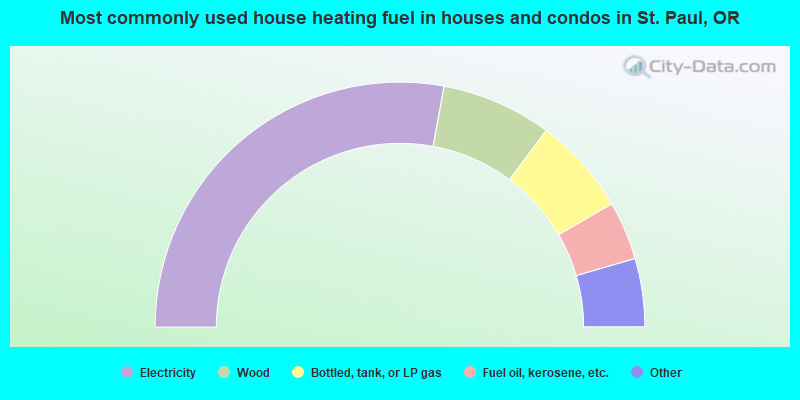
- 57.0%Electricity
- 14.9%Wood
- 13.2%Bottled, tank, or LP gas
- 7.9%Fuel oil, kerosene, etc.
- 3.5%Solar energy
- 1.8%Utility gas
- 0.9%Other fuel
- 0.9%No fuel used
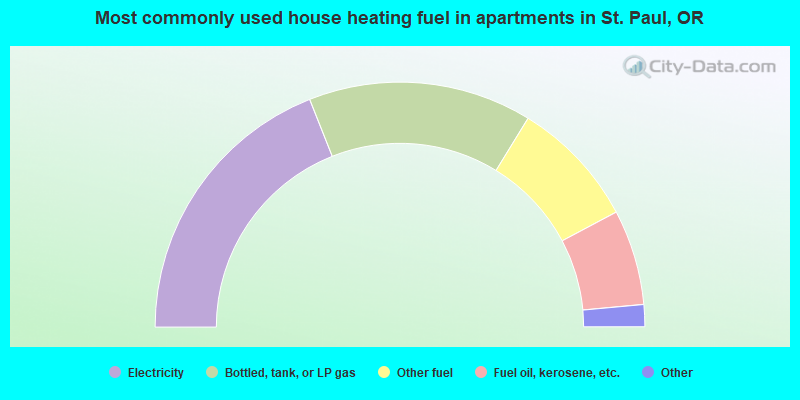
- 39.1%Electricity
- 30.4%Bottled, tank, or LP gas
- 17.4%Other fuel
- 13.0%Fuel oil, kerosene, etc.
Private vs. public school enrollment:
| Here: | 60.0% |
| Oregon: | 13.7% |
| Here: | 0.0% |
| Oregon: | 8.8% |
| Here: | 30.0% |
| Oregon: | 17.7% |


