Springfield, OH (Ohio) Houses and Residents
| Springfield: | $114,642 |
| Ohio: | $204,100 |
Mean price in 2022:
Detached houses: $135,766
Here: $135,766 State: $254,366 Townhouses or other attached units: $170,462
Here: $170,462 State: $225,733 In 2-unit structures: $183,637
Here: $183,637 State: $144,384 In 3-to-4-unit structures: $304,461
Here: $304,461 State: $203,002 In 5-or-more-unit structures: $135,477
Here: $135,477 State: $211,593 Mobile homes: $16,564
Here: $16,564 State: $62,719
Total population: 59,956 (All urban)
Houses: 27,829 (24,177 occupied: 12,545 owner occupied, 11,849 renter occupied)
| % of renters here: | 49% |
| State: | 33% |
Housing density: 1,238 houses/condos per square mile
Median price asked for vacant for-sale houses and condos in 2022: $242,955.
Median contract rent in 2022: $606 (lower quartile is $493, upper quartile is $782)
Median rent asked for vacant for-rent units in 2022: $835
Median gross rent in Springfield, OH in 2022: $821
Housing units in Springfield with a mortgage: 7,041 (622 second mortgage, 36 home equity loan, 457 both second mortgage and home equity loan)
Houses without a mortgage: 189
Median household income for houses/condos with a mortgage: $62,590
Median household income for apartments without a mortgage: $39,951
Median monthly housing costs: $740
Compare current foreclosures in Springfield, OH:
| Photo | Address | Area | Beds / Baths | Price | Details |
|---|---|---|---|---|---|

|
#1
E Cecil St
Springfield, OH 45503
|
2,252 sq. feet
|
2 baths 5 beds |
$224,500
|
show details |

|
#2
Kinnane Ave
Springfield, OH 45505
|
1,173 sq. feet
|
1 baths 3 beds |
$42,294
|
show details |

|
#3
N Arlington Ave
Springfield, OH 45503
|
856 sq. feet
|
1 baths 2 beds |
$144,500
|
show details |

|
#4
Pine St
Springfield, OH 45505
|
1,412 sq. feet
|
2 baths 3 beds |
$31,600
|
show details |

|
#5
Delaware Ave
Springfield, OH 45506
|
1,951 sq. feet
|
1 baths 4 beds |
$64,900
|
show details |

|
#6
Morton Dr
Springfield, OH 45505
|
1,128 sq. feet
|
1 baths 2 beds |
show details | |

|
#7
Rebert Pike
Springfield, OH 45502
|
2,467 sq. feet
|
2 baths 5 beds |
show details | |

|
#8
Howard St
Springfield, OH 45503
|
976 sq. feet
|
1 baths 2 beds |
show details | |

|
#9
W 1st St
Springfield, OH 45504
|
672 sq. feet
|
1 baths 2 beds |
show details | |

|
#10
Allison Ave
Springfield, OH 45506
|
900 sq. feet
|
1 baths 3 beds |
show details |
| Photo | Address | Area | Beds / Baths | Price | Details |
|---|---|---|---|---|---|

|
#11
S Sweetbriar Ln
Springfield, OH 45505
|
1,075 sq. feet
|
1 baths 4 beds |
show details | |

|
#12
Troy Rd
Springfield, OH 45504
|
1,023 sq. feet
|
1 baths 2 beds |
show details | |

|
#13
Portage Path
Springfield, OH 45506
|
1,142 sq. feet
|
1 baths 4 beds |
show details | |

|
#14
Phoenix Dr
Springfield, OH 45503
|
1,325 sq. feet
|
1 baths 2 beds |
show details | |

|
#15
S Bird Rd
Springfield, OH 45505
|
1,180 sq. feet
|
1 baths 3 beds |
show details | |

|
#16
Lagonda Ave
Springfield, OH 45503
|
2,100 sq. feet
|
1 baths 4 beds |
show details | |

|
#17
Halifax Ct
Springfield, OH 45503
|
1,903 sq. feet
|
1 baths 3 beds |
show details | |

|
#18
Harshman Blvd
Springfield, OH 45504
|
972 sq. feet
|
1 baths 3 beds |
show details | |

|
#19
N Arlington Ave
Springfield, OH 45503
|
1,233 sq. feet
|
2 baths 2 beds |
show details | |

|
#20
Mechanicsburg Rd
Springfield, OH 45503
|
1,278 sq. feet
|
1 baths 2 beds |
show details |
| Photo | Address | Area | Beds / Baths | Price | Details |
|---|---|---|---|---|---|

|
#21
Berger Ave
Springfield, OH 45503
|
1,120 sq. feet
|
1 baths 2 beds |
show details | |

|
#22
Warren Dr
Springfield, OH 45503
|
2,352 sq. feet
|
2 baths 6 beds |
show details | |

|
#23
Old Springfield Rd
Springfield, OH 45502
|
1,158 sq. feet
|
1 baths 2 beds |
show details | |

|
#24
Ashley Cir
Springfield, OH 45503
|
1,175 sq. feet
|
1 baths 3 beds |
show details | |

|
#25
Bellefair Ave
Springfield, OH 45506
|
624 sq. feet
|
1 baths 2 beds |
show details | |

|
#26
Larchmont Ave
Springfield, OH 45503
|
1,256 sq. feet
|
1 baths 3 beds |
show details | |

|
#27
Scarboro St
Springfield, OH 45506
|
1,161 sq. feet
|
1 baths 4 beds |
show details | |

|
#28
Iroquois St
Springfield, OH 45506
|
2,160 sq. feet
|
2 baths 4 beds |
show details | |

|
#29
Timberline Trl
Springfield, OH 45503
|
2,380 sq. feet
|
3 baths 3 beds |
show details | |

|
#30
Nettlewood Ln
Springfield, OH 45502
|
1,974 sq. feet
|
2 baths 4 beds |
show details |
| Photo | Address | Area | Beds / Baths | Price | Details |
|---|---|---|---|---|---|

|
#31
Tioga Ct
Springfield, OH 45502
|
2,198 sq. feet
|
2 baths 4 beds |
show details | |

|
#32
Ballentine Pike
Springfield, OH 45502
|
1,500 sq. feet
|
2 baths 3 beds |
show details | |

|
#33
Elmore Dr
Springfield, OH 45505
|
884 sq. feet
|
1 baths 3 beds |
show details | |

|
#34
Ridge Rd
Springfield, OH 45503
|
1,053 sq. feet
|
2 baths 3 beds |
show details | |

|
#35
Fletcher Chapel Rd
Springfield, OH 45502
|
924 sq. feet
|
2 baths 5 beds |
show details | |

|
#36
Catherine St
Springfield, OH 45505
|
1,720 sq. feet
|
1 baths 4 beds |
show details | |

|
#37
Highview Ave
Springfield, OH 45505
|
1,344 sq. feet
|
1 baths 2 beds |
show details | |

|
#38
Manhattan Blvd
Springfield, OH 45504
|
1,151 sq. feet
|
1 baths 2 beds |
show details | |

|
#39
Colonial Dr
Springfield, OH 45504
|
1,400 sq. feet
|
3 baths 3 beds |
show details | |

|
#40
Troy Rd
Springfield, OH 45502
|
1,050 sq. feet
|
1 baths 3 beds |
show details |
| Photo | Address | Area | Beds / Baths | Price | Details |
|---|---|---|---|---|---|

|
#41
Broadway Rd
Springfield, OH 45502
|
2,254 sq. feet
|
2 baths 3 beds |
show details | |

|
#42
Ridge Rd
Springfield, OH 45502
|
2,008 sq. feet
|
2 baths 3 beds |
show details | |

|
#43
Hyannis Dr
Springfield, OH 45503
|
1,219 sq. feet
|
2 baths 4 beds |
show details | |

|
#44
S Clairmont Ave
Springfield, OH 45505
|
1,252 sq. feet
|
1 baths 2 beds |
show details | |

|
#45
Lawrenceville Dr
Springfield, OH 45504
|
1,200 sq. feet
|
1 baths 3 beds |
show details | |

|
#46
Folk Ream Rd
Springfield, OH 45502
|
1,387 sq. feet
|
1 baths 3 beds |
show details | |

|
#47
S Fountain Ave
Springfield, OH 45506
|
1,710 sq. feet
|
1 baths 3 beds |
show details | |

|
#48
Sunset Ave
Springfield, OH 45505
|
1,170 sq. feet
|
1 baths 2 beds |
show details | |

|
#49
Drew Ct
Springfield, OH 45503
|
1,008 sq. feet
|
1 baths 3 beds |
show details | |

|
Check over 1 million property listings on Foreclosure.com!
|
browse all offers | |||

Latest news about housing in Springfield, OH collected exclusively by city-data.com from local newspapers, TV, and radio stations


Median year apartment built: 1962
Household type by relationship:
Households: 58,193- Male householders: 10,748 (4,140 living alone), Female householders: 13,197 (4,871 living alone)
7,108 spouses (7,080 opposite-sex spouses), 2,917 unmarried partners, (2,761 opposite-sex unmarried partners), 15,222 children (13,956 natural, 611 adopted, 654 stepchildren), 1,745 grandchildren, 740 brothers or sisters, 406 parents, 181 foster children, 1,287 other relatives, 2,227 non-relatives
- In group quarters: 2,409
Size of family households: 5,403 2-persons, 2,773 3-persons, 2,028 4-persons, 1,559 5-persons, 423 6-persons, 166 7-or-more-persons.
Size of nonfamily households: 9,928 1-person, 2,187 2-persons, 370 3-persons, 32 4-persons.
4,858 married couples with children.
5,079 single-parent households (1,211 men, 3,868 women).
95.2% of residents of Springfield speak English at home.
2.7% of residents speak Spanish at home (59% speak English very well, 17% speak English well, 15% speak English not well, 9% don't speak English at all).
1.2% of residents speak other Indo-European language at home (25% speak English very well, 41% speak English well, 14% speak English not well, 20% don't speak English at all).
0.4% of residents speak Asian or Pacific Island language at home (31% speak English very well, 14% speak English well, 56% speak English not well).
0.3% of residents speak other language at home (57% speak English very well, 25% speak English well, 6% speak English not well, 13% don't speak English at all).
Foreign born population: 1,998 (3.4%)
(38.3% of them are naturalized citizens)
| Here: | 6.4 |
| State: | 6.7 |
| Here: | 4.8 |
| State: | 4.4 |

- Bedrooms in owner-occupied houses and condos in Springfield, Ohio
- 11no bedroom
- 1881 bedroom
- 3,3432 bedrooms
- 6,4543 bedrooms
- 2,0994 bedrooms
- 4515+ bedrooms

- Bedrooms in renter-occupied apartments in Springfield, Ohio
- 370no bedroom
- 2,9071 bedroom
- 4,7202 bedrooms
- 3,1373 bedrooms
- 6704 bedrooms
- 455+ bedrooms

- Cars and other vehicles available in Springfield in owner-occupied houses/condos
- 585no vehicle
- 4,4821 vehicle
- 4,7222 vehicles
- 1,8083 vehicles
- 6154 vehicles
- 3335+ vehicles

- Cars and other vehicles available in Springfield in renter-occupied apartments
- 2,520no vehicle
- 5,6661 vehicle
- 2,8892 vehicles
- 5713 vehicles
- 1354 vehicles
- 685+ vehicles

- Rooms in owner-occupied houses in Springfield, Ohio
- 111 room
- 532 rooms
- 563 rooms
- 7954 rooms
- 2,8115 rooms
- 3,3026 rooms
- 2,2607 rooms
- 1,5458 rooms
- 1,7139+ rooms

- Rooms in renter-occupied apartments in Springfield, Ohio
- 2951 room
- 3482 rooms
- 1,8783 rooms
- 2,7204 rooms
- 3,0165 rooms
- 1,9766 rooms
- 1,0167 rooms
- 3138 rooms
- 2879+ rooms


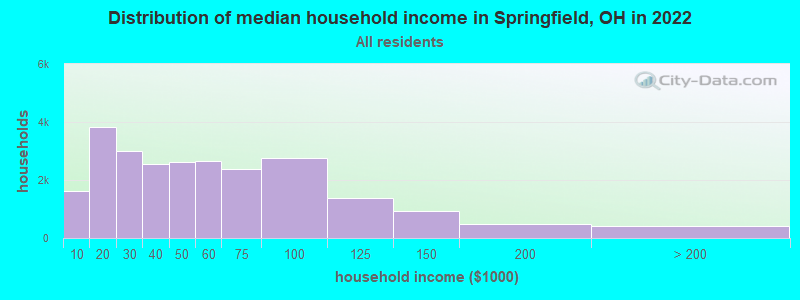
Springfield, OH household income distribution

- 1,608Less than $10,000
- 3,811$10,000 to $19,999
- 3,000$20,000 to $29,999
- 2,538$30,000 to $39,999
- 2,628$40,000 to $49,999
- 2,659$50,000 to $59,999
- 2,368$60,000 to $74,999
- 2,769$75,000 to $99,999
- 1,390$100,000 to $124,999
- 936$125,000 to $149,999
- 499$150,000 to $199,999
- 397$200,000 or more
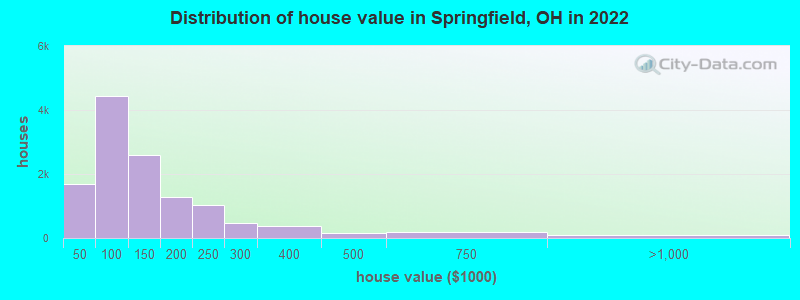
Home value of owner - occupied houses in 2022 in Springfield, OH
-
- 138Less than $10,000
- 278$10,000 to $14,999
- 99$15,000 to $19,999
- 170$20,000 to $24,999
- 100$25,000 to $29,999
- 273$30,000 to $34,999
- 271$35,000 to $39,999
- 339$40,000 to $49,999
- 465$50,000 to $59,999
- 963$60,000 to $69,999
- 1,163$70,000 to $79,999
- 1,011$80,000 to $89,999
- 503$90,000 to $99,999
- 1,578$100,000 to $124,999
- 1,026$125,000 to $149,999
- 587$150,000 to $174,999
- 696$175,000 to $199,999
- 1,045$200,000 to $249,999
- 460$250,000 to $299,999
- 362$300,000 to $399,999
- 156$400,000 to $499,999
- 202$500,000 to $749,999
- 86$750,000 to $999,999
Rent paid by renters in 2022 in Springfield, OH
-
- 416Less than $100
- 72$100 to $149
- 221$150 to $199
- 663$200 to $249
- 191$250 to $299
- 319$300 to $349
- 187$350 to $399
- 240$400 to $449
- 676$450 to $499
- 1,225$500 to $549
- 1,263$550 to $599
- 1,853$600 to $649
- 758$650 to $699
- 873$700 to $749
- 283$750 to $799
- 918$800 to $899
- 430$900 to $999
- 273$1,000 to $1,249
- 143$1,250 to $1,499
- 25$1,500 to $1,999
- 120$2,000 to $2,499
- 30$2,500 to $2,999
- 37$3,000 to $3,499
- 8$3,500 or more
- 360No cash rent


Percentage of workers working in this county: 72.9%
Number of people working at home: 1,568 (6.5% of all workers)
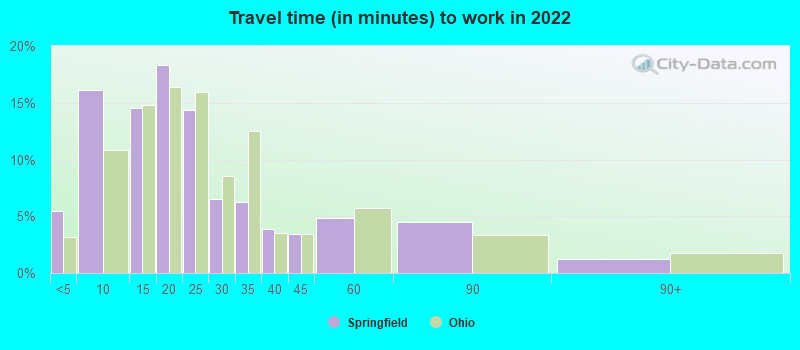
Travel time to work (commute)
- Less than 5 minutes: 1,684
- 5 to 9 minutes: 4,233
- 10 to 14 minutes: 3,788
- 15 to 19 minutes: 3,682
- 20 to 24 minutes: 2,127
- 25 to 29 minutes: 1,033
- 30 to 34 minutes: 1,916
- 35 to 39 minutes: 692
- 40 to 44 minutes: 866
- 45 to 59 minutes: 1,749
- 60 to 89 minutes: 477
- 90 or more minutes: 163
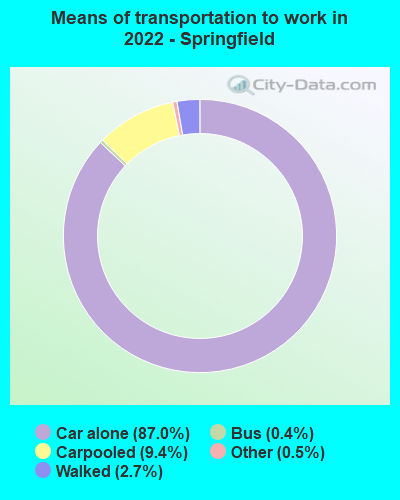
Means of transportation to work:
- Drove a car alone: 24,963 (83.3%)
- Carpooled: 1,941 (6.5%)
- Bus: 191 (0.6%)
- Taxi: 260 (0.9%)
- Bicycle: 14 (0.0%)
- Walked: 979 (3.3%)
- Worked at home: 1,568 (5.2%)

- Unemployment by race in 2022
- Unemployment rate for White non-Hispanic residents
- 7.8%Males
- 6.2%Females
- Unemployment rate for Black residents
- 16.0%Males
- 11.6%Females
- Unemployment rate for Asian residents
- 12.8%Females
- Unemployment rate for other race residents
- 5.7%Females
- Unemployment rate for two or more race residents
- 16.0%Males
- 6.1%Females
- Unemployment rate for Hispanic or Latino residents
- 6.8%Males
- 6.5%Females

- Year of entry for the foreign-born population in Springfield, Ohio
- 7362010 or later
- 6322000 to 2009
- 2311990 to 1999
- 2221980 to 1989
- 1031970 to 1979
- 209Before 1970

First ancestries reported:
- German: 3,333 (12.7%)
- American: 2,892 (11.0%)
- English: 2,323 (8.9%)
- Irish: 1,650 (6.3%)
- Haitian: 847 (3.2%)
- Italian: 819 (3.1%)
- European: 441 (1.7%)
- Scotch-Irish: 177 (0.7%)
- African: 170 (0.6%)
- Scottish: 155 (0.6%)
- Eastern European: 152 (0.6%)
- Polish: 147 (0.6%)
- French: 101 (0.4%)
- Greek: 81 (0.3%)
- Swiss: 75 (0.3%)
- Dutch: 68 (0.3%)
- Welsh: 67 (0.3%)
- Nigerian: 65 (0.2%)
- Ethiopian: 63 (0.2%)
- Canadian: 60 (0.2%)
- French Canadian: 56 (0.2%)
- Norwegian: 44 (0.2%)
- Czech: 42 (0.2%)
- Slovak: 30 (0.1%)
- British: 25 (0.10%)
- Slavic: 18 (0.07%)
- Danish: 16 (0.06%)
- Pennsylvania German: 16 (0.06%)
- Portuguese: 15 (0.06%)
- Czechoslovakian: 14 (0.05%)
- Lithuanian: 14 (0.05%)
- Hungarian: 13 (0.05%)
- Scandinavian: 11 (0.04%)
- Palestinian: 11 (0.04%)
- Macedonian: 10 (0.04%)
- Russian: 9 (0.03%)
- Swedish: 8 (0.03%)
- Slovene: 7 (0.03%)
- Iranian: 5 (0.02%)
- Celtic: 5 (0.02%)
- Sierra Leonean: 5 (0.02%)
- Romanian: 3 (0.01%)
- West Indian: 3 (0.01%)
Most common places of birth for foreign-born residents (%):
| Springfield: | 39.4% (723) |
| Ohio: | 7.8% (44,796) |
| Springfield: | 35.9% (660) |
| Ohio: | 0.5% (2,819) |
| Springfield: | 5.4% (100) |
| Ohio: | 6.2% (35,703) |
| Springfield: | 2.7% (50) |
| Ohio: | 1.1% (6,549) |
| Springfield: | 2.7% (49) |
| Ohio: | 11.6% (66,525) |
| Springfield: | 2.6% (47) |
| Ohio: | 0.0% (228) |
| Springfield: | 2.2% (40) |
| Ohio: | 2.2% (12,846) |
| Springfield: | 2.1% (38) |
| Ohio: | 0.9% (5,422) |
| Springfield: | 1.9% (35) |
| Ohio: | 0.4% (2,052) |
| Springfield: | 1.9% (35) |
| Ohio: | 3.1% (17,818) |
| Springfield: | 1.9% (34) |
| Ohio: | 0.5% (2,631) |
| Springfield: | 1.7% (31) |
| Ohio: | 1.9% (10,960) |
| Springfield: | 1.6% (29) |
| Ohio: | 0.5% (3,061) |
Place of birth for U.S.-born residents:
- This state: 45,902
- Other state: 9,445
- Northeast: 1,112
- Midwest: 2,695
- South: 4,319
- West: 1,360
83.0% of Springfield residents lived in the same house 1 years ago.
Out of people who lived in different houses, 44.1% lived in this county.
Out of people who lived in different counties, 48.6% lived in Ohio.
| Springfield: | 83.0% |
| State average: | 87.8% |
Education attainment for males 25 years and older:
- No schooling: 682
- Nursery to 4th grade: 88
- 5th and 6th grade: 130
- 7th and 8th grade: 189
- 9th grade: 332
- 10th grade: 600
- 11th grade: 830
- 12th grade, no diploma: 677
- High school graduate (or equivalency): 7,047
- Less than 1 year of college: 1,131
- Some college more than 1 year, no degree: 2,476
- Associate degree: 1,307
- Bachelor's degree: 1,724
- Master's degree: 683
- Professional school degree: 101
- Doctorate degree: 243

Education attainment for females 25 years and older:
- No schooling: 67
- Nursery to 4th grade: 31
- 5th and 6th grade: 133
- 7th and 8th grade: 229
- 9th grade: 528
- 10th grade: 504
- 11th grade: 607
- 12th grade, no diploma: 189
- High school graduate (or equivalency): 6,991
- Less than 1 year of college: 2,174
- Some college more than 1 year, no degree: 2,929
- Associate degree: 2,034
- Bachelor's degree: 2,512
- Master's degree: 752
- Professional school degree: 80
- Doctorate degree: 49


Housing units in structures:
- One, detached: 17,661
- One, attached: 3,310
- Two: 1,242
- 3 or 4: 1,347
- 5 to 9: 1,444
- 10 to 19: 778
- 20 to 49: 533
- 50 or more: 1,476
- Mobile homes: 9
- Boats, RVs, vans, etc.: 25
Housing units lacking complete kitchen facilities in 2022: 6.9%
House/condo owner moved in on average 14 years ago
Renter moved in on average 3 years ago

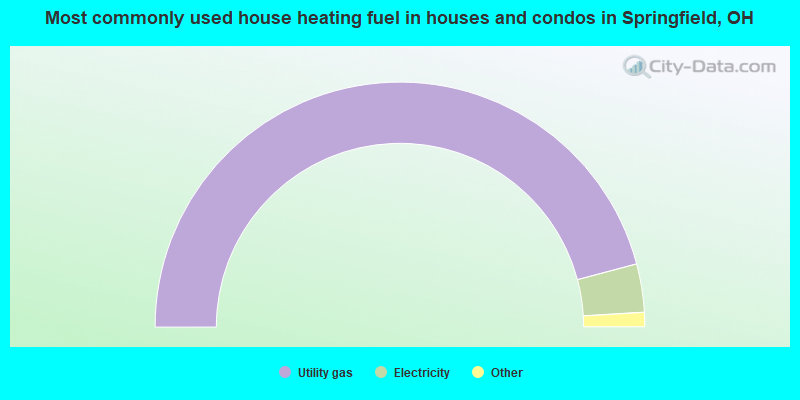
- 91.8%Utility gas
- 6.4%Electricity
- 0.9%Bottled, tank, or LP gas
- 0.4%Fuel oil, kerosene, etc.
- 0.4%Wood
- 0.1%Other fuel
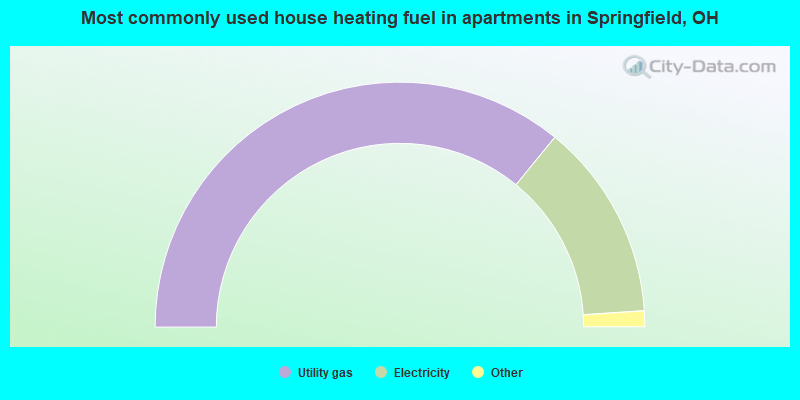
- 71.8%Utility gas
- 26.1%Electricity
- 1.1%Bottled, tank, or LP gas
- 0.6%No fuel used
- 0.3%Other fuel
Private vs. public school enrollment:
| Here: | 20.3% |
| Ohio: | 16.0% |
| Here: | 14.0% |
| Ohio: | 13.1% |
| Here: | 48.2% |
| Ohio: | 22.3% |


