South Miami Heights, FL (Florida) Houses and Residents
Estimated median house or condo value in 2022: $381,967 (it was $88,700 in 2000 )
South Miami Heights:
$381,967Florida:
$354,100
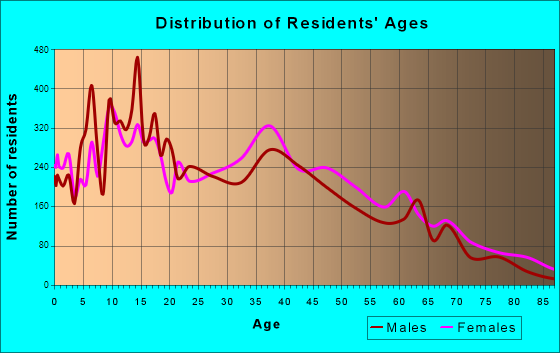
Lower value quartile - upper value quartile: $306,764 - $468,833Total population: 35,696 (Urban population: 33,579, Rural population: 0)
Houses: 12,102 (11,619 occupied: 7,557 owner occupied, 4,216 renter occupied )
% of renters here:
36%State:
33%
Housing density: 2,455 houses/condos per square mile
Median price asked for vacant for-sale houses and condos in 2022: $594,970.
Median contract rent in 2022: $1,288 (lower quartile is $997, upper quartile is $1,555)
Median rent asked for vacant for-rent units in 2022: $1,583
Median gross rent in South Miami Heights, FL in 2022: $1,409
Housing units in South Miami Heights with a mortgage: 4,566 (186 second mortgage, 10 home equity loan, 116 both second mortgage and home equity loan )Houses without a mortgage: 40
Median household income for houses/condos with a mortgage: $83,471
Median household income for apartments without a mortgage: $66,648
Median monthly housing costs: $1,338
Data:
Median house or condo value ($)
Median house or condo value ($ change since 2000)
Median house or condo value ($) - White
Median house or condo value ($) - Black or African American
Median house or condo value ($) - Asian
Median house or condo value ($) - Hispanic or Latino
Median house or condo value ($) - American Indian and Alaska Native
Median house or condo value ($) - Multirace
Median house or condo value ($) - Other Race
Median price asked for mobile homes ($)
Household density (households per square mile)
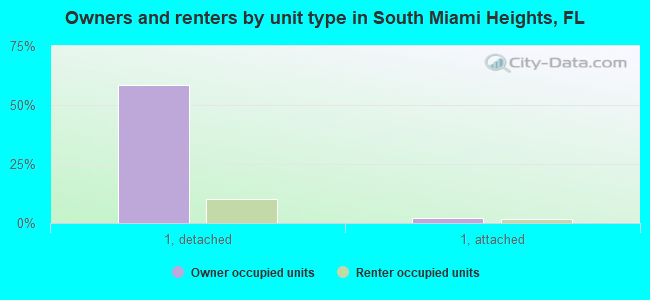
Mean house or condo value by units in structure - 1, detached ($)
Mean house or condo value by units in structure - 1, attached ($)
Mean house or condo value by units in structure - 2 ($)
Mean house or condo value by units in structure by units in structure - 3 or 4 ($)
Mean house or condo value by units in structure - 5 or more ($)
Mean house or condo value by units in structure - Boat, RV, van, etc. ($)
Mean house or condo value by units in structure - Mobile home ($)
Median contract rent ($)
Median contract rent - Lower quartile ($)
Median contract rent - Upper quartile ($)
Median gross rent ($)
Urban houses (%)
Rural houses (%)
Houses occupied (%)
Houses occupied (% change since 2000)
Houses owner occupied (%)
Houses owner occupied (% change since 2000)
Houses renter occupied (%)
Houses renter occupied (% change since 2000)
Vacant housing units - For rent (%)
Vacant housing units - For rent (% change since 2000)
Vacant housing units - For sale only (%)
Vacant housing units - For sale only (% change since 2000)
Vacant housing units - Rented or sold, not occupied (%)
Vacant housing units - Rented or sold, not occupied (% change since 2000)
Vacant housing units - For seasonal, recreational, or occasional use (%)
Vacant housing units - For seasonal, recreational, or occasional use (% change since 2000)
Vacant housing units - For migrant workers (%)
Vacant housing units - For migrant workers (% change since 2000)
Vacant housing units - Other vacant (%)
Vacant housing units - Other vacant (% change since 2000)
Median monthly housing costs ($)
Median household income for houses/condos with a mortgage ($)
Median household income for houses/condos without a mortgage ($)
Median household income ($)
Median household income ($) - White
Median household income ($) - Black or African American
Median household income ($) - Asian
Median household income ($) - Hispanic or Latino
Median household income ($) - American Indian and Alaska Native
Median household income ($) - Multirace
Median household income ($) - Other Race
Mortgage status - with mortgage (%)
Mortgage status - with second mortgage (%)
Mortgage status - with home equity loan (%)
Mortgage status - with both second mortgage and home equity loan (%)
Mortgage status - without a mortgage (%)
Median year house/condo built
Median year apartment built
Household type by relationship - Male householder living alone (%)
Household type by relationship - Male householder not living alone (%)
Household type by relationship - Female householder living alone (%)
Household type by relationship - Female householder not living alone (%)
Household type by relationship - Opposite-Sex spouse (%)
Household type by relationship - Same-Sex spouse (%)
Household type by relationship - Opposite-Sex unmarried partner (%)
Household type by relationship - Same-Sex unmarried partner (%)
Household type by relationship - In group quarters (%)
Size of family households - 2-person household (%)
Size of family households - 3-person household (%)
Size of family households - 4-person household (%)
Size of family households - 5-person household (%)
Size of family households - 6-person household (%)
Size of family households - 7-or-more-person household (%)
Size of nonfamily households - 1-person household (%)
Size of nonfamily households - 2-person household (%)
Size of nonfamily households - 3-person household (%)
Size of nonfamily households - 4-person household (%)
Size of nonfamily households - 5-person household (%)
Size of nonfamily households - 6-person household (%)
Size of nonfamily households - 7-or-moreperson household (%)
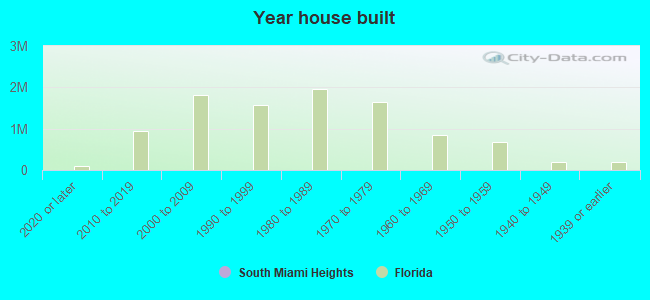
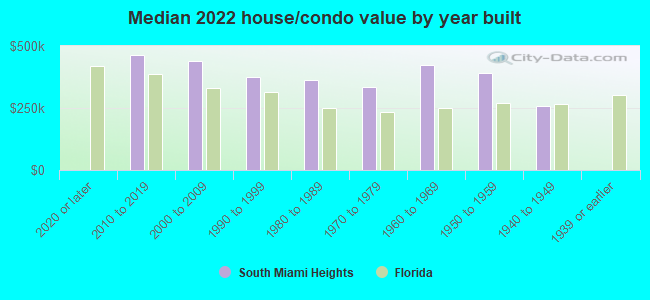
Year house built - Built 2010 or later (%)
Year house built - Built 2000 to 2009 (%)
Year house built - Built 1990 to 1999 (%)
Year house built - Built 1980 to 1989 (%)
Year house built - Built 1970 to 1979 (%)
Year house built - Built 1960 to 1969 (%)
Year house built - Built 1950 to 1959 (%)
Year house built - Built 1940 to 1949 (%)
Year house built - Built 1939 or earlier (%)
Median number of rooms in houses and condos
Median number of rooms in apartments
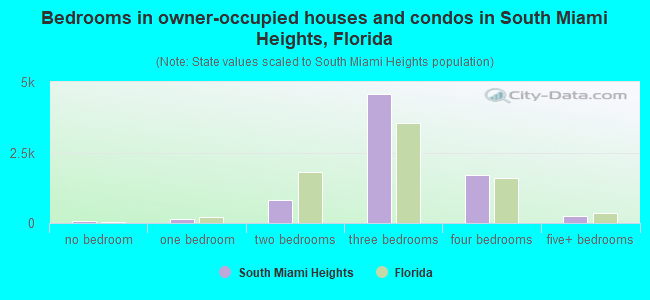
Median number of bedrooms in owner occupied houses
Mean number of bedrooms in owner occupied houses
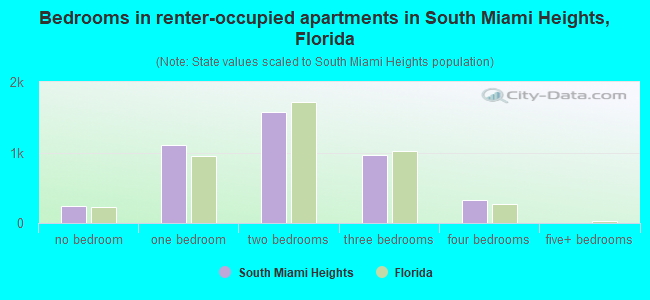
Median number of bedrooms in renter occupied houses
Mean number of bedrooms in renter occupied houses
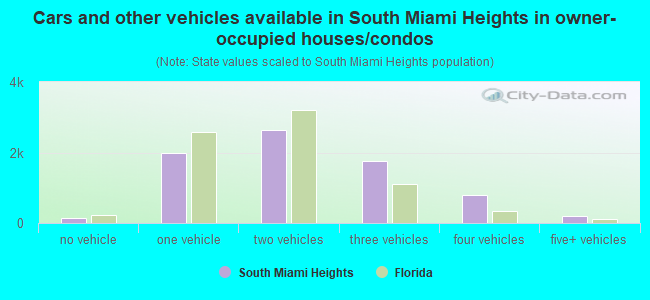
Median number of vehichles in owner occupied houses
Mean number of vehichles in owner occupied houses
Median number of vehichles in renter occupied houses
Mean number of vehichles in renter occupied houses
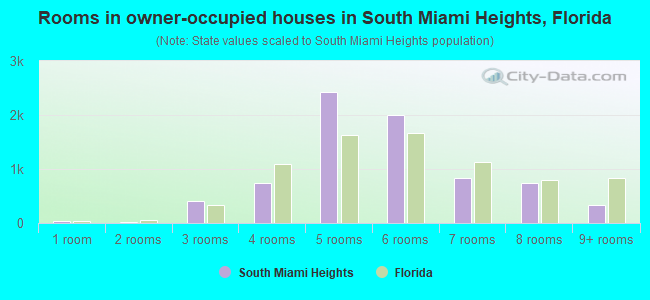
Rooms in owner-occupied houses - 1 room (%)
Rooms in owner-occupied houses - 2 rooms (%)
Rooms in owner-occupied houses - 3 rooms (%)
Rooms in owner-occupied houses - 4 rooms (%)
Rooms in owner-occupied houses - 5 rooms (%)
Rooms in owner-occupied houses - 6 rooms (%)
Rooms in owner-occupied houses - 7 rooms (%)
Rooms in owner-occupied houses - 8 rooms (%)
Rooms in owner-occupied houses - 9+ rooms (%)
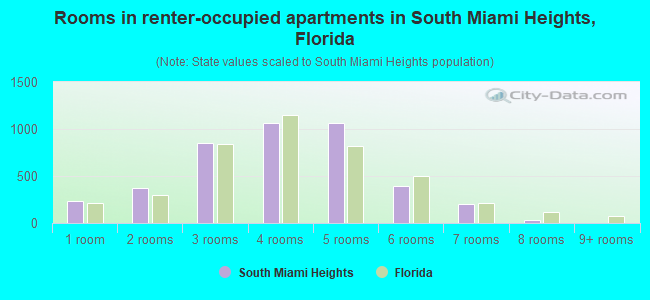
Rooms in renter-occupied houses - 1 room (%)
Rooms in renter-occupied houses - 2 rooms (%)
Rooms in renter-occupied houses - 3 rooms (%)
Rooms in renter-occupied houses - 4 rooms (%)
Rooms in renter-occupied houses - 5 rooms (%)
Rooms in renter-occupied houses - 6 rooms (%)
Rooms in renter-occupied houses - 7 rooms (%)
Rooms in renter-occupied houses - 8 rooms (%)
Rooms in renter-occupied houses - 9+ rooms (%)
Bedrooms in owner-occupied houses - no bedrooms (%)
Bedrooms in owner-occupied houses - 1 bedroom (%)
Bedrooms in owner-occupied houses - 2 bedrooms (%)
Bedrooms in owner-occupied houses - 3 bedrooms (%)
Bedrooms in owner-occupied houses - 4 bedrooms (%)
Bedrooms in owner-occupied houses - 5+ bedrooms (%)
Bedrooms in renter-occupied houses - no bedrooms (%)
Bedrooms in renter-occupied houses - 1 bedroom (%)
Bedrooms in renter-occupied houses - 2 bedrooms (%)
Bedrooms in renter-occupied houses - 3 bedrooms (%)
Bedrooms in renter-occupied houses - 4 bedrooms (%)
Bedrooms in renter-occupied houses - 5+ bedrooms (%)
Vehicles available in owner-occupied houses - no vehicle available (%)
Vehicles available in owner-occupied houses - 1 vehicle available(%)
Vehicles available in owner-occupied houses - 2 Vehicles available (%)
Vehicles available in owner-occupied houses - 3 Vehicles available (%)
Vehicles available in owner-occupied houses - 4 Vehicles available (%)
Vehicles available in owner-occupied houses - 5+ Vehicles available (%)
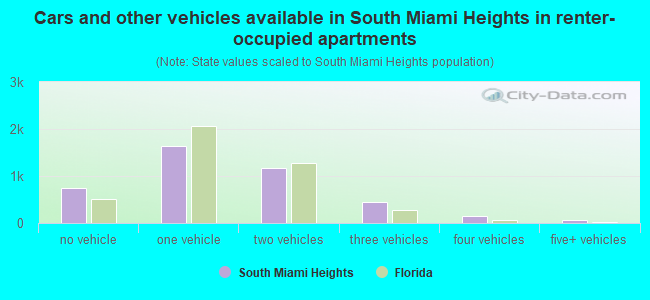
Vehicles available in renter-occupied houses - no vehicle available (%)
Vehicles available in renter-occupied houses - 1 vehicle available (%)
Vehicles available in renter-occupied houses - 2 Vehicles available (%)
Vehicles available in renter-occupied houses - 3 Vehicles available (%)
Vehicles available in renter-occupied houses - 4 Vehicles available (%)
Vehicles available in renter-occupied houses - 5+ Vehicles available (%)
Housing units in structures - 1, detached (%)
Housing units in structures - 1, attached (%)
Housing units in structures - 2 (%)
Housing units in structures - 3 or 4 (%)
Housing units in structures - 5 to 9 (%)
Housing units in structures - 10 to 19 (%)
Housing units in structures - 20 to 49 (%)
Housing units in structures - 50 or more (%)
Housing units in structures - Mobile home (%)
Housing units in structures - Boat, RV, van, etc. (%)
Housing units in structures - Owners - 1, detached (%)
Housing units in structures - Owners - 1, attached (%)
Housing units in structures - Owners - 2 (%)
Housing units in structures - Owners - 3 or 4 (%)
Housing units in structures - Owners - 5 to 9 (%)
Housing units in structures - Owners - 10 to 19 (%)
Housing units in structures - Owners - 20 to 49 (%)
Housing units in structures - Owners - 50 or more (%)
Housing units in structures - Owners - Mobile home (%)
Housing units in structures - Owners - Boat, RV, van, etc. (%)
Housing units in structures - Renters - 1, detached (%)
Housing units in structures - Renters - 1, attached (%)
Housing units in structures - Renters - 2 (%)
Housing units in structures - Renters - 3 or 4 (%)
Housing units in structures - Renters - 5 to 9 (%)
Housing units in structures - Renters - 10 to 19 (%)
Housing units in structures - Renters - 20 to 49 (%)
Housing units in structures - Renters - 50 or more (%)
Housing units in structures - Renters - Mobile home (%)
Housing units in structures - Renters - Boat, RV, van, etc. (%)
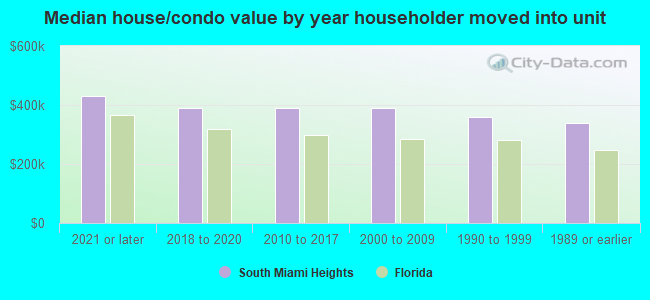
House/condo owner moved in on average (years ago)
Renter moved in on average (years ago)
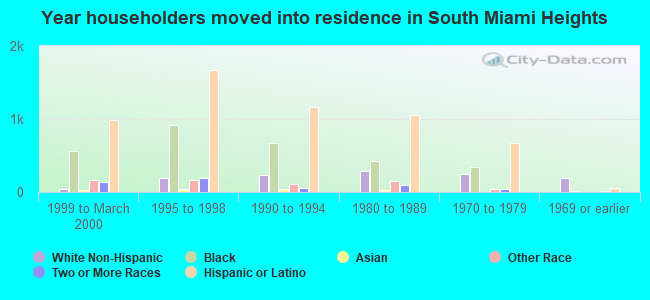
Year householder moved into unit - Moved in 1999 to March 2000 (%)
Year householder moved into unit - Moved in 1999 to March 2000 (%) - White
Year householder moved into unit - Moved in 1999 to March 2000 (%) - Black or African American
Year householder moved into unit - Moved in 1999 to March 2000 (%) - Asian
Year householder moved into unit - Moved in 1999 to March 2000 (%) - Hispanic or Latino
Year householder moved into unit - Moved in 1999 to March 2000 (%) - American Indian and Alaska Native
Year householder moved into unit - Moved in 1999 to March 2000 (%) - Multirace
Year householder moved into unit - Moved in 1999 to March 2000 (%) - Other Race
Year householder moved into unit - Moved in 1995 to 1998 (%)
Year householder moved into unit - Moved in 1995 to 1998 (%) - White
Year householder moved into unit - Moved in 1995 to 1998 (%) - Black or African American
Year householder moved into unit - Moved in 1995 to 1998 (%) - Asian
Year householder moved into unit - Moved in 1995 to 1998 (%) - Hispanic or Latino
Year householder moved into unit - Moved in 1995 to 1998 (%) - American Indian and Alaska Native
Year householder moved into unit - Moved in 1995 to 1998 (%) - Multirace
Year householder moved into unit - Moved in 1995 to 1998 (%) - Other Race
Year householder moved into unit - Moved in 1990 to 1994 (%)
Year householder moved into unit - Moved in 1990 to 1994 (%) - White
Year householder moved into unit - Moved in 1990 to 1994 (%) - Black or African American
Year householder moved into unit - Moved in 1990 to 1994 (%) - Asian
Year householder moved into unit - Moved in 1990 to 1994 (%) - Hispanic or Latino
Year householder moved into unit - Moved in 1990 to 1994 (%) - American Indian and Alaska Native
Year householder moved into unit - Moved in 1990 to 1994 (%) - Multirace
Year householder moved into unit - Moved in 1990 to 1994 (%) - Other Race
Year householder moved into unit - Moved in 1980 to 1989 (%)
Year householder moved into unit - Moved in 1980 to 1989 (%) - White
Year householder moved into unit - Moved in 1980 to 1989 (%) - Black or African American
Year householder moved into unit - Moved in 1980 to 1989 (%) - Asian
Year householder moved into unit - Moved in 1980 to 1989 (%) - Hispanic or Latino
Year householder moved into unit - Moved in 1980 to 1989 (%) - American Indian and Alaska Native
Year householder moved into unit - Moved in 1980 to 1989 (%) - Multirace
Year householder moved into unit - Moved in 1980 to 1989 (%) - Other Race
Year householder moved into unit - Moved in 1970 to 1979 (%)
Year householder moved into unit - Moved in 1970 to 1979 (%) - White
Year householder moved into unit - Moved in 1970 to 1979 (%) - Black or African American
Year householder moved into unit - Moved in 1970 to 1979 (%) - Asian
Year householder moved into unit - Moved in 1970 to 1979 (%) - Hispanic or Latino
Year householder moved into unit - Moved in 1970 to 1979 (%) - American Indian and Alaska Native
Year householder moved into unit - Moved in 1970 to 1979 (%) - Multirace
Year householder moved into unit - Moved in 1970 to 1979 (%) - Other Race
Year householder moved into unit - Moved in 1969 or earlier (%)
Year householder moved into unit - Moved in 1969 or earlier (%) - White
Year householder moved into unit - Moved in 1969 or earlier (%) - Black or African American
Year householder moved into unit - Moved in 1969 or earlier (%) - Asian
Year householder moved into unit - Moved in 1969 or earlier (%) - Hispanic or Latino
Year householder moved into unit - Moved in 1969 or earlier (%) - American Indian and Alaska Native
Year householder moved into unit - Moved in 1969 or earlier (%) - Multirace
Year householder moved into unit - Moved in 1969 or earlier (%) - Other Race
Housing units lacking complete plumbing facilities (%)
Housing units lacking complete kitchen facilities (%)
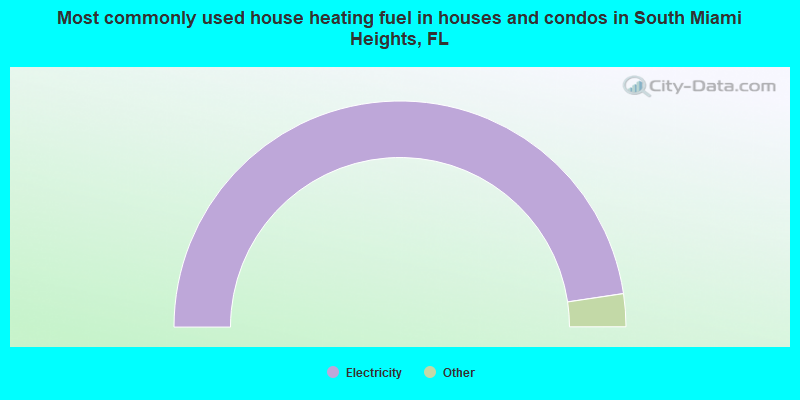
House heating fuel used in houses and condos - Utility gas (%)
House heating fuel used in houses and condos - Bottled, tank, or LP gas (%)
House heating fuel used in houses and condos - Electricity (%)
House heating fuel used in houses and condos - Fuel oil, kerosene, etc. (%)
House heating fuel used in houses and condos - Coal or coke (%)
House heating fuel used in houses and condos - Wood (%)
House heating fuel used in houses and condos - Solar energy (%)
House heating fuel used in houses and condos - Other fuel (%)
House heating fuel used in houses and condos - No fuel used (%)
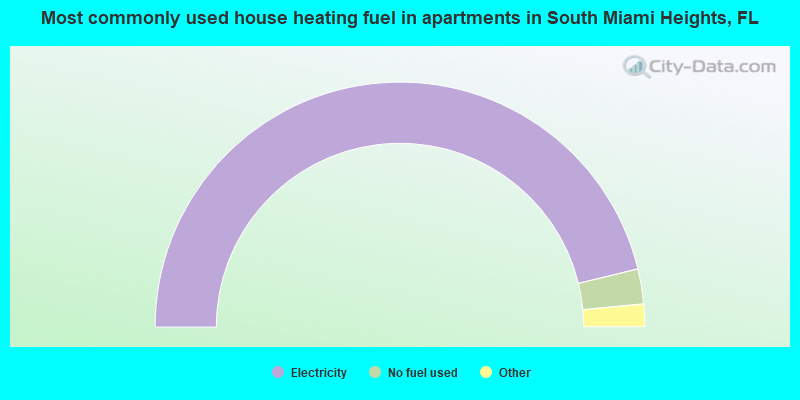
House heating fuel used in apartments - Utility gas (%)
House heating fuel used in apartments - Bottled, tank, or LP gas (%)
House heating fuel used in apartments - Electricity (%)
House heating fuel used in apartments - Fuel oil, kerosene, etc. (%)
House heating fuel used in apartments - Coal or coke (%)
House heating fuel used in apartments - Wood (%)
House heating fuel used in apartments - Solar energy (%)
House heating fuel used in apartments - Other fuel (%)
House heating fuel used in apartments - No fuel used (%)
Median year house/condo built: 1979Median year apartment built: 1983Household type by relationship:
Households: 35,513
Male householders: 5,409 (1,035 living alone ), Female householders: 5,934 (1,040 living alone )5,577 spouses (5,546 opposite-sex spouses ), 1,239 unmarried partners , (1,239 opposite-sex unmarried partners ), 11,073 children (10,613 natural , 91 adopted , 368 stepchildren ), 1,330 grandchildren , 463 brothers or sisters , 1,187 parents , 0 foster children , 1,724 other relatives , 1,219 non-relatives In group quarters: 353
Size of family households: 2,701 2-persons , 2,344 3-persons , 1,982 4-persons , 1,090 5-persons , 471 6-persons , 154 7-or-more-persons .
Size of nonfamily households: 2,224 1-person , 671 2-persons , 24 4-persons , 16 5-persons , 50 7-or-more-persons .
3,063 married couples with children. single-parent households (773 men , 1,787 women ).
27.1% of residents of South Miami Heights speak English at home. of residents speak Spanish at home (41% speak English very well , 17% speak English well , 24% speak English not well , 18% don't speak English at all ).of residents speak other Indo-European language at home (88% speak English very well , 8% speak English well , 3% don't speak English at all ).of residents speak Asian or Pacific Island language at home (43% speak English very well , 47% speak English well , 10% speak English not well ).of residents speak other language at home (100% speak English very well ).
Foreign born population: 19,480 (54.9%)of them are naturalized citizens )
Median number of rooms in houses and condos:
Median number of rooms in apartments
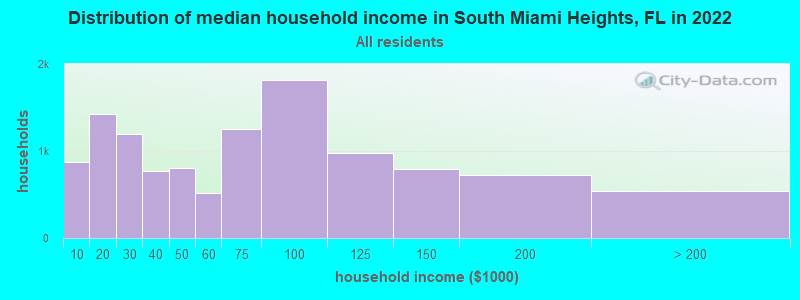
South Miami Heights, FL household income distribution 871 Less than $10,0001,428 $10,000 to $19,9991,191 $20,000 to $29,999769 $30,000 to $39,999805 $40,000 to $49,999514 $50,000 to $59,9991,248 $60,000 to $74,9991,821 $75,000 to $99,999980 $100,000 to $124,999793 $125,000 to $149,999722 $150,000 to $199,999538 $200,000 or more
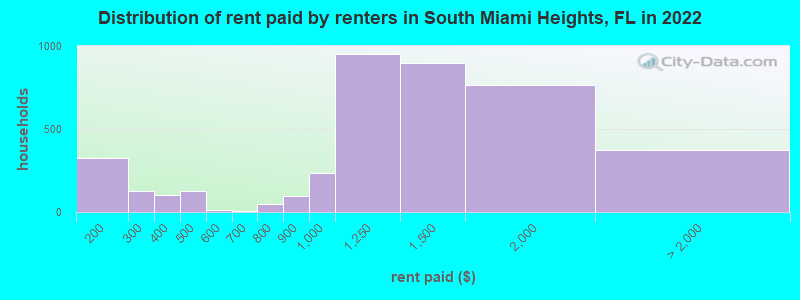
Home value of owner - occupied houses in 2022 in South Miami Heights, FL 137 Less than $10,00014 $25,000 to $29,99919 $35,000 to $39,99911 $40,000 to $49,9998 $70,000 to $79,9994 $90,000 to $99,99916 $100,000 to $124,99973 $125,000 to $149,99984 $150,000 to $174,999308 $175,000 to $199,999491 $200,000 to $249,999753 $250,000 to $299,9992,684 $300,000 to $399,9991,010 $400,000 to $499,999501 $500,000 to $749,999203 $750,000 to $999,99916 $1,500,000 to $1,999,99972 $2,000,000 or moreRent paid by renters in 2022 in South Miami Heights, FL 34 $100 to $149292 $150 to $199102 $200 to $24922 $250 to $29972 $300 to $34930 $350 to $399113 $400 to $44913 $450 to $49912 $550 to $5998 $650 to $69950 $700 to $74996 $800 to $899235 $900 to $999951 $1,000 to $1,249898 $1,250 to $1,499764 $1,500 to $1,999248 $2,000 to $2,499125 No cash rent
Percentage of workers working in this county: 97.3%Number of people working at home: 1,420 (8.2% of all workers )
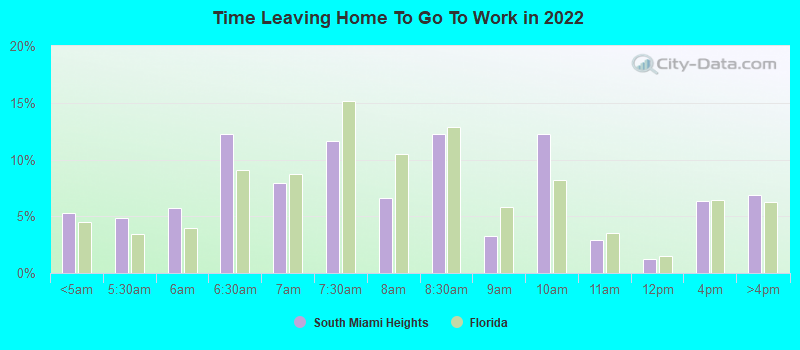
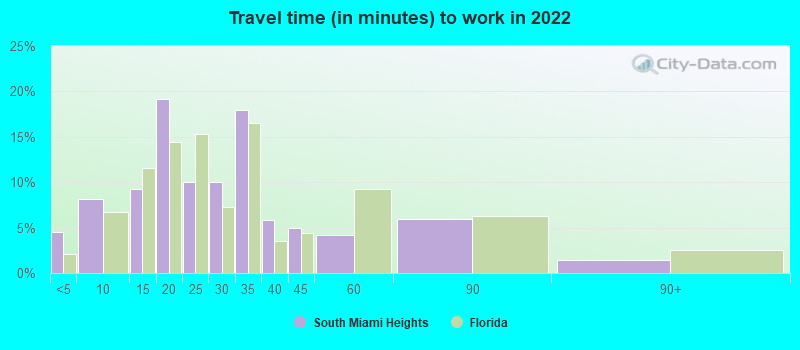
Travel time to work (commute)
Less than 5 minutes: 2525 to 9 minutes: 60210 to 14 minutes: 84115 to 19 minutes: 1,72120 to 24 minutes: 1,98425 to 29 minutes: 98030 to 34 minutes: 2,21535 to 39 minutes: 70740 to 44 minutes: 1,33645 to 59 minutes: 1,91360 to 89 minutes: 1,95390 or more minutes: 810
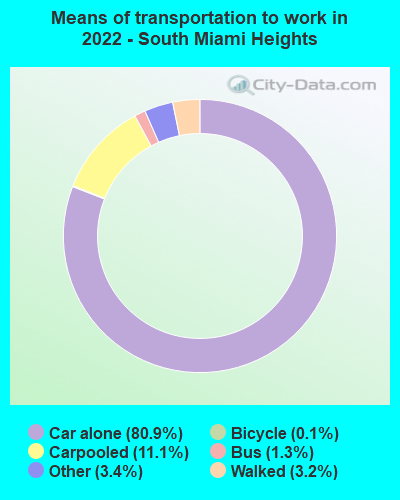
Means of transportation to work:
Drove a car alone: 3,254 (61.2%)Carpooled: 501 (9.4%)Bus : 51 (1.0%)Taxi: 172 (3.2%)Bicycle: 5 (0.1%)Walked: 146 (2.7%)Worked at home: 1,420 (26.7%)
Unemployment by race in 2022
Unemployment rate for White non-Hispanic residents 0.8% Males5.7% FemalesUnemployment rate for Black residents 5.1% Males6.9% FemalesUnemployment rate for American Indian and Alaska Native residents 12.1% Males30.8% FemalesUnemployment rate for Asian residents 11.1% FemalesUnemployment rate for other race residents 8.2% Males1.8% FemalesUnemployment rate for two or more race residents 3.0% Males3.5% FemalesUnemployment rate for Hispanic or Latino residents 4.8% Males3.9% Females
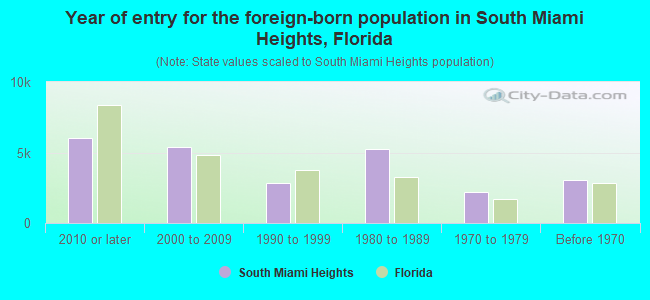
Year of entry for the foreign-born population in South Miami Heights, Florida
6,059 2010 or later 5,367 2000 to 2009 2,823 1990 to 1999 5,246 1980 to 1989 2,165 1970 to 1979 3,056 Before 1970
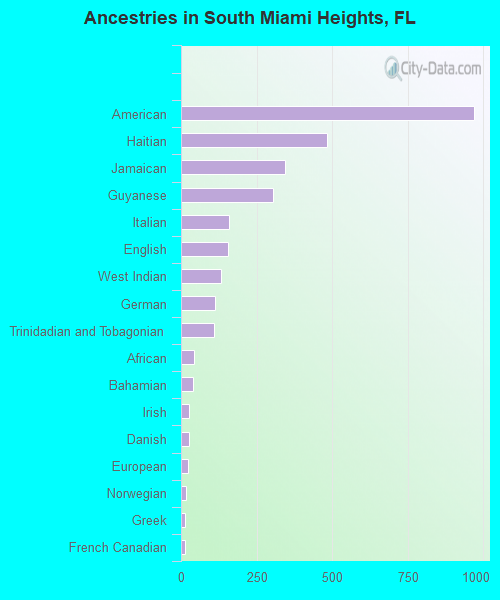
First ancestries reported:
American: 970 (3.9%)
Haitian: 484 (1.9%)
Jamaican: 344 (1.4%)
Guyanese: 303 (1.2%)
Italian: 159 (0.6%)
English: 157 (0.6%)
West Indian: 132 (0.5%)
German: 112 (0.4%)
Trinidadian and Tobagonian: 110 (0.4%)
African: 44 (0.2%)
Bahamian: 40 (0.2%)
Irish: 27 (0.1%)
Danish: 26 (0.1%)
European: 23 (0.09%)
Norwegian: 15 (0.06%)
Greek: 13 (0.05%)
French Canadian: 12 (0.05%)
Lebanese: 8 (0.03%)
Dutch: 8 (0.03%)
Portuguese: 8 (0.03%)
Armenian: 7 (0.03%)
Lithuanian: 6 (0.02%)
Scotch-Irish: 6 (0.02%)
Belizean: 6 (0.02%)
Turkish: 3 (0.01%)
Russian: 2 (0.01%) Most common places of birth for foreign-born residents (%): Cuba South Miami Heights:
59.3% (11,558)Florida:
22.0% (1,006,576)
Colombia South Miami Heights:
6.6% (1,290)Florida:
6.5% (298,669)
Guyana South Miami Heights:
3.8% (744)Florida:
0.7% (33,556)
Nicaragua South Miami Heights:
3.4% (662)Florida:
2.3% (105,066)
Mexico South Miami Heights:
3.4% (655)Florida:
5.6% (257,152)
Honduras South Miami Heights:
3.0% (583)Florida:
2.3% (107,160)
El Salvador South Miami Heights:
2.7% (533)Florida:
1.1% (49,838)
Dominican Republic South Miami Heights:
2.4% (461)Florida:
3.0% (137,727)
Jamaica South Miami Heights:
2.0% (389)Florida:
5.0% (227,319)
Place of birth for U.S.-born residents:
This state: 11,729Other state: 2,907Northeast: 1,541Midwest: 277South: 894West: 170 91.2% of South Miami Heights residents lived in the same house 1 years ago.
Out of people who lived in different houses, 45.1% lived in this county.
Out of people who lived in different counties, 18.8% lived in Florida.
South Miami Heights:
91.2%State average:
86.3%
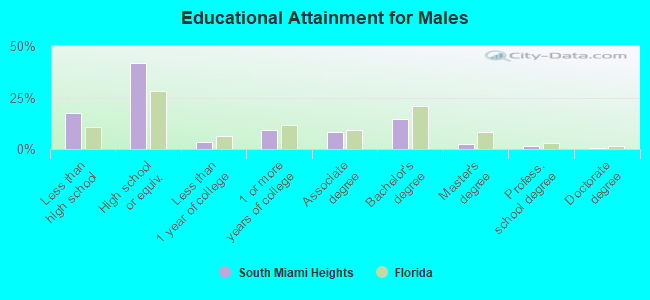
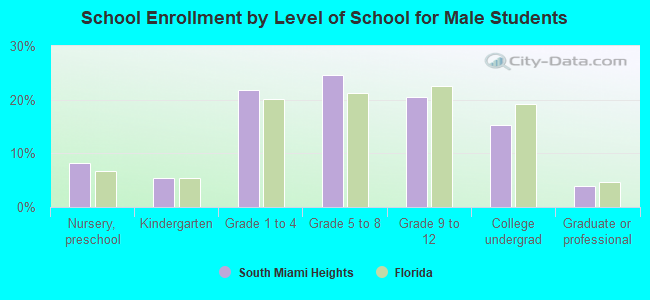
Education attainment for males 25 years and older:
No schooling: 353Nursery to 4th grade: 1045th and 6th grade: 3097th and 8th grade: 3199th grade: 32610th grade: 19311th grade: 16312th grade, no diploma: 469High school graduate (or equivalency): 5,310Less than 1 year of college: 455Some college more than 1 year, no degree: 1,151Associate degree: 1,050Bachelor's degree: 1,873Master's degree: 314Professional school degree: 213Doctorate degree: 72
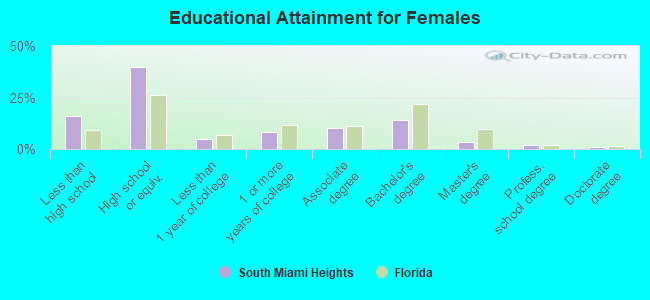
Education attainment for females 25 years and older:
No schooling: 281Nursery to 4th grade: 2055th and 6th grade: 2747th and 8th grade: 3229th grade: 40310th grade: 9911th grade: 8312th grade, no diploma: 426High school graduate (or equivalency): 5,165Less than 1 year of college: 660Some college more than 1 year, no degree: 1,077Associate degree: 1,337Bachelor's degree: 1,849Master's degree: 412Professional school degree: 274Doctorate degree: 103
Housing units in structures:
One, detached: 8,495One, attached: 428Two: 1583 or 4: 785 to 9: 11210 to 19: 19520 to 49: 64650 or more: 1,944Mobile homes: 40Housing units lacking complete plumbing facilities in 2022: 0.3%Housing units lacking complete kitchen facilities in 2022: 0.5%House/condo owner moved in on average 16 years ago
Renter moved in on average 3 years ago
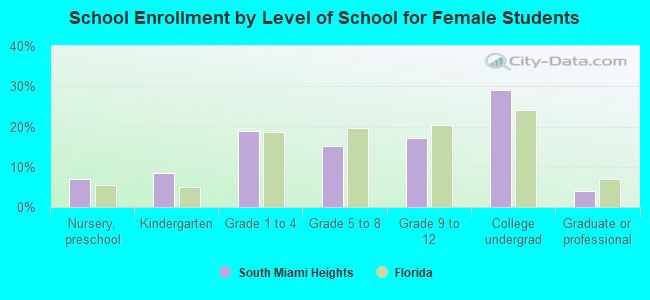
Private vs. public school enrollment:
Students in private schools in grades 1 to 8 (elementary and middle school): 307 Students in private schools in grades 9 to 12 (high school): 176 Students in private undergraduate colleges: 517