Rocky Mount, NC (North Carolina) Houses and Residents
| Rocky Mount: | $158,797 |
| North Carolina: | $280,600 |
Total population: 56,325 (Urban population: 54,275, Rural population: 1,969 (31 farm, 1,938 nonfarm))
Houses: 26,859 (22,953 occupied: 11,441 owner occupied, 11,477 renter occupied)
| % of renters here: | 50% |
| State: | 33% |
Housing density: 755 houses/condos per square mile
Median price asked for vacant for-sale houses and condos in 2022: $71,863.
Median contract rent in 2022: $661 (lower quartile is $437, upper quartile is $863)
Median rent asked for vacant for-rent units in 2022: $1,314
Median gross rent in Rocky Mount, NC in 2022: $885
Housing units in Rocky Mount with a mortgage: 6,545 (316 second mortgage, 0 home equity loan, 323 both second mortgage and home equity loan)
Houses without a mortgage: 92
Median household income for houses/condos with a mortgage: $77,634
Median household income for apartments without a mortgage: $40,541
Median monthly housing costs: $906
Compare current foreclosures in Rocky Mount, NC:
| Photo | Address | Area | Beds / Baths | Price | Details |
|---|---|---|---|---|---|

|
#1
Coleman Ave
Rocky Mount, NC 27801
|
1,086 sq. feet
|
1 baths 3 beds |
$150,000
|
show details |

|
#2
Clark St
Rocky Mount, NC 27801
|
1,380 sq. feet
|
1 baths 2 beds |
$153,000
|
show details |

|
#3
Henna St
Rocky Mount, NC 27801
|
1,054 sq. feet
|
1 baths 3 beds |
$135,000
|
show details |

|
#4
Nashville Rd
Rocky Mount, NC 27803
|
1,118 sq. feet
|
1 baths 2 beds |
$45,000
|
show details |

|
#5
Shellcastle Rd
Rocky Mount, NC 27804
|
4,691 sq. feet
|
4 baths 4 beds |
show details | |

|
#6
Benjamin Ct
Rocky Mount, NC 27803
|
1,634 sq. feet
|
2 baths 3 beds |
show details | |

|
#7
Berkley Dr
Rocky Mount, NC 27803
|
1,568 sq. feet
|
2 baths 4 beds |
show details | |

|
#8
Oakland Ave
Rocky Mount, NC 27804
|
1,720 sq. feet
|
2 baths 4 beds |
show details | |

|
#9
Periwinkle Pl
Rocky Mount, NC 27804
|
1,224 sq. feet
|
2 baths 3 beds |
show details | |

|
#10
Bethlehem Rd
Rocky Mount, NC 27803
|
2,229 sq. feet
|
2 baths 3 beds |
show details |
| Photo | Address | Area | Beds / Baths | Price | Details |
|---|---|---|---|---|---|

|
#11
Rouse Rd
Rocky Mount, NC 27801
|
838 sq. feet
|
2 baths 3 beds |
show details | |

|
#12
S Tillery St
Rocky Mount, NC 27804
|
1,860 sq. feet
|
1 baths 3 beds |
show details | |

|
#13
Park Ave
Rocky Mount, NC 27801
|
1,159 sq. feet
|
2 baths 3 beds |
show details | |

|
#14
Hunter Ridge Rd
Rocky Mount, NC 27803
|
1,476 sq. feet
|
2 baths 3 beds |
show details | |

|
#15
Nc Highway 43 N
Rocky Mount, NC 27801
|
1,400 sq. feet
|
2 baths 3 beds |
show details | |

|
#16
Garden Gate Dr
Rocky Mount, NC 27803
|
1,788 sq. feet
|
2 baths 3 beds |
show details | |

|
#17
Beechwood Dr
Rocky Mount, NC 27803
|
1,605 sq. feet
|
2 baths 2 beds |
show details | |

|
#18
Branch St
Rocky Mount, NC 27801
|
1,054 sq. feet
|
1 baths 2 beds |
show details | |

|
#19
W Haven Blvd
Rocky Mount, NC 27803
|
921 sq. feet
|
2 baths 2 beds |
show details | |

|
#20
Green Bank Ct
Rocky Mount, NC 27804
|
2,295 sq. feet
|
3 baths 3 beds |
show details |
| Photo | Address | Area | Beds / Baths | Price | Details |
|---|---|---|---|---|---|

|
#21
Herron St
Rocky Mount, NC 27803
|
1,875 sq. feet
|
2 baths 3 beds |
show details | |

|
#22
Mamas Run Ln
Rocky Mount, NC 27804
|
2,036 sq. feet
|
2 baths 3 beds |
show details | |

|
#23
Springfield Rd
Rocky Mount, NC 27801
|
1,132 sq. feet
|
2 baths 1 beds |
show details | |

|
#24
William Ct
Rocky Mount, NC 27803
|
1,370 sq. feet
|
2 baths 3 beds |
show details | |

|
#25
Wellington Ct
Rocky Mount, NC 27803
|
1,300 sq. feet
|
2 baths 3 beds |
show details | |

|
#26
River Run Rd
Rocky Mount, NC 27801
|
1,782 sq. feet
|
2 baths 3 beds |
show details | |

|
#27
Greyson Rd
Rocky Mount, NC 27804
|
1,812 sq. feet
|
2 baths 3 beds |
show details | |

|
#28
River Glenn Rd
Rocky Mount, NC 27803
|
2,041 sq. feet
|
3 baths 4 beds |
show details | |

|
#29
Crosswinds Dr
Rocky Mount, NC 27803
|
1,991 sq. feet
|
2 baths 3 beds |
show details | |

|
#30
Drexel Rd
Rocky Mount, NC 27803
|
1,320 sq. feet
|
2 baths 3 beds |
show details |
| Photo | Address | Area | Beds / Baths | Price | Details |
|---|---|---|---|---|---|

|
#31
York St
Rocky Mount, NC 27803
|
2,106 sq. feet
|
2 baths 5 beds |
show details | |

|
#32
Ridgecrest Dr
Rocky Mount, NC 27803
|
2,017 sq. feet
|
2 baths 4 beds |
show details | |

|
#33
River Run Rd
Rocky Mount, NC 27801
|
1,944 sq. feet
|
2 baths 3 beds |
show details | |

|
#34
Leggett Rd
Rocky Mount, NC 27801
|
1,000 sq. feet
|
1 baths 3 beds |
show details | |

|
#35
Eagles Ter
Rocky Mount, NC 27804
|
2,332 sq. feet
|
1 baths 4 beds |
show details | |

|
#36
Brookfield Dr
Rocky Mount, NC 27803
|
1,976 sq. feet
|
2 baths 3 beds |
show details | |

|
#37
Gwen St
Rocky Mount, NC 27803
|
1,353 sq. feet
|
1 baths 3 beds |
show details | |

|
#38
Waterloo Dr
Rocky Mount, NC 27804
|
1,918 sq. feet
|
2 baths 3 beds |
show details | |

|
#39
Heffner Rd
Rocky Mount, NC 27803
|
1,080 sq. feet
|
1 baths 2 beds |
show details | |

|
#40
Williford Rd
Rocky Mount, NC 27803
|
1,344 sq. feet
|
2 baths 3 beds |
show details |
| Photo | Address | Area | Beds / Baths | Price | Details |
|---|---|---|---|---|---|

|
#41
Old Sparta Rd
Rocky Mount, NC 27804
|
1,297 sq. feet
|
2 baths 3 beds |
show details | |

|
#42
Bulluck School Rd
Rocky Mount, NC 27801
|
2,052 sq. feet
|
2 baths 4 beds |
show details | |

|
#43
Autry Rd
Rocky Mount, NC 27803
|
1,062 sq. feet
|
2 baths 2 beds |
show details | |

|
#44
Drivers Cir
Rocky Mount, NC 27804
|
2,291 sq. feet
|
2 baths 4 beds |
show details | |

|
#45
Leggett Rd
Rocky Mount, NC 27801
|
1,025 sq. feet
|
1 baths 3 beds |
show details | |

|
#46
Bridgewood Rd
Rocky Mount, NC 27804
|
1,488 sq. feet
|
2 baths 3 beds |
show details | |

|
#47
Eastern Ave
Rocky Mount, NC 27801
|
1,496 sq. feet
|
2 baths 3 beds |
show details | |

|
#48
Heffner Rd
Rocky Mount, NC 27803
|
1,625 sq. feet
|
2 baths 3 beds |
show details | |

|
#49
Rose St
Rocky Mount, NC 27801
|
1,944 sq. feet
|
1 baths 3 beds |
show details | |

|
Check over 1 million property listings on Foreclosure.com!
|
browse all offers | |||


 | Rocky Mount: In Top 5 Most Desirable Home Markets in the U.S. (27 replies) |
| Any updates on Rocky Mount (20 replies) |
| Working in Winston/Rocky Mount- Need housing help! (6 replies) |
| Hoping to move to North Carolina. Rocky Mount: yes or no? (67 replies) |
| Lost on looking for a rental home (9 replies) |
| Rental Market Questions (15 replies) |

Median year apartment built: 1982
Household type by relationship:
Households: 54,702- Male householders: 9,633 (3,354 living alone), Female householders: 13,216 (4,781 living alone)
6,991 spouses (6,732 opposite-sex spouses), 1,903 unmarried partners, (1,875 opposite-sex unmarried partners), 15,617 children (14,841 natural, 216 adopted, 558 stepchildren), 3,358 grandchildren, 991 brothers or sisters, 297 parents, 33 foster children, 780 other relatives, 792 non-relatives
- In group quarters: 1,086
Size of family households: 5,698 2-persons, 4,103 3-persons, 2,128 4-persons, 810 5-persons, 428 6-persons, 55 7-or-more-persons.
Size of nonfamily households: 9,186 1-person, 637 2-persons, 94 3-persons, 17 5-persons.
4,099 married couples with children.
6,669 single-parent households (659 men, 6,010 women).
95.1% of residents of Rocky Mount speak English at home.
3.0% of residents speak Spanish at home (76% speak English very well, 7% speak English well, 8% speak English not well, 9% don't speak English at all).
0.6% of residents speak other Indo-European language at home (48% speak English very well, 48% speak English well, 4% don't speak English at all).
0.7% of residents speak Asian or Pacific Island language at home (51% speak English very well, 5% speak English well, 44% speak English not well).
0.6% of residents speak other language at home (99% speak English very well, 1% don't speak English at all).
Foreign born population: 1,587 (2.9%)
(70.6% of them are naturalized citizens)
| Here: | 6.1 |
| State: | 6.4 |
| Here: | 4.6 |
| State: | 4.4 |

- Bedrooms in owner-occupied houses and condos in Rocky Mount, North Carolina
- 0no bedroom
- 291 bedroom
- 1,8792 bedrooms
- 7,0773 bedrooms
- 2,1274 bedrooms
- 3295+ bedrooms

- Bedrooms in renter-occupied apartments in Rocky Mount, North Carolina
- 783no bedroom
- 1,4721 bedroom
- 4,5152 bedrooms
- 4,2943 bedrooms
- 3124 bedrooms
- 1015+ bedrooms

- Cars and other vehicles available in Rocky Mount in owner-occupied houses/condos
- 542no vehicle
- 3,3691 vehicle
- 4,1362 vehicles
- 2,2073 vehicles
- 8964 vehicles
- 2915+ vehicles

- Cars and other vehicles available in Rocky Mount in renter-occupied apartments
- 1,940no vehicle
- 5,1311 vehicle
- 3,5592 vehicles
- 7023 vehicles
- 864 vehicles
- 605+ vehicles

- Rooms in owner-occupied houses in Rocky Mount, North Carolina
- 01 room
- 02 rooms
- 1163 rooms
- 1,0484 rooms
- 2,8425 rooms
- 2,8706 rooms
- 1,8667 rooms
- 1,3688 rooms
- 1,3329+ rooms

- Rooms in renter-occupied apartments in Rocky Mount, North Carolina
- 7831 room
- 3632 rooms
- 1,5203 rooms
- 2,7904 rooms
- 3,2255 rooms
- 1,6296 rooms
- 6207 rooms
- 3228 rooms
- 2289+ rooms


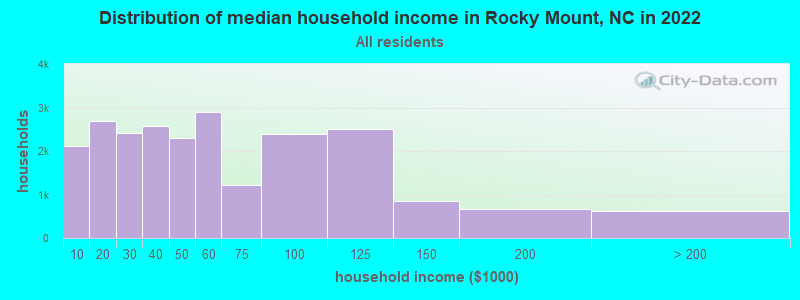
Rocky Mount, NC household income distribution

- 2,110Less than $10,000
- 2,683$10,000 to $19,999
- 2,418$20,000 to $29,999
- 2,573$30,000 to $39,999
- 2,304$40,000 to $49,999
- 2,889$50,000 to $59,999
- 1,226$60,000 to $74,999
- 2,386$75,000 to $99,999
- 2,515$100,000 to $124,999
- 849$125,000 to $149,999
- 676$150,000 to $199,999
- 610$200,000 or more
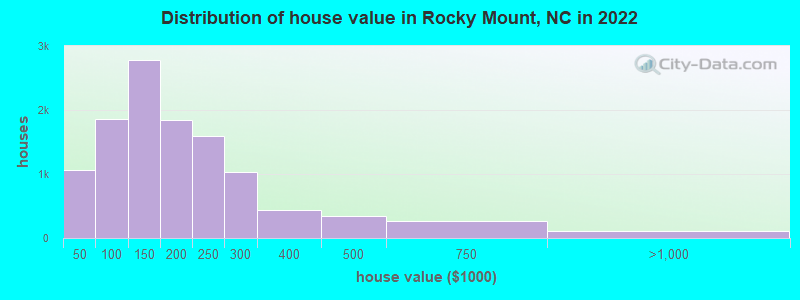
Home value of owner - occupied houses in 2022 in Rocky Mount, NC
-
- 223Less than $10,000
- 200$10,000 to $14,999
- 115$15,000 to $19,999
- 170$20,000 to $24,999
- 69$25,000 to $29,999
- 21$30,000 to $34,999
- 178$35,000 to $39,999
- 78$40,000 to $49,999
- 342$50,000 to $59,999
- 189$60,000 to $69,999
- 287$70,000 to $79,999
- 579$80,000 to $89,999
- 381$90,000 to $99,999
- 1,475$100,000 to $124,999
- 1,305$125,000 to $149,999
- 965$150,000 to $174,999
- 870$175,000 to $199,999
- 1,597$200,000 to $249,999
- 1,026$250,000 to $299,999
- 439$300,000 to $399,999
- 351$400,000 to $499,999
- 268$500,000 to $749,999
- 62$750,000 to $999,999
- 34$1,000,000 to $1,499,999
- 10$1,500,000 to $1,999,999
Rent paid by renters in 2022 in Rocky Mount, NC
-
- 105Less than $100
- 422$100 to $149
- 229$150 to $199
- 201$200 to $249
- 469$250 to $299
- 198$300 to $349
- 813$350 to $399
- 724$400 to $449
- 562$450 to $499
- 958$500 to $549
- 493$550 to $599
- 737$600 to $649
- 1,147$650 to $699
- 964$700 to $749
- 490$750 to $799
- 1,896$800 to $899
- 394$900 to $999
- 1,193$1,000 to $1,249
- 379$1,250 to $1,499
- 72$1,500 to $1,999
- 39$3,000 to $3,499
- 517No cash rent


Percentage of workers working in this county: 58.4%
Number of people working at home: 1,867 (7.6% of all workers)
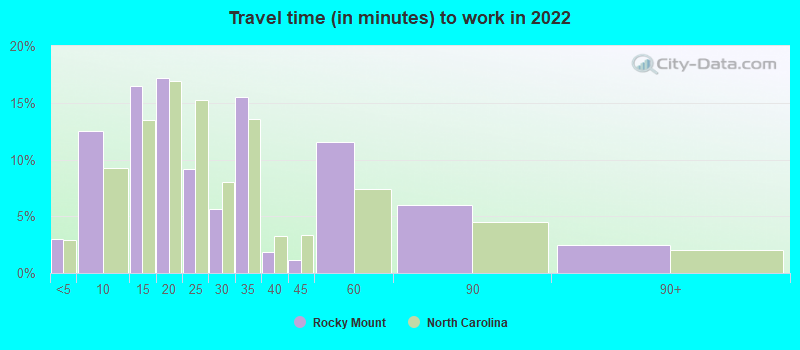
Travel time to work (commute)
- Less than 5 minutes: 812
- 5 to 9 minutes: 2,792
- 10 to 14 minutes: 4,931
- 15 to 19 minutes: 3,332
- 20 to 24 minutes: 1,334
- 25 to 29 minutes: 917
- 30 to 34 minutes: 2,964
- 35 to 39 minutes: 344
- 40 to 44 minutes: 826
- 45 to 59 minutes: 1,400
- 60 to 89 minutes: 1,159
- 90 or more minutes: 324
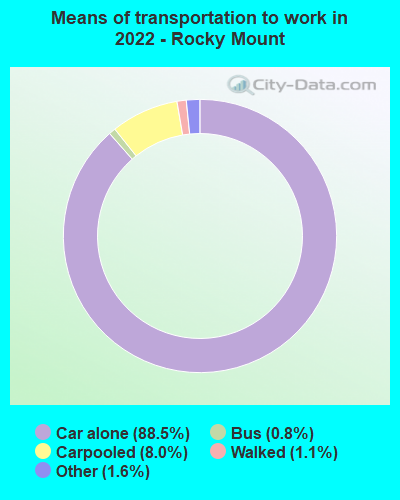
Means of transportation to work:
- Drove a car alone: 27,196 (80.3%)
- Carpooled: 2,582 (7.6%)
- Bus: 173 (0.5%)
- Taxi: 495 (1.5%)
- Walked: 355 (1.0%)
- Worked at home: 1,867 (5.5%)

- Unemployment by race in 2022
- Unemployment rate for White non-Hispanic residents
- 7.2%Males
- 3.3%Females
- Unemployment rate for Black residents
- 5.2%Males
- 4.7%Females
- Unemployment rate for American Indian and Alaska Native residents
- 33.8%Females
- Unemployment rate for other race residents
- 1.3%Males
- Unemployment rate for two or more race residents
- 19.4%Males
- 20.5%Females
- Unemployment rate for Hispanic or Latino residents
- 2.2%Males
- 5.0%Females

- Year of entry for the foreign-born population in Rocky Mount, North Carolina
- 6942010 or later
- 3212000 to 2009
- 2981990 to 1999
- 3541980 to 1989
- 1371970 to 1979
- 186Before 1970
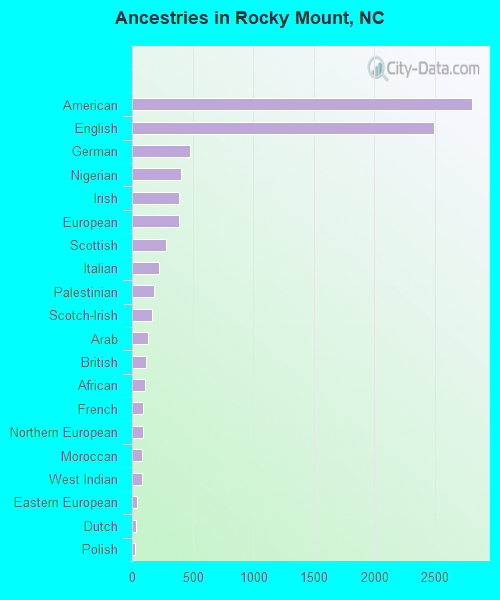
First ancestries reported:
- American: 2,809 (7.5%)
- English: 2,494 (6.7%)
- German: 482 (1.3%)
- Nigerian: 404 (1.1%)
- Irish: 390 (1.0%)
- European: 387 (1.0%)
- Scottish: 278 (0.7%)
- Italian: 221 (0.6%)
- Palestinian: 179 (0.5%)
- Scotch-Irish: 167 (0.4%)
- Arab: 136 (0.4%)
- British: 112 (0.3%)
- African: 111 (0.3%)
- French: 88 (0.2%)
- Northern European: 88 (0.2%)
- Moroccan: 81 (0.2%)
- West Indian: 79 (0.2%)
- Eastern European: 39 (0.1%)
- Dutch: 29 (0.08%)
- Polish: 28 (0.08%)
- Norwegian: 24 (0.06%)
- British West Indian: 14 (0.04%)
- Jamaican: 8 (0.02%)
- Ukrainian: 6 (0.02%)
- Greek: 5 (0.01%)
Most common places of birth for foreign-born residents (%):
| Rocky Mount: | 19.2% (332) |
| North Carolina: | 24.7% (214,776) |
| Rocky Mount: | 10.6% (184) |
| North Carolina: | 1.8% (15,988) |
| Rocky Mount: | 8.3% (144) |
| North Carolina: | 9.3% (80,594) |
| Rocky Mount: | 7.8% (135) |
| North Carolina: | 4.7% (40,707) |
| Rocky Mount: | 6.9% (119) |
| North Carolina: | 2.4% (20,695) |
| Rocky Mount: | 5.6% (97) |
| North Carolina: | 3.8% (33,379) |
| Rocky Mount: | 4.5% (78) |
| North Carolina: | 1.8% (15,534) |
| Rocky Mount: | 3.5% (61) |
| North Carolina: | 2.6% (22,964) |
| Rocky Mount: | 3.2% (56) |
| North Carolina: | 1.2% (10,140) |
| Rocky Mount: | 3.2% (56) |
| North Carolina: | 2.1% (18,275) |
| Rocky Mount: | 2.7% (46) |
| North Carolina: | 0.1% (1,029) |
| Rocky Mount: | 2.4% (41) |
| North Carolina: | 1.0% (9,005) |
| Rocky Mount: | 2.1% (36) |
| North Carolina: | 2.1% (18,105) |
| Rocky Mount: | 1.9% (33) |
| North Carolina: | 0.1% (552) |
| Rocky Mount: | 1.8% (32) |
| North Carolina: | 3.2% (27,477) |
| Rocky Mount: | 1.8% (31) |
| North Carolina: | 0.5% (4,032) |
| Rocky Mount: | 1.7% (30) |
| North Carolina: | 0.3% (2,638) |
Place of birth for U.S.-born residents:
- This state: 39,286
- Other state: 13,716
- Northeast: 5,316
- Midwest: 1,581
- South: 6,678
- West: 222
88.9% of Rocky Mount residents lived in the same house 1 years ago.
Out of people who lived in different houses, 24.9% lived in this county.
Out of people who lived in different counties, 56.9% lived in North Carolina.
| Rocky Mount: | 88.9% |
| State average: | 87.3% |
Education attainment for males 25 years and older:
- No schooling: 74
- Nursery to 4th grade: 44
- 5th and 6th grade: 41
- 7th and 8th grade: 474
- 9th grade: 457
- 10th grade: 1,185
- 11th grade: 1,532
- 12th grade, no diploma: 279
- High school graduate (or equivalency): 6,398
- Less than 1 year of college: 1,376
- Some college more than 1 year, no degree: 1,873
- Associate degree: 891
- Bachelor's degree: 1,739
- Master's degree: 616
- Professional school degree: 225
- Doctorate degree: 38

Education attainment for females 25 years and older:
- No schooling: 144
- Nursery to 4th grade: 18
- 5th and 6th grade: 50
- 7th and 8th grade: 323
- 9th grade: 625
- 10th grade: 638
- 11th grade: 924
- 12th grade, no diploma: 352
- High school graduate (or equivalency): 5,786
- Less than 1 year of college: 757
- Some college more than 1 year, no degree: 4,384
- Associate degree: 1,668
- Bachelor's degree: 3,374
- Master's degree: 2,015
- Professional school degree: 88
- Doctorate degree: 31


Housing units in structures:
- One, detached: 17,641
- One, attached: 643
- Two: 2,121
- 3 or 4: 1,457
- 5 to 9: 1,684
- 10 to 19: 1,029
- 20 to 49: 168
- 50 or more: 416
- Mobile homes: 1,698
Median worth of mobile homes: $12,831
Housing units lacking complete kitchen facilities in 2022: 4.6%
House/condo owner moved in on average 14 years ago
Renter moved in on average 5 years ago

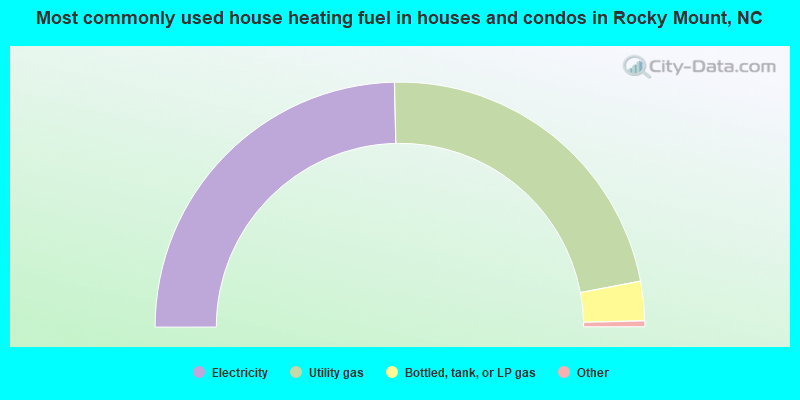
- 49.3%Electricity
- 44.7%Utility gas
- 5.2%Bottled, tank, or LP gas
- 0.5%Fuel oil, kerosene, etc.
- 0.3%No fuel used
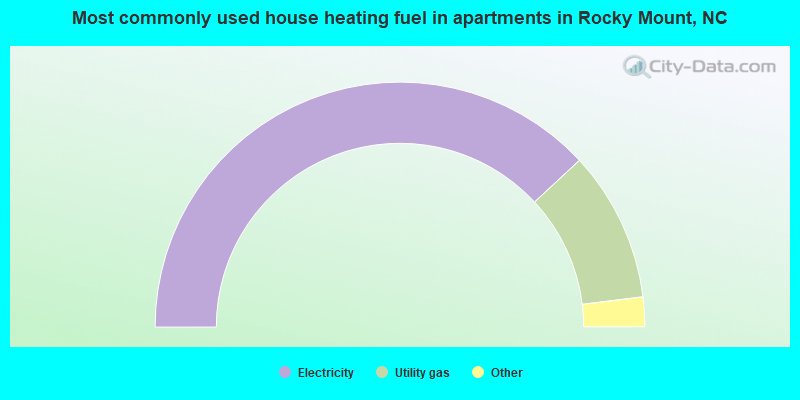
- 76.2%Electricity
- 19.9%Utility gas
- 2.0%Bottled, tank, or LP gas
- 1.1%Fuel oil, kerosene, etc.
- 0.8%No fuel used
Private vs. public school enrollment:
| Here: | 19.8% |
| North Carolina: | 13.8% |
| Here: | 11.6% |
| North Carolina: | 11.9% |
| Here: | 23.8% |
| North Carolina: | 19.3% |


