Riverside, MD (Maryland) Houses and Residents
| Riverside: | $237,316 |
| Maryland: | $398,100 |
Mean price in 2022:
Detached houses: $355,553
Here: $355,553 State: $526,819 Townhouses or other attached units: $191,168
Here: $191,168 State: $328,305 In 5-or-more-unit structures: $147,910
Here: $147,910 State: $350,378
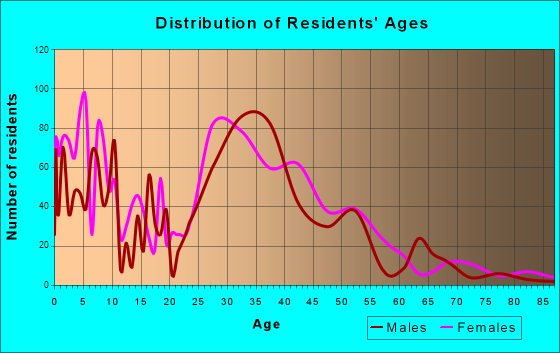
Total population: 6,425 (Urban population: 6,121, Rural population: 0)
Houses: 2,666 (2,645 occupied: 1,688 owner occupied, 984 renter occupied)
| % of renters here: | 37% |
| State: | 32% |
Housing density: 1,105 houses/condos per square mile
Median price asked for vacant for-sale houses and condos in 2022 in this county: $260,299.
Median contract rent in 2022: $1,614 (lower quartile is $1,284, upper quartile is $1,907)
Median rent asked for vacant for-rent units in 2022: $1,582
Median gross rent in Riverside, MD in 2022: $1,799
Housing units in Riverside with a mortgage: 1,352 (73 second mortgage, 0 home equity loan, 74 both second mortgage and home equity loan)
Houses without a mortgage: 23
Median household income for houses/condos with a mortgage: $88,890
Median monthly housing costs: $1,437
Compare current foreclosures near Riverside, MD:
| Photo | Address | Area | Beds / Baths | Price | Details |
|---|---|---|---|---|---|

|
#1
Rossville Blvd
Rosedale, MD 21237
|
2,561 sq. feet
|
2 baths 4 beds |
$599,900
|
show details |

|
#2
Windpine Rd
Middle River, MD 21220
|
1,220 sq. feet
|
2 baths 3 beds |
$254,000
|
show details |

|
#3
Renaissance Dr
Essex, MD 21221
|
2,244 sq. feet
|
2 baths 3 beds |
$428,900
|
show details |

|
#4
Harford Square Dr
Edgewood, MD 21040
|
1,408 sq. feet
|
2 baths 3 beds |
$172,000
|
show details |

|
#5
Tapu Ct
Nottingham, MD 21236
|
1,162 sq. feet
|
1 baths 3 beds |
$218,500
|
show details |

|
#6
Old Level Rd
Havre De Grace, MD 21078
|
1,248 sq. feet
|
1 baths 3 beds |
$234,900
|
show details |

|
#7
W Spring Meadow Ct
Edgewood, MD 21040
|
1,110 sq. feet
|
1 baths 2 beds |
$249,900
|
show details |

|
#8
Southridge Dr
Edgewood, MD 21040
|
1,244 sq. feet
|
2 baths 3 beds |
$344,900
|
show details |

|
#9
Liberty Grove Rd
Colora, MD 21917
|
4,212 sq. feet
|
3 baths 5 beds |
show details | |

|
#10
Riverview Dr
Perryville, MD 21903
|
1,080 sq. feet
|
1 baths 4 beds |
show details |
| Photo | Address | Area | Beds / Baths | Price | Details |
|---|---|---|---|---|---|

|
#11
Catalpa Ln
Edgewood, MD 21040
|
2,006 sq. feet
|
2 baths 4 beds |
show details | |

|
#12
Aaron Mee Way
Rosedale, MD 21237
|
2,728 sq. feet
|
4 baths 4 beds |
show details | |

|
#13
Guinevere Ct
Rosedale, MD 21237
|
1,152 sq. feet
|
2 baths 3 beds |
show details | |

|
#14
Sturgill Dr
Bel Air, MD 21015
|
680 sq. feet
|
2 baths 2 beds |
show details | |

|
#15
Timothy Dr
Abingdon, MD 21009
|
1,152 sq. feet
|
2 baths 2 beds |
show details | |

|
#16
Cross Ln
Abingdon, MD 21009
|
924 sq. feet
|
1 baths 2 beds |
show details | |

|
#17
Old Stepney Rd
Aberdeen, MD 21001
|
1,656 sq. feet
|
2 baths 4 beds |
show details | |

|
#18
Garland Ct
Bel Air, MD 21014
|
1,888 sq. feet
|
3 baths 5 beds |
show details | |

|
#19
Lyndale Ave
Nottingham, MD 21236
|
1,160 sq. feet
|
1 baths 3 beds |
show details | |

|
#20
Shore Dr
Joppa, MD 21085
|
1,402 sq. feet
|
3 baths 3 beds |
show details |
| Photo | Address | Area | Beds / Baths | Price | Details |
|---|---|---|---|---|---|

|
#21
Marigold Ln
Belcamp, MD 21017
|
1,744 sq. feet
|
2 baths 3 beds |
show details | |

|
#22
W Shore Dr
Edgewood, MD 21040
|
1,166 sq. feet
|
1 baths 3 beds |
show details | |

|
#23
Swamp Rd
Worton, MD 21678
|
760 sq. feet
|
1 baths 2 beds |
show details | |

|
#24
Ridge Rd
Nottingham, MD 21236
|
1,226 sq. feet
|
2 baths 3 beds |
show details | |

|
#25
Vincent Farm Ln
White Marsh, MD 21162
|
2,224 sq. feet
|
2 baths 3 beds |
show details | |

|
#26
Lennings Knoll Ct
Rosedale, MD 21237
|
1,860 sq. feet
|
2 baths - beds |
show details | |

|
#27
Corns Dr
Bel Air, MD 21015
|
1,800 sq. feet
|
1 baths - beds |
show details | |

|
#28
Holly Grove Rd
Middle River, MD 21220
|
1,422 sq. feet
|
2 baths - beds |
show details | |

|
#29
Twin Brook Ln
Joppa, MD 21085
|
1,344 sq. feet
|
2 baths - beds |
show details | |

|
#30
California Ave
Parkville, MD 21234
|
1,176 sq. feet
|
1 baths - beds |
show details |
| Photo | Address | Area | Beds / Baths | Price | Details |
|---|---|---|---|---|---|

|
#31
Tintah Rd
Chestertown, MD 21620
|
1,404 sq. feet
|
2 baths - beds |
show details | |

|
#32
Myers Orchard Way
Perry Hall, MD 21128
|
3,243 sq. feet
|
4 baths - beds |
show details | |

|
#33
Cool Springs Rd
North East, MD 21901
|
- sq. feet
|
2 baths 3 beds |
show details | |

|
#34
Pine Creek Way
Abingdon, MD 21009
|
2,994 sq. feet
|
2 baths - beds |
show details | |

|
#35
Bladen Rd
Essex, MD 21221
|
1,008 sq. feet
|
1 baths - beds |
show details | |

|
#36
Bayscape Dr
Perryville, MD 21903
|
1,836 sq. feet
|
2 baths - beds |
show details | |

|
#37
Vicky Rd
Nottingham, MD 21236
|
1,898 sq. feet
|
1 baths - beds |
show details | |

|
#38
Hanford Rd
Rosedale, MD 21237
|
1,816 sq. feet
|
2 baths - beds |
show details | |

|
#39
Jarwood Rd
Rosedale, MD 21237
|
1,652 sq. feet
|
2 baths - beds |
show details | |

|
#40
Starboard Ct
Perryville, MD 21903
|
1,350 sq. feet
|
1 baths - beds |
show details |
| Photo | Address | Area | Beds / Baths | Price | Details |
|---|---|---|---|---|---|

|
#41
Main St
Betterton, MD 21610
|
1,772 sq. feet
|
1 baths - beds |
show details | |

|
#42
Kosoak Rd
Middle River, MD 21220
|
1,530 sq. feet
|
2 baths - beds |
show details | |

|
#43
Lindsey Ct
Essex, MD 21221
|
1,996 sq. feet
|
2 baths - beds |
show details | |

|
#44
Joggins Ct
Middle River, MD 21220
|
1,485 sq. feet
|
1 baths - beds |
show details | |

|
#45
Norman Rd
Port Deposit, MD 21904
|
1,167 sq. feet
|
1 baths - beds |
show details | |

|
#46
Bird River Rd
Middle River, MD 21220
|
1,920 sq. feet
|
2 baths - beds |
show details | |

|
#47
Dunstan Ln
Monkton, MD 21111
|
3,144 sq. feet
|
4 baths - beds |
show details | |

|
#48
Keithley Rd
White Marsh, MD 21162
|
1,084 sq. feet
|
3 baths - beds |
show details | |

|
#49
Cowenton Ave
Perry Hall, MD 21128
|
4,474 sq. feet
|
5 baths - beds |
show details | |

|
Check over 1 million property listings on Foreclosure.com!
|
browse all offers | |||

Latest news about housing in Riverside, MD collected exclusively by city-data.com from local newspapers, TV, and radio stations

 | South Baltimore/Riverside/Locust Point/Federal Hill prime area for gentrification? (18 replies) |
| Riverdale Park Station - News, Events, Updates, Questions and Developments Etc. (498 replies) |
| Irish couple 29-27 moving to Baltimore (96 replies) |
| They finally arrested a couple of squeegee kids... (111 replies) |
| Weekend in Baltimore, what neighborhood?? (4 replies) |
| From Florida to Baltimore! (55 replies) |
Median year apartment built: 1991
Household type by relationship:
Households: 5,987- Male householders: 1,264 (333 living alone), Female householders: 1,367 (598 living alone)
1,165 spouses (1,165 opposite-sex spouses), 197 unmarried partners, (197 opposite-sex unmarried partners), 1,363 children (1,323 natural, 28 adopted, 12 stepchildren), 72 grandchildren, 3 brothers or sisters, 50 parents, 0 foster children, 8 other relatives, 344 non-relatives
- In group quarters: 150
Size of family households: 626 2-persons, 393 3-persons, 231 4-persons, 52 5-persons, 36 6-persons, 13 7-or-more-persons.
Size of nonfamily households: 1,029 1-person, 174 2-persons, 178 3-persons.
792 married couples with children.
234 single-parent households (18 men, 216 women).
88.1% of residents of Riverside speak English at home.
2.6% of residents speak Spanish at home (69% speak English very well, 31% speak English well).
4.2% of residents speak other Indo-European language at home (76% speak English very well, 24% speak English well).
2.9% of residents speak Asian or Pacific Island language at home (60% speak English very well, 40% speak English not well).
1.3% of residents speak other language at home (100% speak English very well).
Foreign born population: 870 (14.5%)
(87.0% of them are naturalized citizens)
| Here: | 6.6 |
| State: | 7.3 |
| Here: | 4.7 |
| State: | 4.2 |

- Bedrooms in owner-occupied houses and condos in Riverside, Maryland
- 0no bedroom
- 341 bedroom
- 4112 bedrooms
- 9573 bedrooms
- 2434 bedrooms
- 445+ bedrooms

- Bedrooms in renter-occupied apartments in Riverside, Maryland
- 0no bedroom
- 1021 bedroom
- 5482 bedrooms
- 3083 bedrooms
- 04 bedrooms
- 275+ bedrooms

- Cars and other vehicles available in Riverside in owner-occupied houses/condos
- 8no vehicle
- 6511 vehicle
- 6242 vehicles
- 3683 vehicles
- 324 vehicles
- 55+ vehicles

- Cars and other vehicles available in Riverside in renter-occupied apartments
- 13no vehicle
- 4981 vehicle
- 3962 vehicles
- 773 vehicles
- 04 vehicles
- 05+ vehicles

- Rooms in owner-occupied houses in Riverside, Maryland
- 01 room
- 342 rooms
- 93 rooms
- 864 rooms
- 2325 rooms
- 4306 rooms
- 4367 rooms
- 1828 rooms
- 2799+ rooms

- Rooms in renter-occupied apartments in Riverside, Maryland
- 01 room
- 02 rooms
- 1003 rooms
- 4534 rooms
- 1785 rooms
- 1036 rooms
- 777 rooms
- 488 rooms
- 279+ rooms


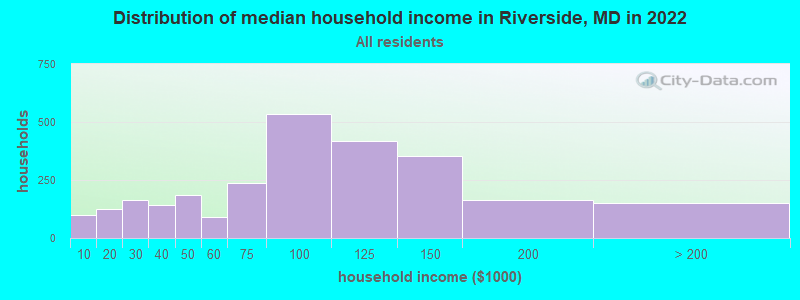
Riverside, MD household income distribution

- 100Less than $10,000
- 123$10,000 to $19,999
- 164$20,000 to $29,999
- 144$30,000 to $39,999
- 185$40,000 to $49,999
- 90$50,000 to $59,999
- 239$60,000 to $74,999
- 535$75,000 to $99,999
- 419$100,000 to $124,999
- 355$125,000 to $149,999
- 165$150,000 to $199,999
- 151$200,000 or more
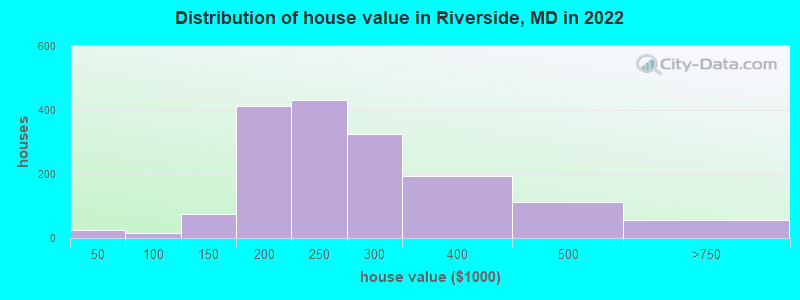
Home value of owner - occupied houses in 2022 in Riverside, MD
-
- 7$15,000 to $19,999
- 15$40,000 to $49,999
- 7$100,000 to $124,999
- 68$125,000 to $149,999
- 171$150,000 to $174,999
- 240$175,000 to $199,999
- 432$200,000 to $249,999
- 323$250,000 to $299,999
- 192$300,000 to $399,999
- 112$400,000 to $499,999
- 54$500,000 to $749,999
Rent paid by renters in 2022 in Riverside, MD
-
- 18$100 to $149
- 9$700 to $749
- 22$900 to $999
- 95$1,000 to $1,249
- 269$1,250 to $1,499
- 397$1,500 to $1,999
- 139$2,000 to $2,499


Percentage of workers working in this county: 66.4%
Number of people working at home: 431 (11.1% of all workers)
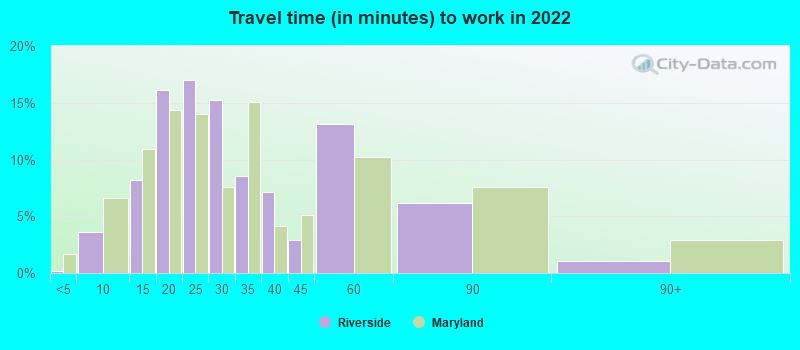
Travel time to work (commute)
- Less than 5 minutes: 54
- 5 to 9 minutes: 111
- 10 to 14 minutes: 385
- 15 to 19 minutes: 401
- 20 to 24 minutes: 523
- 25 to 29 minutes: 345
- 30 to 34 minutes: 567
- 35 to 39 minutes: 161
- 40 to 44 minutes: 80
- 45 to 59 minutes: 459
- 60 to 89 minutes: 181
- 90 or more minutes: 117
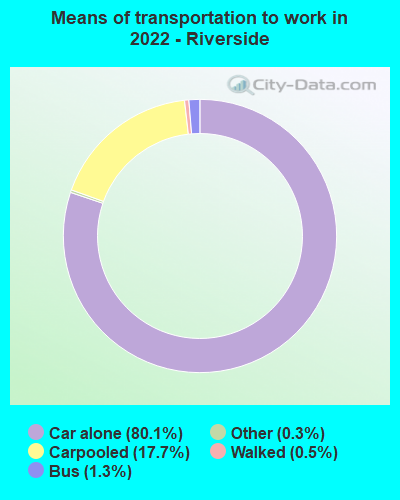
Means of transportation to work:
- Drove a car alone: 2,633 (69.2%)
- Carpooled: 620 (16.3%)
- Bus: 33 (0.9%)
- Taxi: 9 (0.2%)
- Walked: 16 (0.4%)
- Worked at home: 428 (11.2%)

- Unemployment by race in 2022
- Unemployment rate for White non-Hispanic residents
- 1.6%Males
- Unemployment rate for Black residents
- 1.0%Males
- 0.4%Females
- Unemployment rate for Asian residents
- 9.0%Males

- Year of entry for the foreign-born population in Riverside, Maryland
- 642010 or later
- 1572000 to 2009
- 1241990 to 1999
- 81980 to 1989
- 421970 to 1979
- 103Before 1970
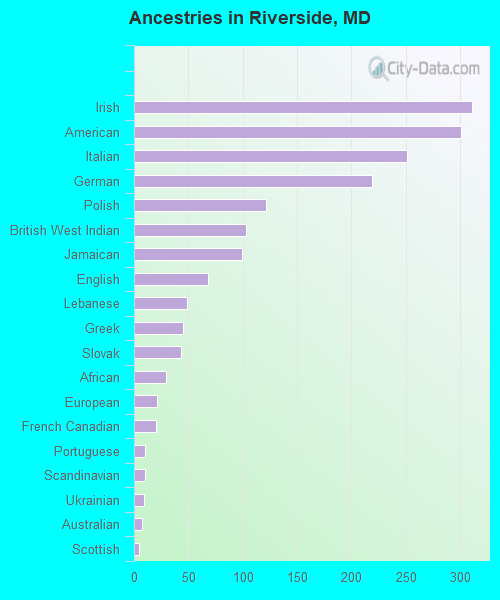
First ancestries reported:
- Irish: 311 (10.5%)
- American: 301 (10.1%)
- Italian: 251 (8.5%)
- German: 219 (7.4%)
- Polish: 121 (4.1%)
- British West Indian: 103 (3.5%)
- Jamaican: 99 (3.3%)
- English: 68 (2.3%)
- Lebanese: 49 (1.7%)
- Greek: 45 (1.5%)
- Slovak: 43 (1.4%)
- African: 29 (1.0%)
- European: 21 (0.7%)
- French Canadian: 20 (0.7%)
- Portuguese: 10 (0.3%)
- Scandinavian: 10 (0.3%)
- Ukrainian: 9 (0.3%)
- Australian: 7 (0.2%)
- Scottish: 5 (0.2%)
Most common places of birth for foreign-born residents (%):
| Riverside: | 12.7% (98) |
| Maryland: | 1.8% (17,774) |
| Riverside: | 11.3% (87) |
| Maryland: | 3.4% (32,635) |
| Riverside: | 11.0% (85) |
| Maryland: | 2.8% (27,444) |
| Riverside: | 10.5% (81) |
| Maryland: | 0.1% (792) |
| Riverside: | 9.8% (76) |
| Maryland: | 1.2% (11,265) |
| Riverside: | 6.6% (51) |
| Maryland: | 0.2% (1,473) |
| Riverside: | 4.7% (36) |
| Maryland: | 0.4% (3,418) |
| Riverside: | 4.3% (33) |
| Maryland: | 3.8% (36,698) |
| Riverside: | 4.3% (33) |
| Maryland: | 0.3% (2,475) |
| Riverside: | 4.3% (33) |
| Maryland: | 1.8% (17,161) |
| Riverside: | 3.2% (25) |
| Maryland: | 12.0% (115,412) |
| Riverside: | 2.6% (20) |
| Maryland: | 0.3% (2,848) |
| Riverside: | 2.2% (17) |
| Maryland: | 0.3% (3,238) |
| Riverside: | 1.7% (13) |
| Maryland: | 0.6% (5,828) |
Place of birth for U.S.-born residents:
- This state: 3,438
- Other state: 1,675
- Northeast: 894
- Midwest: 116
- South: 477
- West: 220
74.7% of Riverside residents lived in the same house 1 years ago.
Out of people who lived in different houses, 35.1% lived in this county.
Out of people who lived in different counties, 81.0% lived in Maryland.
| Riverside: | 74.7% |
| State average: | 88.5% |
Education attainment for males 25 years and older:
- No schooling: 0
- Nursery to 4th grade: 0
- 5th and 6th grade: 0
- 7th and 8th grade: 0
- 9th grade: 0
- 10th grade: 0
- 11th grade: 13
- 12th grade, no diploma: 26
- High school graduate (or equivalency): 483
- Less than 1 year of college: 349
- Some college more than 1 year, no degree: 260
- Associate degree: 267
- Bachelor's degree: 459
- Master's degree: 142
- Professional school degree: 0
- Doctorate degree: 53

Education attainment for females 25 years and older:
- No schooling: 0
- Nursery to 4th grade: 0
- 5th and 6th grade: 0
- 7th and 8th grade: 0
- 9th grade: 0
- 10th grade: 6
- 11th grade: 24
- 12th grade, no diploma: 0
- High school graduate (or equivalency): 499
- Less than 1 year of college: 196
- Some college more than 1 year, no degree: 250
- Associate degree: 229
- Bachelor's degree: 536
- Master's degree: 464
- Professional school degree: 0
- Doctorate degree: 40

Housing units in structures:
- One, detached: 677
- One, attached: 1,192
- Two: 37
- 5 to 9: 170
- 10 to 19: 548
- 50 or more: 39
Housing units lacking complete kitchen facilities in 2022: 1.4%
House/condo owner moved in on average 10 years ago
Renter moved in on average 2 years ago

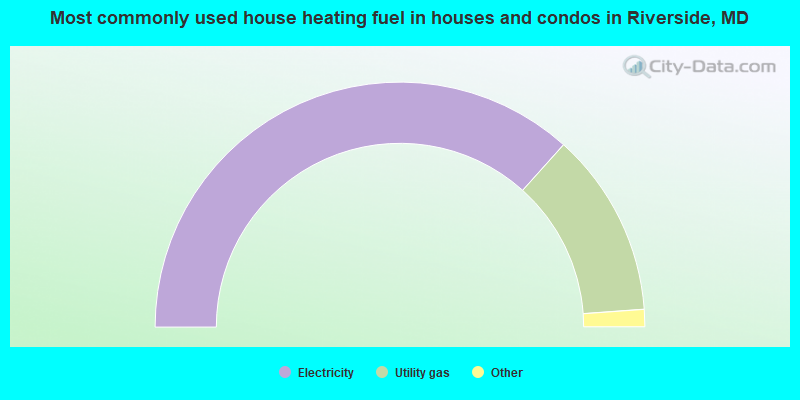
- 73.3%Electricity
- 24.4%Utility gas
- 1.4%Solar energy
- 0.5%Other fuel
- 0.3%Fuel oil, kerosene, etc.
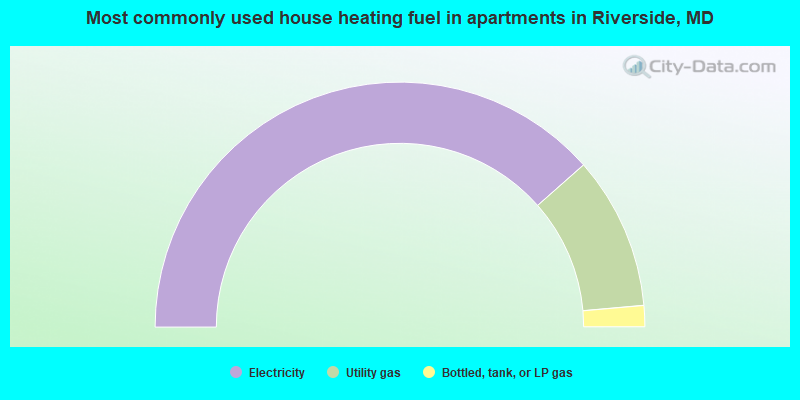
- 77.0%Electricity
- 20.2%Utility gas
- 2.8%Bottled, tank, or LP gas
Private vs. public school enrollment:
| Here: | 5.0% |
| Maryland: | 15.2% |
| Here: | 11.4% |
| Maryland: | 14.4% |
| Here: | 9.1% |
| Maryland: | 20.2% |


