Richmond, VA (Virginia) Houses and Residents
Estimated median house or condo value in 2022: $346,800 (it was $87,400 in 2000 )
Richmond:
$346,800Virginia:
$365,700
Lower value quartile - upper value quartile: $237,600 - $498,800Mean price in 2022: Detached houses: $418,611 Here:
$418,611State:
$472,865
Townhouses or other attached units: $534,021 Here:
$534,021State:
$457,437
In 2-unit structures: $369,095 Here:
$369,095State:
$396,289
In 3-to-4-unit structures: $346,898 Here:
$346,898State:
$252,346
In 5-or-more-unit structures: $239,171 Here:
$239,171State:
$382,551
Mobile homes: $80,545 Here:
$80,545State:
$100,736
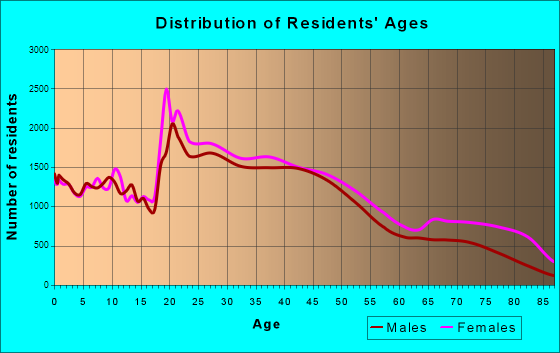
Total population: 217,853 (Urban population: 197,790, Rural population: 0)
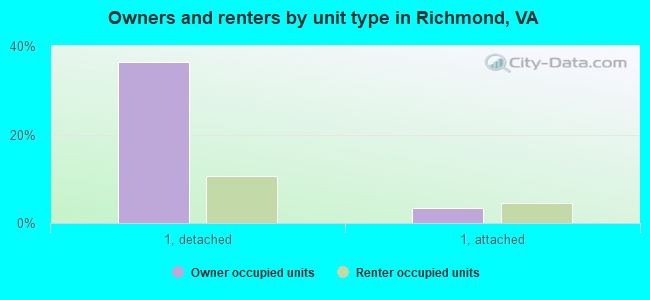
Houses: 113,473 (106,252 occupied: 46,019 owner occupied, 60,233 renter occupied )
% of renters here:
57%State:
33%
Housing density: 1,889 houses/condos per square mile
Median price asked for vacant for-sale houses and condos in 2022: $529,630.
Median contract rent in 2022: $1,050 (lower quartile is $819, upper quartile is $1,352)
Median rent asked for vacant for-rent units in 2022: $875
Median gross rent in Richmond, VA in 2022: $1,192
Housing units in Richmond with a mortgage: 32,582 (3,528 second mortgage, 0 home equity loan, 2,690 both second mortgage and home equity loan )Houses without a mortgage: 1,157
Median household income for houses/condos with a mortgage: $110,204
Median household income for apartments without a mortgage: $65,985
Median monthly housing costs: $1,283
Data:
Median house or condo value ($)
Median house or condo value ($ change since 2000)
Median house or condo value ($) - White
Median house or condo value ($) - Black or African American
Median house or condo value ($) - Asian
Median house or condo value ($) - Hispanic or Latino
Median house or condo value ($) - American Indian and Alaska Native
Median house or condo value ($) - Multirace
Median house or condo value ($) - Other Race
Median price asked for mobile homes ($)
Household density (households per square mile)
Mean house or condo value by units in structure - 1, detached ($)
Mean house or condo value by units in structure - 1, attached ($)
Mean house or condo value by units in structure - 2 ($)
Mean house or condo value by units in structure by units in structure - 3 or 4 ($)
Mean house or condo value by units in structure - 5 or more ($)
Mean house or condo value by units in structure - Boat, RV, van, etc. ($)
Mean house or condo value by units in structure - Mobile home ($)
Median contract rent ($)
Median contract rent - Lower quartile ($)
Median contract rent - Upper quartile ($)
Median gross rent ($)
Urban houses (%)
Rural houses (%)
Houses occupied (%)
Houses occupied (% change since 2000)
Houses owner occupied (%)
Houses owner occupied (% change since 2000)
Houses renter occupied (%)
Houses renter occupied (% change since 2000)
Vacant housing units - For rent (%)
Vacant housing units - For rent (% change since 2000)
Vacant housing units - For sale only (%)
Vacant housing units - For sale only (% change since 2000)
Vacant housing units - Rented or sold, not occupied (%)
Vacant housing units - Rented or sold, not occupied (% change since 2000)
Vacant housing units - For seasonal, recreational, or occasional use (%)
Vacant housing units - For seasonal, recreational, or occasional use (% change since 2000)
Vacant housing units - For migrant workers (%)
Vacant housing units - For migrant workers (% change since 2000)
Vacant housing units - Other vacant (%)
Vacant housing units - Other vacant (% change since 2000)
Median monthly housing costs ($)
Median household income for houses/condos with a mortgage ($)
Median household income for houses/condos without a mortgage ($)
Median household income ($)
Median household income ($) - White
Median household income ($) - Black or African American
Median household income ($) - Asian
Median household income ($) - Hispanic or Latino
Median household income ($) - American Indian and Alaska Native
Median household income ($) - Multirace
Median household income ($) - Other Race
Mortgage status - with mortgage (%)
Mortgage status - with second mortgage (%)
Mortgage status - with home equity loan (%)
Mortgage status - with both second mortgage and home equity loan (%)
Mortgage status - without a mortgage (%)
Median year house/condo built
Median year apartment built
Household type by relationship - Male householder living alone (%)
Household type by relationship - Male householder not living alone (%)
Household type by relationship - Female householder living alone (%)
Household type by relationship - Female householder not living alone (%)
Household type by relationship - Opposite-Sex spouse (%)
Household type by relationship - Same-Sex spouse (%)
Household type by relationship - Opposite-Sex unmarried partner (%)
Household type by relationship - Same-Sex unmarried partner (%)
Household type by relationship - In group quarters (%)
Size of family households - 2-person household (%)
Size of family households - 3-person household (%)
Size of family households - 4-person household (%)
Size of family households - 5-person household (%)
Size of family households - 6-person household (%)
Size of family households - 7-or-more-person household (%)
Size of nonfamily households - 1-person household (%)
Size of nonfamily households - 2-person household (%)
Size of nonfamily households - 3-person household (%)
Size of nonfamily households - 4-person household (%)
Size of nonfamily households - 5-person household (%)
Size of nonfamily households - 6-person household (%)
Size of nonfamily households - 7-or-moreperson household (%)
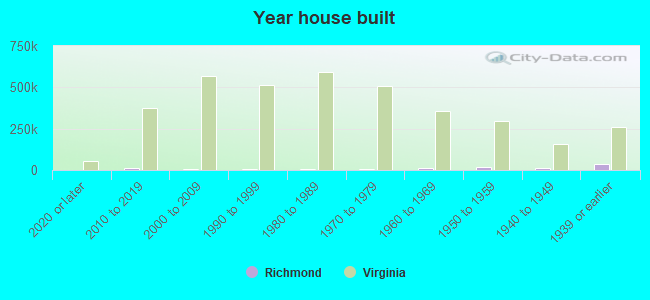
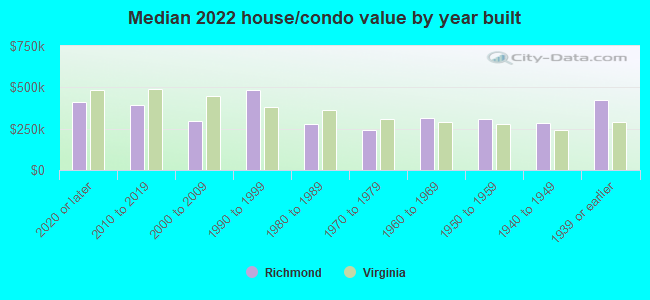
Year house built - Built 2010 or later (%)
Year house built - Built 2000 to 2009 (%)
Year house built - Built 1990 to 1999 (%)
Year house built - Built 1980 to 1989 (%)
Year house built - Built 1970 to 1979 (%)
Year house built - Built 1960 to 1969 (%)
Year house built - Built 1950 to 1959 (%)
Year house built - Built 1940 to 1949 (%)
Year house built - Built 1939 or earlier (%)
Median number of rooms in houses and condos
Median number of rooms in apartments
Median number of bedrooms in owner occupied houses
Mean number of bedrooms in owner occupied houses
Median number of bedrooms in renter occupied houses
Mean number of bedrooms in renter occupied houses
Median number of vehichles in owner occupied houses
Mean number of vehichles in owner occupied houses
Median number of vehichles in renter occupied houses
Mean number of vehichles in renter occupied houses
Rooms in owner-occupied houses - 1 room (%)
Rooms in owner-occupied houses - 2 rooms (%)
Rooms in owner-occupied houses - 3 rooms (%)
Rooms in owner-occupied houses - 4 rooms (%)
Rooms in owner-occupied houses - 5 rooms (%)
Rooms in owner-occupied houses - 6 rooms (%)
Rooms in owner-occupied houses - 7 rooms (%)
Rooms in owner-occupied houses - 8 rooms (%)
Rooms in owner-occupied houses - 9+ rooms (%)
Rooms in renter-occupied houses - 1 room (%)
Rooms in renter-occupied houses - 2 rooms (%)
Rooms in renter-occupied houses - 3 rooms (%)
Rooms in renter-occupied houses - 4 rooms (%)
Rooms in renter-occupied houses - 5 rooms (%)
Rooms in renter-occupied houses - 6 rooms (%)
Rooms in renter-occupied houses - 7 rooms (%)
Rooms in renter-occupied houses - 8 rooms (%)
Rooms in renter-occupied houses - 9+ rooms (%)
Bedrooms in owner-occupied houses - no bedrooms (%)
Bedrooms in owner-occupied houses - 1 bedroom (%)
Bedrooms in owner-occupied houses - 2 bedrooms (%)
Bedrooms in owner-occupied houses - 3 bedrooms (%)
Bedrooms in owner-occupied houses - 4 bedrooms (%)
Bedrooms in owner-occupied houses - 5+ bedrooms (%)
Bedrooms in renter-occupied houses - no bedrooms (%)
Bedrooms in renter-occupied houses - 1 bedroom (%)
Bedrooms in renter-occupied houses - 2 bedrooms (%)
Bedrooms in renter-occupied houses - 3 bedrooms (%)
Bedrooms in renter-occupied houses - 4 bedrooms (%)
Bedrooms in renter-occupied houses - 5+ bedrooms (%)
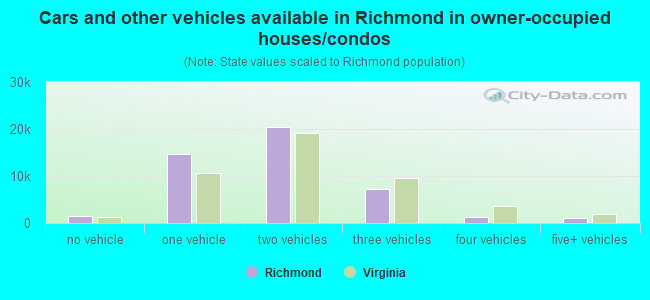
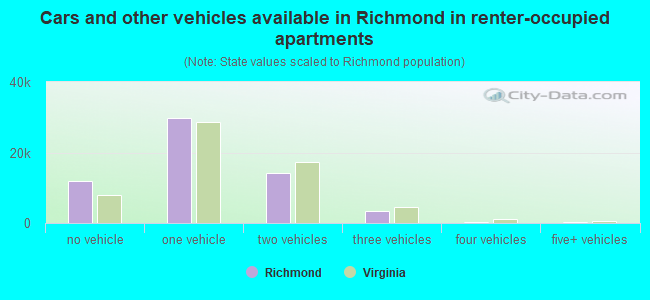
Vehicles available in owner-occupied houses - no vehicle available (%)
Vehicles available in owner-occupied houses - 1 vehicle available(%)
Vehicles available in owner-occupied houses - 2 Vehicles available (%)
Vehicles available in owner-occupied houses - 3 Vehicles available (%)
Vehicles available in owner-occupied houses - 4 Vehicles available (%)
Vehicles available in owner-occupied houses - 5+ Vehicles available (%)
Vehicles available in renter-occupied houses - no vehicle available (%)
Vehicles available in renter-occupied houses - 1 vehicle available (%)
Vehicles available in renter-occupied houses - 2 Vehicles available (%)
Vehicles available in renter-occupied houses - 3 Vehicles available (%)
Vehicles available in renter-occupied houses - 4 Vehicles available (%)
Vehicles available in renter-occupied houses - 5+ Vehicles available (%)
Housing units in structures - 1, detached (%)
Housing units in structures - 1, attached (%)
Housing units in structures - 2 (%)
Housing units in structures - 3 or 4 (%)
Housing units in structures - 5 to 9 (%)
Housing units in structures - 10 to 19 (%)
Housing units in structures - 20 to 49 (%)
Housing units in structures - 50 or more (%)
Housing units in structures - Mobile home (%)
Housing units in structures - Boat, RV, van, etc. (%)
Housing units in structures - Owners - 1, detached (%)
Housing units in structures - Owners - 1, attached (%)
Housing units in structures - Owners - 2 (%)
Housing units in structures - Owners - 3 or 4 (%)
Housing units in structures - Owners - 5 to 9 (%)
Housing units in structures - Owners - 10 to 19 (%)
Housing units in structures - Owners - 20 to 49 (%)
Housing units in structures - Owners - 50 or more (%)
Housing units in structures - Owners - Mobile home (%)
Housing units in structures - Owners - Boat, RV, van, etc. (%)
Housing units in structures - Renters - 1, detached (%)
Housing units in structures - Renters - 1, attached (%)
Housing units in structures - Renters - 2 (%)
Housing units in structures - Renters - 3 or 4 (%)
Housing units in structures - Renters - 5 to 9 (%)
Housing units in structures - Renters - 10 to 19 (%)
Housing units in structures - Renters - 20 to 49 (%)
Housing units in structures - Renters - 50 or more (%)
Housing units in structures - Renters - Mobile home (%)
Housing units in structures - Renters - Boat, RV, van, etc. (%)
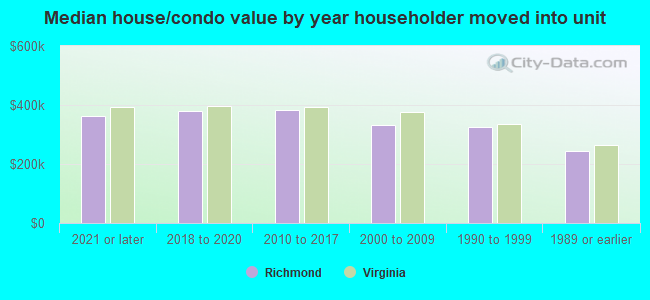
House/condo owner moved in on average (years ago)
Renter moved in on average (years ago)
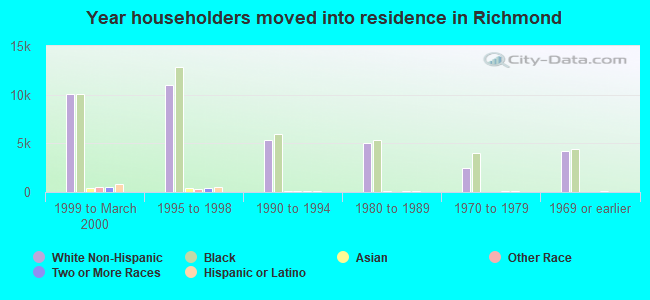
Year householder moved into unit - Moved in 1999 to March 2000 (%)
Year householder moved into unit - Moved in 1999 to March 2000 (%) - White
Year householder moved into unit - Moved in 1999 to March 2000 (%) - Black or African American
Year householder moved into unit - Moved in 1999 to March 2000 (%) - Asian
Year householder moved into unit - Moved in 1999 to March 2000 (%) - Hispanic or Latino
Year householder moved into unit - Moved in 1999 to March 2000 (%) - American Indian and Alaska Native
Year householder moved into unit - Moved in 1999 to March 2000 (%) - Multirace
Year householder moved into unit - Moved in 1999 to March 2000 (%) - Other Race
Year householder moved into unit - Moved in 1995 to 1998 (%)
Year householder moved into unit - Moved in 1995 to 1998 (%) - White
Year householder moved into unit - Moved in 1995 to 1998 (%) - Black or African American
Year householder moved into unit - Moved in 1995 to 1998 (%) - Asian
Year householder moved into unit - Moved in 1995 to 1998 (%) - Hispanic or Latino
Year householder moved into unit - Moved in 1995 to 1998 (%) - American Indian and Alaska Native
Year householder moved into unit - Moved in 1995 to 1998 (%) - Multirace
Year householder moved into unit - Moved in 1995 to 1998 (%) - Other Race
Year householder moved into unit - Moved in 1990 to 1994 (%)
Year householder moved into unit - Moved in 1990 to 1994 (%) - White
Year householder moved into unit - Moved in 1990 to 1994 (%) - Black or African American
Year householder moved into unit - Moved in 1990 to 1994 (%) - Asian
Year householder moved into unit - Moved in 1990 to 1994 (%) - Hispanic or Latino
Year householder moved into unit - Moved in 1990 to 1994 (%) - American Indian and Alaska Native
Year householder moved into unit - Moved in 1990 to 1994 (%) - Multirace
Year householder moved into unit - Moved in 1990 to 1994 (%) - Other Race
Year householder moved into unit - Moved in 1980 to 1989 (%)
Year householder moved into unit - Moved in 1980 to 1989 (%) - White
Year householder moved into unit - Moved in 1980 to 1989 (%) - Black or African American
Year householder moved into unit - Moved in 1980 to 1989 (%) - Asian
Year householder moved into unit - Moved in 1980 to 1989 (%) - Hispanic or Latino
Year householder moved into unit - Moved in 1980 to 1989 (%) - American Indian and Alaska Native
Year householder moved into unit - Moved in 1980 to 1989 (%) - Multirace
Year householder moved into unit - Moved in 1980 to 1989 (%) - Other Race
Year householder moved into unit - Moved in 1970 to 1979 (%)
Year householder moved into unit - Moved in 1970 to 1979 (%) - White
Year householder moved into unit - Moved in 1970 to 1979 (%) - Black or African American
Year householder moved into unit - Moved in 1970 to 1979 (%) - Asian
Year householder moved into unit - Moved in 1970 to 1979 (%) - Hispanic or Latino
Year householder moved into unit - Moved in 1970 to 1979 (%) - American Indian and Alaska Native
Year householder moved into unit - Moved in 1970 to 1979 (%) - Multirace
Year householder moved into unit - Moved in 1970 to 1979 (%) - Other Race
Year householder moved into unit - Moved in 1969 or earlier (%)
Year householder moved into unit - Moved in 1969 or earlier (%) - White
Year householder moved into unit - Moved in 1969 or earlier (%) - Black or African American
Year householder moved into unit - Moved in 1969 or earlier (%) - Asian
Year householder moved into unit - Moved in 1969 or earlier (%) - Hispanic or Latino
Year householder moved into unit - Moved in 1969 or earlier (%) - American Indian and Alaska Native
Year householder moved into unit - Moved in 1969 or earlier (%) - Multirace
Year householder moved into unit - Moved in 1969 or earlier (%) - Other Race
Housing units lacking complete plumbing facilities (%)
Housing units lacking complete kitchen facilities (%)
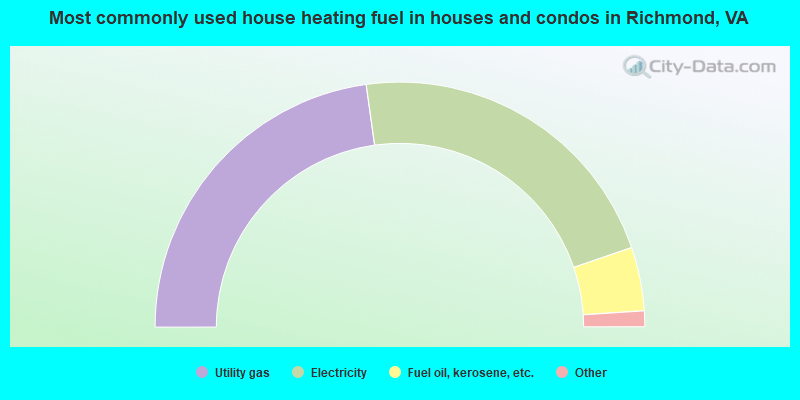
House heating fuel used in houses and condos - Utility gas (%)
House heating fuel used in houses and condos - Bottled, tank, or LP gas (%)
House heating fuel used in houses and condos - Electricity (%)
House heating fuel used in houses and condos - Fuel oil, kerosene, etc. (%)
House heating fuel used in houses and condos - Coal or coke (%)
House heating fuel used in houses and condos - Wood (%)
House heating fuel used in houses and condos - Solar energy (%)
House heating fuel used in houses and condos - Other fuel (%)
House heating fuel used in houses and condos - No fuel used (%)
House heating fuel used in apartments - Utility gas (%)
House heating fuel used in apartments - Bottled, tank, or LP gas (%)
House heating fuel used in apartments - Electricity (%)
House heating fuel used in apartments - Fuel oil, kerosene, etc. (%)
House heating fuel used in apartments - Coal or coke (%)
House heating fuel used in apartments - Wood (%)
House heating fuel used in apartments - Solar energy (%)
House heating fuel used in apartments - Other fuel (%)
House heating fuel used in apartments - No fuel used (%)
Latest news about housing in Richmond, VA collected exclusively by city-data.com from local newspapers, TV, and radio stations
Median year house/condo built: 1951Median year apartment built: 1964Household type by relationship:
Households: 229,395
Male householders: 45,213 (17,742 living alone ), Female householders: 61,039 (27,855 living alone )27,015 spouses (26,698 opposite-sex spouses ), 10,959 unmarried partners , (9,516 opposite-sex unmarried partners ), 48,406 children (46,043 natural , 589 adopted , 1,774 stepchildren ), 1,924 grandchildren , 3,230 brothers or sisters , 2,339 parents , 0 foster children , 4,357 other relatives , 13,980 non-relatives In group quarters: 10,933
Size of family households: 24,121 2-persons , 8,498 3-persons , 7,252 4-persons , 2,506 5-persons , 1,265 6-persons , 799 7-or-more-persons .
Size of nonfamily households: 45,597 1-person , 13,687 2-persons , 1,598 3-persons , 854 4-persons , 75 5-persons .
16,588 married couples with children. single-parent households (2,922 men , 13,805 women ).
89.3% of residents of Richmond speak English at home. of residents speak Spanish at home (43% speak English very well , 12% speak English well , 24% speak English not well , 21% don't speak English at all ).of residents speak other Indo-European language at home (72% speak English very well , 18% speak English well , 10% speak English not well ).of residents speak Asian or Pacific Island language at home (66% speak English very well , 22% speak English well , 10% speak English not well , 2% don't speak English at all ).of residents speak other language at home (72% speak English very well , 23% speak English well , 4% speak English not well , 1% don't speak English at all ).
Foreign born population: 16,296 (7.1%)of them are naturalized citizens )
Median number of rooms in houses and condos:
Median number of rooms in apartments
Owner-occupied Renter-occupied
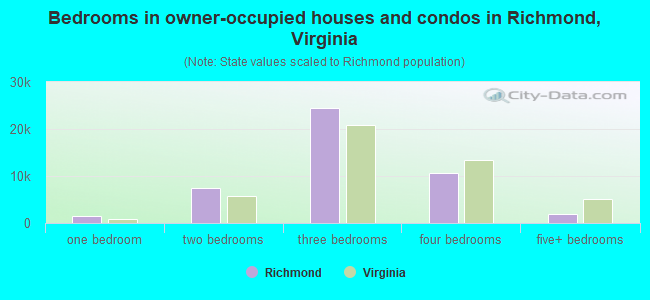
Bedrooms in owner-occupied houses and condos in Richmond, Virginia
182 no bedroom 1,442 1 bedroom 7,529 2 bedrooms 24,380 3 bedrooms 10,615 4 bedrooms 1,871 5+ bedrooms
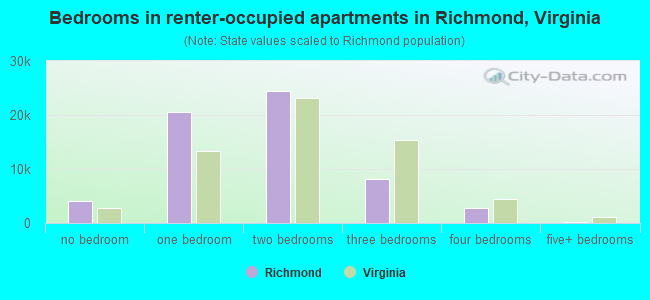
Bedrooms in renter-occupied apartments in Richmond, Virginia
3,988 no bedroom 20,628 1 bedroom 24,466 2 bedrooms 8,169 3 bedrooms 2,746 4 bedrooms 236 5+ bedrooms
Owner-occupied Renter-occupied
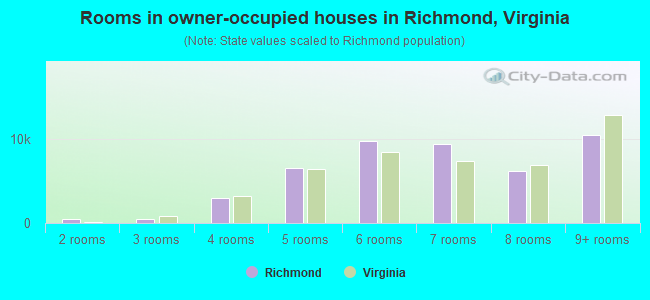
Rooms in owner-occupied houses in Richmond, Virginia
0 1 room 497 2 rooms 484 3 rooms 2,905 4 rooms 6,504 5 rooms 9,671 6 rooms 9,368 7 rooms 6,153 8 rooms 10,437 9+ rooms
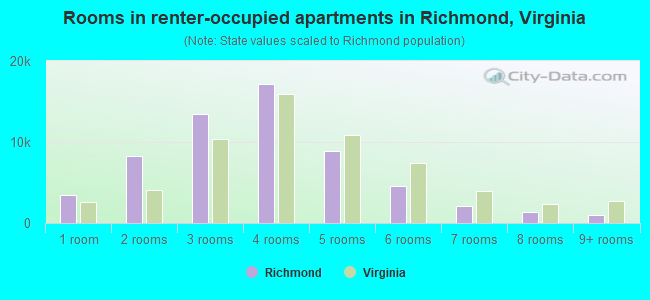
Rooms in renter-occupied apartments in Richmond, Virginia
3,517 1 room 8,213 2 rooms 13,438 3 rooms 17,189 4 rooms 8,899 5 rooms 4,527 6 rooms 2,104 7 rooms 1,342 8 rooms 1,004 9+ rooms
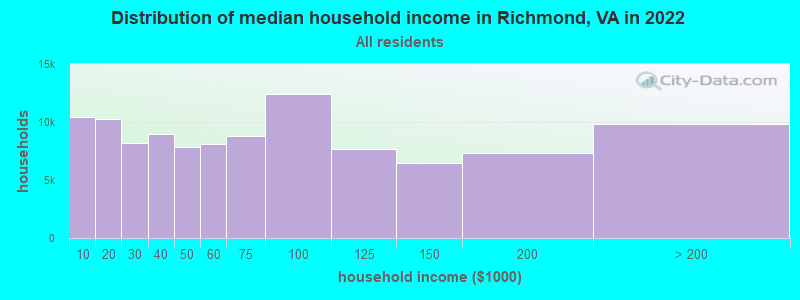
Richmond, VA household income distribution 10,440 Less than $10,00010,285 $10,000 to $19,9998,181 $20,000 to $29,9998,940 $30,000 to $39,9997,810 $40,000 to $49,9998,127 $50,000 to $59,9998,756 $60,000 to $74,99912,414 $75,000 to $99,9997,655 $100,000 to $124,9996,473 $125,000 to $149,9997,303 $150,000 to $199,9999,868 $200,000 or more
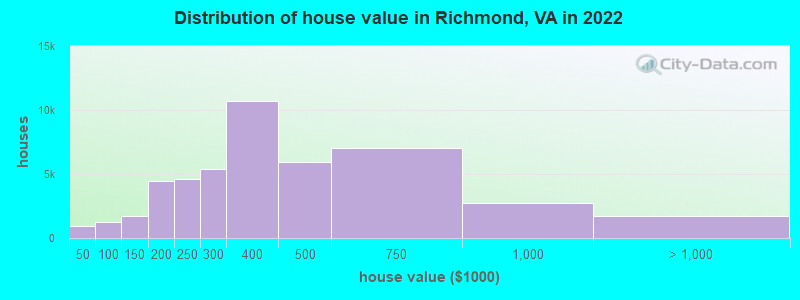
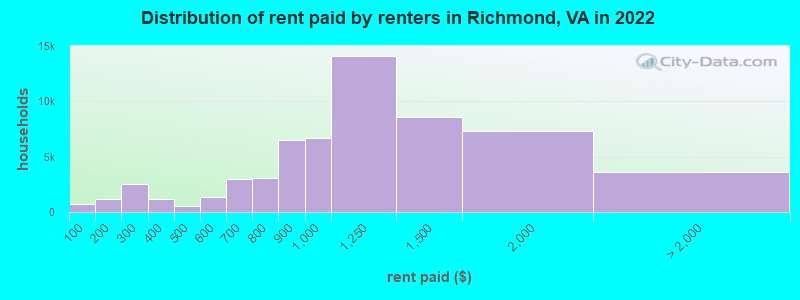
Home value of owner - occupied houses in 2022 in Richmond, VA 158 Less than $10,00087 $10,000 to $14,999210 $15,000 to $19,99984 $25,000 to $29,999100 $30,000 to $34,999322 $40,000 to $49,99944 $50,000 to $59,99984 $60,000 to $69,999308 $70,000 to $79,999233 $80,000 to $89,999227 $90,000 to $99,999995 $100,000 to $124,999746 $125,000 to $149,9992,570 $150,000 to $174,9991,852 $175,000 to $199,9994,631 $200,000 to $249,9995,361 $250,000 to $299,99910,675 $300,000 to $399,9995,900 $400,000 to $499,9997,022 $500,000 to $749,9992,719 $750,000 to $999,9991,090 $1,000,000 to $1,499,999333 $1,500,000 to $1,999,999268 $2,000,000 or moreRent paid by renters in 2022 in Richmond, VA 721 Less than $100478 $100 to $149732 $150 to $1991,531 $200 to $249961 $250 to $299664 $300 to $349486 $350 to $399159 $400 to $449374 $450 to $499789 $500 to $549522 $550 to $5991,844 $600 to $6491,177 $650 to $6991,265 $700 to $7491,790 $750 to $7996,476 $800 to $8996,673 $900 to $99914,075 $1,000 to $1,2498,549 $1,250 to $1,4997,327 $1,500 to $1,9991,454 $2,000 to $2,499753 $2,500 to $2,99962 $3,000 to $3,49991 $3,500 or more1,280 No cash rent
Percentage of workers working in this county: 65.9%Number of people working at home: 25,388 (20.7% of all workers )
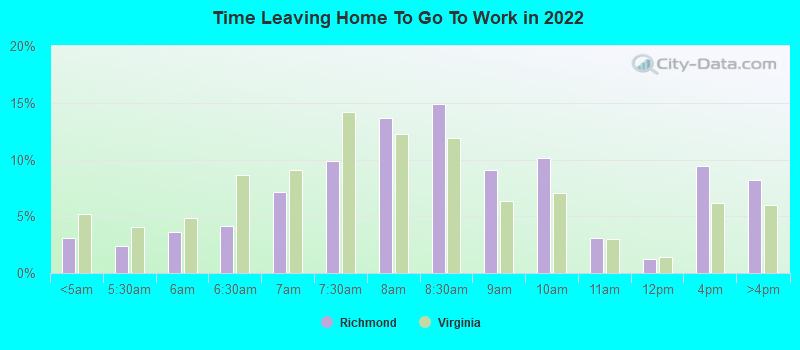
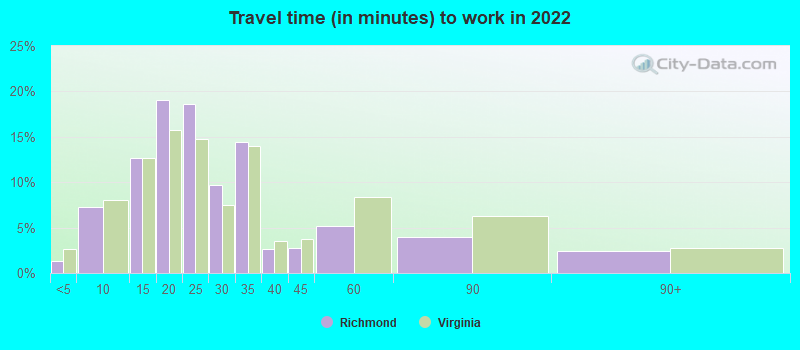
Travel time to work (commute)
Less than 5 minutes: 1,2615 to 9 minutes: 11,76310 to 14 minutes: 20,00215 to 19 minutes: 20,88620 to 24 minutes: 17,64925 to 29 minutes: 5,43530 to 34 minutes: 9,77835 to 39 minutes: 1,59640 to 44 minutes: 2,20145 to 59 minutes: 2,92960 to 89 minutes: 2,16590 or more minutes: 1,537
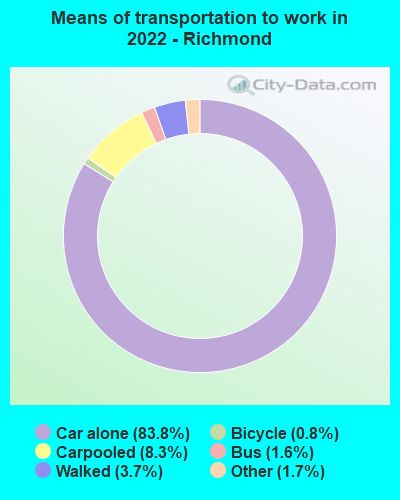
Means of transportation to work:
Drove a car alone: 137,095 (72.5%)Carpooled: 13,645 (7.2%)Bus : 2,595 (1.4%)Long-distance train or commuter rail : 37 (0.0%)Taxi: 2,856 (1.5%)Bicycle: 1,340 (0.7%)Walked: 6,041 (3.2%)Worked at home: 25,388 (13.4%)
Unemployment by race in 2022
Unemployment rate for White non-Hispanic residents 3.8% Males1.5% FemalesUnemployment rate for Black residents 15.6% Males11.0% FemalesUnemployment rate for American Indian and Alaska Native residents 12.5% Males18.0% FemalesUnemployment rate for Asian residents 0.4% Males7.6% FemalesUnemployment rate for other race residents 1.2% Males8.4% FemalesUnemployment rate for two or more race residents 2.6% Males5.3% FemalesUnemployment rate for Hispanic or Latino residents 1.5% Males6.1% Females
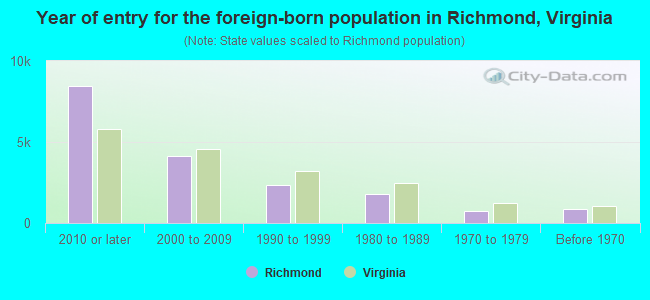
Year of entry for the foreign-born population in Richmond, Virginia
8,432 2010 or later 4,107 2000 to 2009 2,353 1990 to 1999 1,775 1980 to 1989 764 1970 to 1979 866 Before 1970
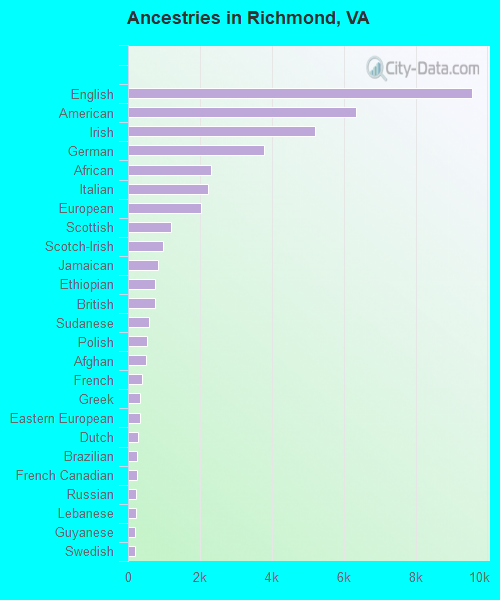
First ancestries reported:
English: 9,565 (7.7%)
American: 6,349 (5.1%)
Irish: 5,191 (4.2%)
German: 3,782 (3.0%)
African: 2,305 (1.8%)
Italian: 2,222 (1.8%)
European: 2,026 (1.6%)
Scottish: 1,193 (1.0%)
Scotch-Irish: 986 (0.8%)
Jamaican: 828 (0.7%)
Ethiopian: 761 (0.6%)
British: 758 (0.6%)
Sudanese: 591 (0.5%)
Polish: 542 (0.4%)
Afghan: 497 (0.4%)
French: 393 (0.3%)
Greek: 344 (0.3%)
Eastern European: 343 (0.3%)
Dutch: 277 (0.2%)
Brazilian: 253 (0.2%)
French Canadian: 238 (0.2%)
Russian: 236 (0.2%)
Lebanese: 216 (0.2%)
Guyanese: 207 (0.2%)
Swedish: 185 (0.1%)
Egyptian: 182 (0.1%)
Norwegian: 178 (0.1%)
Nigerian: 165 (0.1%)
Iranian: 160 (0.1%)
Barbadian: 156 (0.1%)
Welsh: 148 (0.1%)
Sierra Leonean: 136 (0.1%)
Bahamian: 134 (0.1%)
Senegalese: 129 (0.1%)
Haitian: 125 (0.1%)
West Indian: 124 (0.10%)
Turkish: 114 (0.09%)
Lithuanian: 105 (0.08%)
Danish: 101 (0.08%)
Swiss: 99 (0.08%)
Northern European: 96 (0.08%)
Canadian: 89 (0.07%)
Armenian: 85 (0.07%)
Czech: 84 (0.07%)
Scandinavian: 74 (0.06%)
Arab: 72 (0.06%)
Israeli: 62 (0.05%)
Palestinian: 58 (0.05%)
Ukrainian: 57 (0.05%)
Austrian: 55 (0.04%)
South African: 51 (0.04%)
Trinidadian and Tobagonian: 50 (0.04%)
Romanian: 48 (0.04%)
Hungarian: 48 (0.04%)
Ghanaian: 44 (0.04%)
Slovak: 43 (0.03%)
British West Indian: 42 (0.03%)
Iraqi: 41 (0.03%)
Serbian: 40 (0.03%)
Yugoslavian: 40 (0.03%)
Somali: 35 (0.03%)
Slovene: 34 (0.03%)
Cajun: 34 (0.03%)
Ugandan: 31 (0.02%)
New Zealander: 29 (0.02%)
Croatian: 28 (0.02%)
Portuguese: 26 (0.02%)
Estonian: 22 (0.02%)
Jordanian: 20 (0.02%)
Belgian: 20 (0.02%)
Zimbabwean: 19 (0.02%)
Bulgarian: 16 (0.01%)
Albanian: 14 (0.01%)
Celtic: 13 (0.01%)
Belizean: 13 (0.01%)
Syrian: 9 (0.01%)
Finnish: 8 (0.01%)
Icelander: 8 (0.01%)
Most common places of birth for foreign-born residents (%): Guatemala Richmond:
15.1% (2,588)Virginia:
3.3% (35,938)
El Salvador Richmond:
10.4% (1,784)Virginia:
9.9% (107,534)
Mexico Richmond:
6.9% (1,173)Virginia:
5.3% (57,498)
Honduras Richmond:
6.7% (1,142)Virginia:
3.0% (32,892)
India Richmond:
3.8% (655)Virginia:
9.0% (97,830)
China, excluding Hong Kong and Taiwan Richmond:
2.8% (478)Virginia:
3.9% (42,989)
Ethiopia Richmond:
2.6% (447)Virginia:
2.9% (32,082)
Afghanistan Richmond:
2.6% (438)Virginia:
1.8% (19,426)
Cameroon Richmond:
2.2% (374)Virginia:
0.2% (2,575)
Jamaica Richmond:
1.9% (321)Virginia:
1.0% (10,734)
Korea Richmond:
1.7% (299)Virginia:
4.9% (52,857)
Cuba Richmond:
1.7% (290)Virginia:
0.5% (5,899)
Place of birth for U.S.-born residents:
This state: 137,207Other state: 71,911Northeast: 25,028Midwest: 9,762South: 30,199West: 6,922 82.3% of Richmond residents lived in the same house 1 years ago.
Out of people who lived in different houses, 31.5% lived in this county.
Out of people who lived in different counties, 69.0% lived in Virginia.
Richmond:
82.3%State average:
86.6%
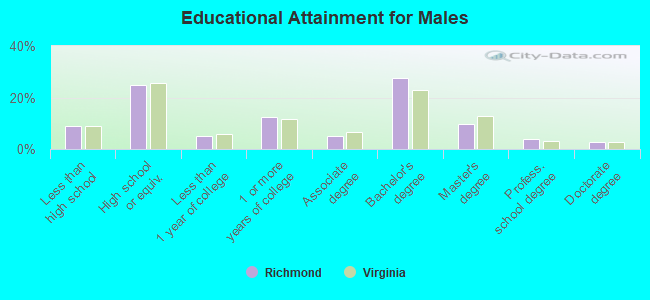
Education attainment for males 25 years and older:
No schooling: 800Nursery to 4th grade: 3205th and 6th grade: 8907th and 8th grade: 9469th grade: 17610th grade: 1,11011th grade: 1,70612th grade, no diploma: 740High school graduate (or equivalency): 19,020Less than 1 year of college: 3,740Some college more than 1 year, no degree: 9,449Associate degree: 3,971Bachelor's degree: 20,951Master's degree: 7,346Professional school degree: 3,040Doctorate degree: 2,044
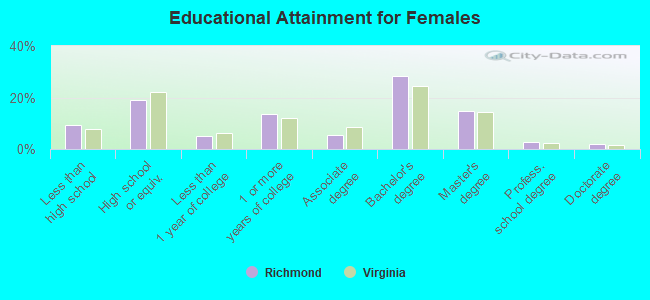
Education attainment for females 25 years and older:
No schooling: 1,165Nursery to 4th grade: 1815th and 6th grade: 6327th and 8th grade: 9299th grade: 33010th grade: 2,11211th grade: 1,39412th grade, no diploma: 851High school graduate (or equivalency): 15,818Less than 1 year of college: 4,296Some college more than 1 year, no degree: 11,238Associate degree: 4,500Bachelor's degree: 23,506Master's degree: 12,207Professional school degree: 2,311Doctorate degree: 1,612
Housing units in structures:
One, detached: 52,122One, attached: 9,837Two: 4,6993 or 4: 5,8495 to 9: 8,62510 to 19: 5,71020 to 49: 8,11550 or more: 17,233Mobile homes: 1,107Boats, RVs, vans, etc.: 176Housing units lacking complete plumbing facilities in 2022: 0.7%Housing units lacking complete kitchen facilities in 2022: 0.9%House/condo owner moved in on average 11 years ago
Renter moved in on average 2 years ago
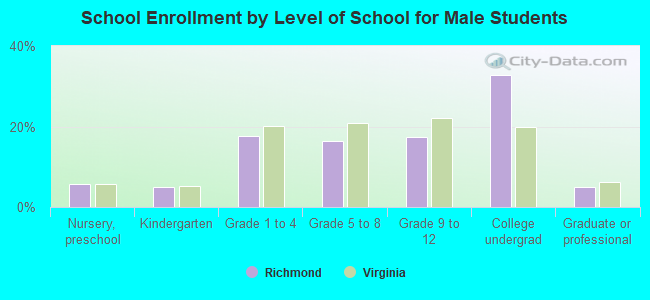
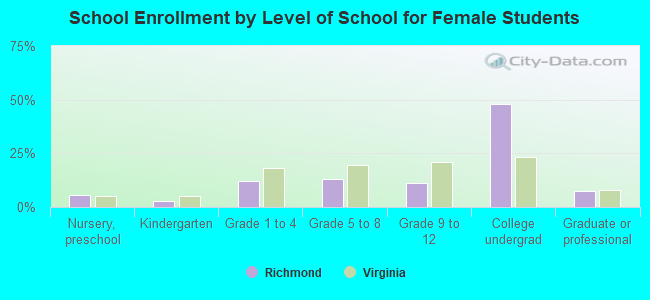
Private vs. public school enrollment:
Students in private schools in grades 1 to 8 (elementary and middle school): 1,634 Students in private schools in grades 9 to 12 (high school): 998 Students in private undergraduate colleges: 3,698