Housing density: 2,641 houses/condos per square mile
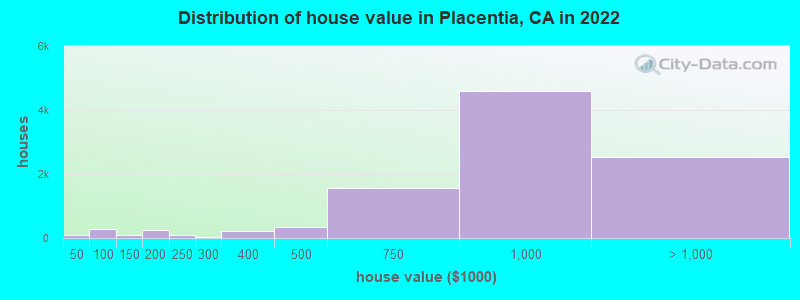
Median price asked for vacant for-sale houses and condos in 2022: $790,716.
Median contract rent in 2022: $1,952 (lower quartile is $1,586, upper quartile is over $2,000)
Median rent asked for vacant for-rent units in 2022: $2,936
Median gross rent in Placentia, CA in 2022: over $2,000
Housing units in Placentia with a mortgage: 7,260 (890 second mortgage, 43 home equity loan, 767 both second mortgage and home equity loan) Houses without a mortgage: 64
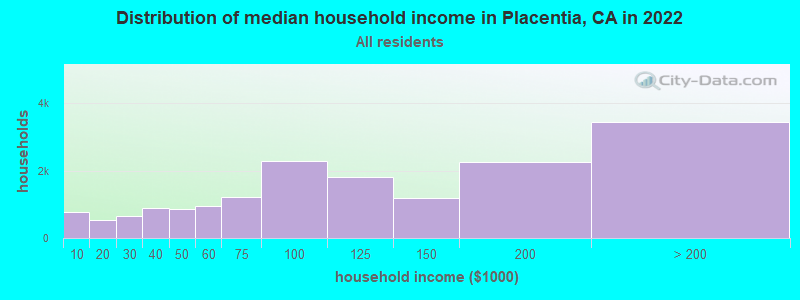
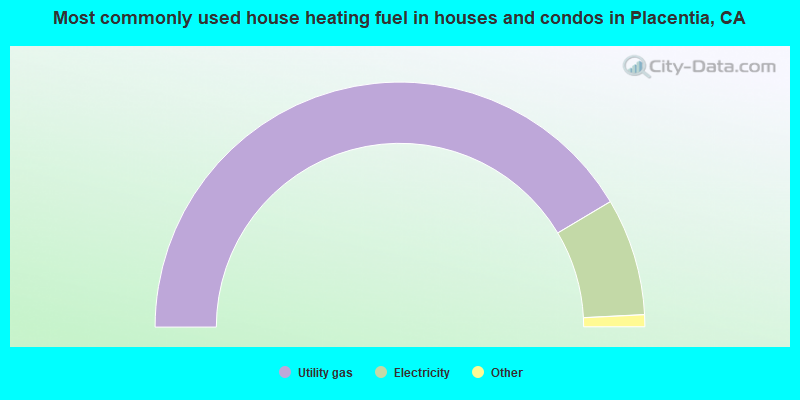
Median household income for houses/condos with a mortgage: $155,307
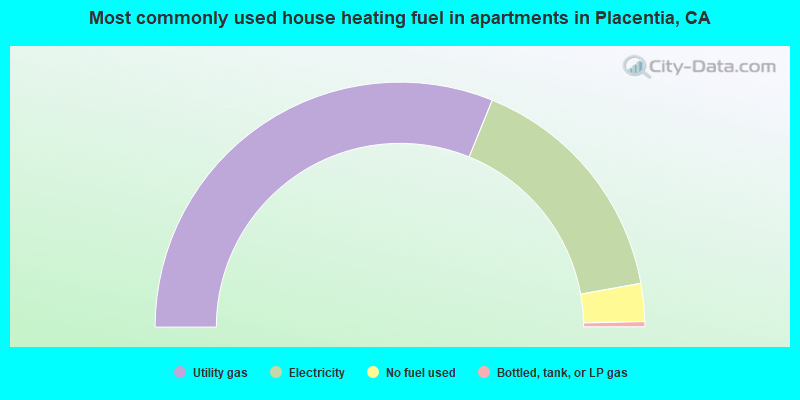
Median household income for apartments without a mortgage: $89,518
8,146 married couples with children.
2,207 single-parent households (585 men, 1,622 women).
59.0% of residents of Placentia speak English at home.
22.9% of residents speak Spanish at home (70% speak English very well, 11% speak English well, 12% speak English not well, 7% don't speak English at all).
5.6% of residents speak other Indo-European language at home (78% speak English very well, 15% speak English well, 7% speak English not well).
10.0% of residents speak Asian or Pacific Island language at home (57% speak English very well, 28% speak English well, 13% speak English not well, 2% don't speak English at all).
1.9% of residents speak other language at home (80% speak English very well, 10% speak English well, 10% speak English not well).
Foreign born population: 13,028 (25.3%)
(57.6% of them are naturalized citizens)
Percentage of workers working in this county: 82.3% Number of people working at home: 3,828 (15.0% of all workers)
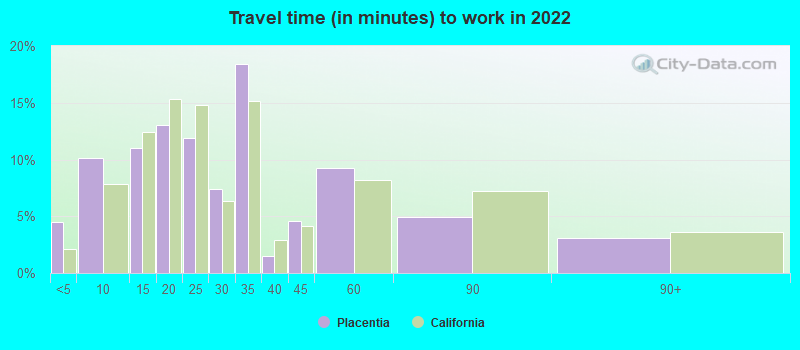
Travel time to work (commute)
Less than 5 minutes: 766
5 to 9 minutes: 2,056
10 to 14 minutes: 2,648
15 to 19 minutes: 2,530
20 to 24 minutes: 2,400
25 to 29 minutes: 1,124
30 to 34 minutes: 3,488
35 to 39 minutes: 502
40 to 44 minutes: 1,212
45 to 59 minutes: 2,292
60 to 89 minutes: 1,426
90 or more minutes: 853
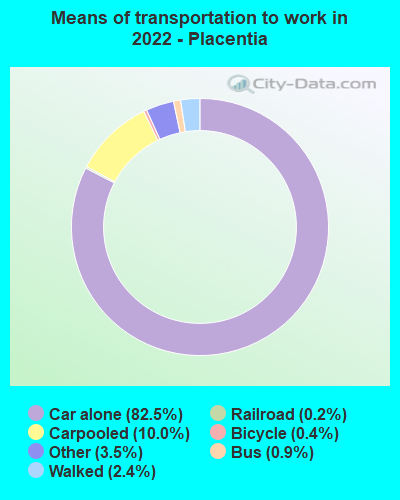
Means of transportation to work:
Drove a car alone: 10,264 (63.5%)
Carpooled: 1,350 (8.4%)
Bus: 105 (0.6%)
Light rail, streetcar or trolley: 15 (0.1%)
Taxi: 500 (3.1%)
Bicycle: 56 (0.3%)
Walked: 301 (1.9%)
Worked at home: 3,828 (23.7%)
Unemployment by race in 2022
Unemployment rate for White non-Hispanic residents
2.5%Males
3.7%Females
Unemployment rate for Black residents
10.3%Males
Unemployment rate for American Indian and Alaska Native residents
11.2%Females
Unemployment rate for Asian residents
3.7%Males
3.1%Females
Unemployment rate for other race residents
1.7%Males
0.9%Females
Unemployment rate for two or more race residents
4.3%Males
9.6%Females
Unemployment rate for Hispanic or Latino residents
4.5%Males
6.3%Females
Year of entry for the foreign-born population in Placentia, California
1,8052010 or later
2,7932000 to 2009
2,5561990 to 1999
3,9751980 to 1989
2,0331970 to 1979
1,313Before 1970
First ancestries reported:
American: 1,568 (5.3%)
German: 1,224 (4.1%)
Irish: 845 (2.9%)
Italian: 760 (2.6%)
English: 697 (2.4%)
European: 611 (2.1%)
Lebanese: 318 (1.1%)
Polish: 233 (0.8%)
Romanian: 225 (0.8%)
Austrian: 222 (0.8%)
Iranian: 180 (0.6%)
French: 148 (0.5%)
Dutch: 141 (0.5%)
Swedish: 136 (0.5%)
Macedonian: 134 (0.5%)
Ethiopian: 119 (0.4%)
Kenyan: 100 (0.3%)
Syrian: 99 (0.3%)
Egyptian: 90 (0.3%)
French Canadian: 84 (0.3%)
Scottish: 69 (0.2%)
Portuguese: 66 (0.2%)
Croatian: 62 (0.2%)
Northern European: 57 (0.2%)
Norwegian: 57 (0.2%)
Russian: 55 (0.2%)
Canadian: 55 (0.2%)
Assyrian: 54 (0.2%)
Armenian: 50 (0.2%)
Scandinavian: 50 (0.2%)
Nigerian: 49 (0.2%)
British: 42 (0.1%)
Scotch-Irish: 41 (0.1%)
Basque: 33 (0.1%)
Ukrainian: 25 (0.08%)
Danish: 22 (0.07%)
Greek: 21 (0.07%)
Hungarian: 20 (0.07%)
Eastern European: 20 (0.07%)
Slovak: 15 (0.05%)
Czech: 13 (0.04%)
Jordanian: 11 (0.04%)
Yugoslavian: 11 (0.04%)
Lithuanian: 10 (0.03%)
Belgian: 9 (0.03%)
Serbian: 7 (0.02%)
Brazilian: 6 (0.02%)
Slovene: 2 (0.01%)
Most common places of birth for foreign-born residents (%):
Mexico
Placentia:
37.2% (4,843)
California:
37.2% (3,881,193)
Korea
Placentia:
7.6% (985)
California:
3.0% (315,248)
India
Placentia:
6.9% (903)
California:
5.2% (539,184)
Philippines
Placentia:
5.5% (717)
California:
7.8% (818,297)
Vietnam
Placentia:
4.2% (552)
California:
4.9% (512,335)
China, excluding Hong Kong and Taiwan
Placentia:
3.5% (459)
California:
6.6% (684,672)
Japan
Placentia:
3.1% (408)
California:
1.0% (103,575)
Taiwan
Placentia:
2.9% (375)
California:
1.7% (176,274)
Syria
Placentia:
2.1% (271)
California:
0.3% (30,949)
Fiji
Placentia:
2.0% (264)
California:
0.3% (33,937)
Canada
Placentia:
1.8% (241)
California:
1.2% (127,477)
Romania
Placentia:
1.6% (213)
California:
0.2% (23,058)
Iran
Placentia:
1.6% (202)
California:
2.0% (206,004)
Place of birth for U.S.-born residents:
This state: 31,647
Other state: 6,129
Northeast: 1,209
Midwest: 2,342
South: 1,393
West: 1,180
90.5% of Placentia residents lived in the same house 1 years ago. Out of people who lived in different houses, 42.8% lived in this county. Out of people who lived in different counties, 76.9% lived in California.
Placentia:
90.5%
State average:
88.9%
Education attainment for males 25 years and older:
No schooling: 393
Nursery to 4th grade: 137
5th and 6th grade: 275
7th and 8th grade: 141
9th grade: 160
10th grade: 125
11th grade: 163
12th grade, no diploma: 365
High school graduate (or equivalency): 3,681
Less than 1 year of college: 662
Some college more than 1 year, no degree: 2,371
Associate degree: 1,319
Bachelor's degree: 4,611
Master's degree: 1,691
Professional school degree: 409
Doctorate degree: 511
Education attainment for females 25 years and older:
No schooling: 523
Nursery to 4th grade: 140
5th and 6th grade: 339
7th and 8th grade: 144
9th grade: 274
10th grade: 137
11th grade: 105
12th grade, no diploma: 261
High school graduate (or equivalency): 3,276
Less than 1 year of college: 1,058
Some college more than 1 year, no degree: 2,569
Associate degree: 1,402
Bachelor's degree: 4,770
Master's degree: 2,379
Professional school degree: 408
Doctorate degree: 275
Housing units in structures:
One, detached: 10,398
One, attached: 1,880
Two: 219
3 or 4: 1,076
5 to 9: 1,021
10 to 19: 457
20 to 49: 546
50 or more: 1,168
Mobile homes: 644
Median worth of mobile homes: $208,176
Housing units lacking complete plumbing facilities in 2022: 0.2%
Housing units lacking complete kitchen facilities in 2022: 1.9%
House/condo owner moved in on average 14 years ago