Perth Amboy, NJ (New Jersey) Houses and Residents
Estimated median house or condo value in 2022: $350,056 (it was $132,100 in 2000 )
Perth Amboy:
$350,056New Jersey:
$428,900
Lower value quartile - upper value quartile: $264,246 - $449,146Mean price in 2022: Detached houses: $348,275 Here:
$348,275State:
$537,591
Townhouses or other attached units: $319,185 Here:
$319,185State:
$381,113
In 2-unit structures: $271,230 Here:
$271,230State:
$444,476
In 3-to-4-unit structures: $497,588 Here:
$497,588State:
$457,463
In 5-or-more-unit structures: $282,369 Here:
$282,369State:
$368,745
Total population: 52,328 (Urban population: 47,303, Rural population: 0)
Houses: 19,309 (18,556 occupied: 6,613 owner occupied, 12,099 renter occupied )
% of renters here:
65%State:
35%
Housing density: 4,038 houses/condos per square mile
Median price asked for vacant for-sale houses and condos in 2022: $515,042.
Median contract rent in 2022: $1,333 (lower quartile is $1,022, upper quartile is $1,615)
Median rent asked for vacant for-rent units in 2022: $1,564
Median gross rent in Perth Amboy, NJ in 2022: $1,499
Housing units in Perth Amboy with a mortgage: 4,278 (261 second mortgage, 44 home equity loan, 224 both second mortgage and home equity loan )Houses without a mortgage: 129
Median household income for houses/condos with a mortgage: $104,031
Median household income for apartments without a mortgage: $64,701
Median monthly housing costs: $1,555
Data:
Median house or condo value ($)
Median house or condo value ($ change since 2000)
Median house or condo value ($) - White
Median house or condo value ($) - Black or African American
Median house or condo value ($) - Asian
Median house or condo value ($) - Hispanic or Latino
Median house or condo value ($) - American Indian and Alaska Native
Median house or condo value ($) - Multirace
Median house or condo value ($) - Other Race
Median price asked for mobile homes ($)
Household density (households per square mile)
Mean house or condo value by units in structure - 1, detached ($)
Mean house or condo value by units in structure - 1, attached ($)
Mean house or condo value by units in structure - 2 ($)
Mean house or condo value by units in structure by units in structure - 3 or 4 ($)
Mean house or condo value by units in structure - 5 or more ($)
Mean house or condo value by units in structure - Boat, RV, van, etc. ($)
Mean house or condo value by units in structure - Mobile home ($)
Median contract rent ($)
Median contract rent - Lower quartile ($)
Median contract rent - Upper quartile ($)
Median gross rent ($)
Urban houses (%)
Rural houses (%)
Houses occupied (%)
Houses occupied (% change since 2000)
Houses owner occupied (%)
Houses owner occupied (% change since 2000)
Houses renter occupied (%)
Houses renter occupied (% change since 2000)
Vacant housing units - For rent (%)
Vacant housing units - For rent (% change since 2000)
Vacant housing units - For sale only (%)
Vacant housing units - For sale only (% change since 2000)
Vacant housing units - Rented or sold, not occupied (%)
Vacant housing units - Rented or sold, not occupied (% change since 2000)
Vacant housing units - For seasonal, recreational, or occasional use (%)
Vacant housing units - For seasonal, recreational, or occasional use (% change since 2000)
Vacant housing units - For migrant workers (%)
Vacant housing units - For migrant workers (% change since 2000)
Vacant housing units - Other vacant (%)
Vacant housing units - Other vacant (% change since 2000)
Median monthly housing costs ($)
Median household income for houses/condos with a mortgage ($)
Median household income for houses/condos without a mortgage ($)
Median household income ($)
Median household income ($) - White
Median household income ($) - Black or African American
Median household income ($) - Asian
Median household income ($) - Hispanic or Latino
Median household income ($) - American Indian and Alaska Native
Median household income ($) - Multirace
Median household income ($) - Other Race
Mortgage status - with mortgage (%)
Mortgage status - with second mortgage (%)
Mortgage status - with home equity loan (%)
Mortgage status - with both second mortgage and home equity loan (%)
Mortgage status - without a mortgage (%)
Median year house/condo built
Median year apartment built
Household type by relationship - Male householder living alone (%)
Household type by relationship - Male householder not living alone (%)
Household type by relationship - Female householder living alone (%)
Household type by relationship - Female householder not living alone (%)
Household type by relationship - Opposite-Sex spouse (%)
Household type by relationship - Same-Sex spouse (%)
Household type by relationship - Opposite-Sex unmarried partner (%)
Household type by relationship - Same-Sex unmarried partner (%)
Household type by relationship - In group quarters (%)
Size of family households - 2-person household (%)
Size of family households - 3-person household (%)
Size of family households - 4-person household (%)
Size of family households - 5-person household (%)
Size of family households - 6-person household (%)
Size of family households - 7-or-more-person household (%)
Size of nonfamily households - 1-person household (%)
Size of nonfamily households - 2-person household (%)
Size of nonfamily households - 3-person household (%)
Size of nonfamily households - 4-person household (%)
Size of nonfamily households - 5-person household (%)
Size of nonfamily households - 6-person household (%)
Size of nonfamily households - 7-or-moreperson household (%)
Year house built - Built 2010 or later (%)
Year house built - Built 2000 to 2009 (%)
Year house built - Built 1990 to 1999 (%)
Year house built - Built 1980 to 1989 (%)
Year house built - Built 1970 to 1979 (%)
Year house built - Built 1960 to 1969 (%)
Year house built - Built 1950 to 1959 (%)
Year house built - Built 1940 to 1949 (%)
Year house built - Built 1939 or earlier (%)
Median number of rooms in houses and condos
Median number of rooms in apartments
Median number of bedrooms in owner occupied houses
Mean number of bedrooms in owner occupied houses
Median number of bedrooms in renter occupied houses
Mean number of bedrooms in renter occupied houses
Median number of vehichles in owner occupied houses
Mean number of vehichles in owner occupied houses
Median number of vehichles in renter occupied houses
Mean number of vehichles in renter occupied houses
Rooms in owner-occupied houses - 1 room (%)
Rooms in owner-occupied houses - 2 rooms (%)
Rooms in owner-occupied houses - 3 rooms (%)
Rooms in owner-occupied houses - 4 rooms (%)
Rooms in owner-occupied houses - 5 rooms (%)
Rooms in owner-occupied houses - 6 rooms (%)
Rooms in owner-occupied houses - 7 rooms (%)
Rooms in owner-occupied houses - 8 rooms (%)
Rooms in owner-occupied houses - 9+ rooms (%)
Rooms in renter-occupied houses - 1 room (%)
Rooms in renter-occupied houses - 2 rooms (%)
Rooms in renter-occupied houses - 3 rooms (%)
Rooms in renter-occupied houses - 4 rooms (%)
Rooms in renter-occupied houses - 5 rooms (%)
Rooms in renter-occupied houses - 6 rooms (%)
Rooms in renter-occupied houses - 7 rooms (%)
Rooms in renter-occupied houses - 8 rooms (%)
Rooms in renter-occupied houses - 9+ rooms (%)
Bedrooms in owner-occupied houses - no bedrooms (%)
Bedrooms in owner-occupied houses - 1 bedroom (%)
Bedrooms in owner-occupied houses - 2 bedrooms (%)
Bedrooms in owner-occupied houses - 3 bedrooms (%)
Bedrooms in owner-occupied houses - 4 bedrooms (%)
Bedrooms in owner-occupied houses - 5+ bedrooms (%)
Bedrooms in renter-occupied houses - no bedrooms (%)
Bedrooms in renter-occupied houses - 1 bedroom (%)
Bedrooms in renter-occupied houses - 2 bedrooms (%)
Bedrooms in renter-occupied houses - 3 bedrooms (%)
Bedrooms in renter-occupied houses - 4 bedrooms (%)
Bedrooms in renter-occupied houses - 5+ bedrooms (%)
Vehicles available in owner-occupied houses - no vehicle available (%)
Vehicles available in owner-occupied houses - 1 vehicle available(%)
Vehicles available in owner-occupied houses - 2 Vehicles available (%)
Vehicles available in owner-occupied houses - 3 Vehicles available (%)
Vehicles available in owner-occupied houses - 4 Vehicles available (%)
Vehicles available in owner-occupied houses - 5+ Vehicles available (%)
Vehicles available in renter-occupied houses - no vehicle available (%)
Vehicles available in renter-occupied houses - 1 vehicle available (%)
Vehicles available in renter-occupied houses - 2 Vehicles available (%)
Vehicles available in renter-occupied houses - 3 Vehicles available (%)
Vehicles available in renter-occupied houses - 4 Vehicles available (%)
Vehicles available in renter-occupied houses - 5+ Vehicles available (%)
Housing units in structures - 1, detached (%)
Housing units in structures - 1, attached (%)
Housing units in structures - 2 (%)
Housing units in structures - 3 or 4 (%)
Housing units in structures - 5 to 9 (%)
Housing units in structures - 10 to 19 (%)
Housing units in structures - 20 to 49 (%)
Housing units in structures - 50 or more (%)
Housing units in structures - Mobile home (%)
Housing units in structures - Boat, RV, van, etc. (%)
Housing units in structures - Owners - 1, detached (%)
Housing units in structures - Owners - 1, attached (%)
Housing units in structures - Owners - 2 (%)
Housing units in structures - Owners - 3 or 4 (%)
Housing units in structures - Owners - 5 to 9 (%)
Housing units in structures - Owners - 10 to 19 (%)
Housing units in structures - Owners - 20 to 49 (%)
Housing units in structures - Owners - 50 or more (%)
Housing units in structures - Owners - Mobile home (%)
Housing units in structures - Owners - Boat, RV, van, etc. (%)
Housing units in structures - Renters - 1, detached (%)
Housing units in structures - Renters - 1, attached (%)
Housing units in structures - Renters - 2 (%)
Housing units in structures - Renters - 3 or 4 (%)
Housing units in structures - Renters - 5 to 9 (%)
Housing units in structures - Renters - 10 to 19 (%)
Housing units in structures - Renters - 20 to 49 (%)
Housing units in structures - Renters - 50 or more (%)
Housing units in structures - Renters - Mobile home (%)
Housing units in structures - Renters - Boat, RV, van, etc. (%)
House/condo owner moved in on average (years ago)
Renter moved in on average (years ago)
Year householder moved into unit - Moved in 1999 to March 2000 (%)
Year householder moved into unit - Moved in 1999 to March 2000 (%) - White
Year householder moved into unit - Moved in 1999 to March 2000 (%) - Black or African American
Year householder moved into unit - Moved in 1999 to March 2000 (%) - Asian
Year householder moved into unit - Moved in 1999 to March 2000 (%) - Hispanic or Latino
Year householder moved into unit - Moved in 1999 to March 2000 (%) - American Indian and Alaska Native
Year householder moved into unit - Moved in 1999 to March 2000 (%) - Multirace
Year householder moved into unit - Moved in 1999 to March 2000 (%) - Other Race
Year householder moved into unit - Moved in 1995 to 1998 (%)
Year householder moved into unit - Moved in 1995 to 1998 (%) - White
Year householder moved into unit - Moved in 1995 to 1998 (%) - Black or African American
Year householder moved into unit - Moved in 1995 to 1998 (%) - Asian
Year householder moved into unit - Moved in 1995 to 1998 (%) - Hispanic or Latino
Year householder moved into unit - Moved in 1995 to 1998 (%) - American Indian and Alaska Native
Year householder moved into unit - Moved in 1995 to 1998 (%) - Multirace
Year householder moved into unit - Moved in 1995 to 1998 (%) - Other Race
Year householder moved into unit - Moved in 1990 to 1994 (%)
Year householder moved into unit - Moved in 1990 to 1994 (%) - White
Year householder moved into unit - Moved in 1990 to 1994 (%) - Black or African American
Year householder moved into unit - Moved in 1990 to 1994 (%) - Asian
Year householder moved into unit - Moved in 1990 to 1994 (%) - Hispanic or Latino
Year householder moved into unit - Moved in 1990 to 1994 (%) - American Indian and Alaska Native
Year householder moved into unit - Moved in 1990 to 1994 (%) - Multirace
Year householder moved into unit - Moved in 1990 to 1994 (%) - Other Race
Year householder moved into unit - Moved in 1980 to 1989 (%)
Year householder moved into unit - Moved in 1980 to 1989 (%) - White
Year householder moved into unit - Moved in 1980 to 1989 (%) - Black or African American
Year householder moved into unit - Moved in 1980 to 1989 (%) - Asian
Year householder moved into unit - Moved in 1980 to 1989 (%) - Hispanic or Latino
Year householder moved into unit - Moved in 1980 to 1989 (%) - American Indian and Alaska Native
Year householder moved into unit - Moved in 1980 to 1989 (%) - Multirace
Year householder moved into unit - Moved in 1980 to 1989 (%) - Other Race
Year householder moved into unit - Moved in 1970 to 1979 (%)
Year householder moved into unit - Moved in 1970 to 1979 (%) - White
Year householder moved into unit - Moved in 1970 to 1979 (%) - Black or African American
Year householder moved into unit - Moved in 1970 to 1979 (%) - Asian
Year householder moved into unit - Moved in 1970 to 1979 (%) - Hispanic or Latino
Year householder moved into unit - Moved in 1970 to 1979 (%) - American Indian and Alaska Native
Year householder moved into unit - Moved in 1970 to 1979 (%) - Multirace
Year householder moved into unit - Moved in 1970 to 1979 (%) - Other Race
Year householder moved into unit - Moved in 1969 or earlier (%)
Year householder moved into unit - Moved in 1969 or earlier (%) - White
Year householder moved into unit - Moved in 1969 or earlier (%) - Black or African American
Year householder moved into unit - Moved in 1969 or earlier (%) - Asian
Year householder moved into unit - Moved in 1969 or earlier (%) - Hispanic or Latino
Year householder moved into unit - Moved in 1969 or earlier (%) - American Indian and Alaska Native
Year householder moved into unit - Moved in 1969 or earlier (%) - Multirace
Year householder moved into unit - Moved in 1969 or earlier (%) - Other Race
Housing units lacking complete plumbing facilities (%)
Housing units lacking complete kitchen facilities (%)
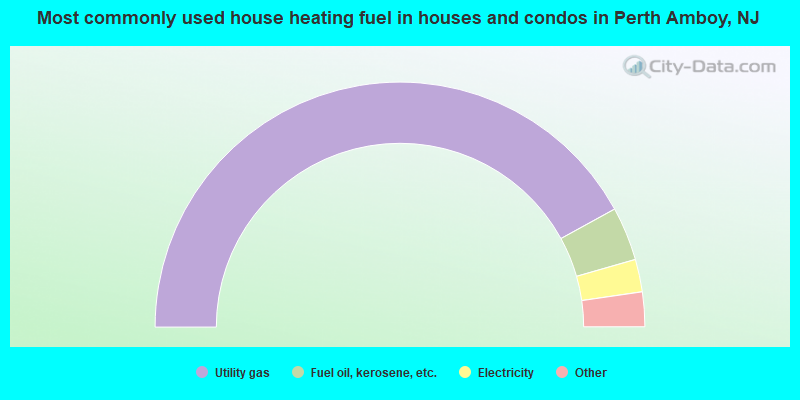
House heating fuel used in houses and condos - Utility gas (%)
House heating fuel used in houses and condos - Bottled, tank, or LP gas (%)
House heating fuel used in houses and condos - Electricity (%)
House heating fuel used in houses and condos - Fuel oil, kerosene, etc. (%)
House heating fuel used in houses and condos - Coal or coke (%)
House heating fuel used in houses and condos - Wood (%)
House heating fuel used in houses and condos - Solar energy (%)
House heating fuel used in houses and condos - Other fuel (%)
House heating fuel used in houses and condos - No fuel used (%)
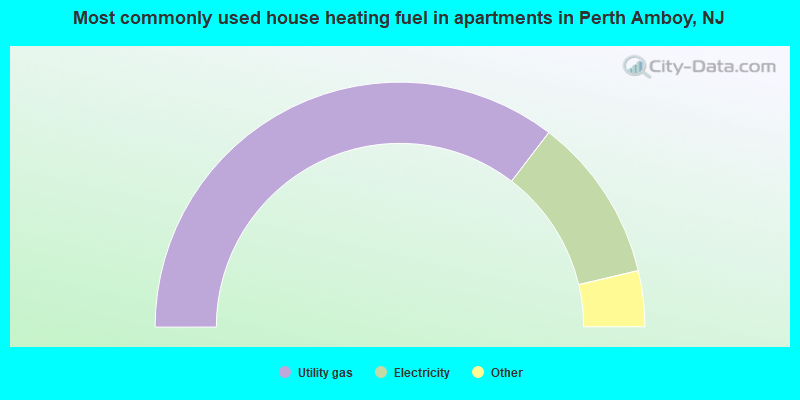
House heating fuel used in apartments - Utility gas (%)
House heating fuel used in apartments - Bottled, tank, or LP gas (%)
House heating fuel used in apartments - Electricity (%)
House heating fuel used in apartments - Fuel oil, kerosene, etc. (%)
House heating fuel used in apartments - Coal or coke (%)
House heating fuel used in apartments - Wood (%)
House heating fuel used in apartments - Solar energy (%)
House heating fuel used in apartments - Other fuel (%)
House heating fuel used in apartments - No fuel used (%)
Median year house/condo built: 1953Median year apartment built: 1961Household type by relationship:
Households: 55,307
Male householders: 9,068 (2,127 living alone ), Female householders: 9,367 (2,047 living alone )6,163 spouses (6,114 opposite-sex spouses ), 2,336 unmarried partners , (2,301 opposite-sex unmarried partners ), 18,768 children (17,635 natural , 96 adopted , 1,037 stepchildren ), 1,980 grandchildren , 1,291 brothers or sisters , 1,679 parents , 0 foster children , 1,997 other relatives , 2,103 non-relatives In group quarters: 549
Size of family households: 3,666 2-persons , 3,572 3-persons , 2,772 4-persons , 1,776 5-persons , 741 6-persons , 526 7-or-more-persons .
Size of nonfamily households: 4,244 1-person , 1,148 2-persons , 74 3-persons , 75 5-persons , 6 6-persons .
4,356 married couples with children. single-parent households (815 men , 5,121 women ).
19.4% of residents of Perth Amboy speak English at home. of residents speak Spanish at home (44% speak English very well , 18% speak English well , 18% speak English not well , 20% don't speak English at all ).of residents speak other Indo-European language at home (67% speak English very well , 23% speak English well , 8% speak English not well , 2% don't speak English at all ).of residents speak Asian or Pacific Island language at home (63% speak English very well , 22% speak English well , 8% speak English not well , 7% don't speak English at all ).of residents speak other language at home (71% speak English very well , 19% speak English well , 10% speak English not well ).
Foreign born population: 26,745 (48.4%)of them are naturalized citizens )
Median number of rooms in houses and condos:
Median number of rooms in apartments
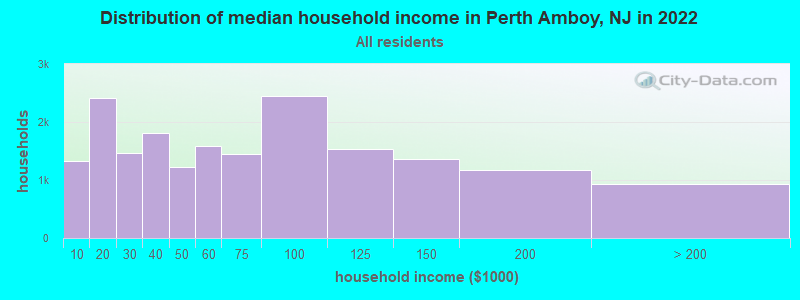
Perth Amboy, NJ household income distribution 1,321 Less than $10,0002,411 $10,000 to $19,9991,464 $20,000 to $29,9991,815 $30,000 to $39,9991,226 $40,000 to $49,9991,584 $50,000 to $59,9991,453 $60,000 to $74,9992,447 $75,000 to $99,9991,543 $100,000 to $124,9991,360 $125,000 to $149,9991,164 $150,000 to $199,999932 $200,000 or more
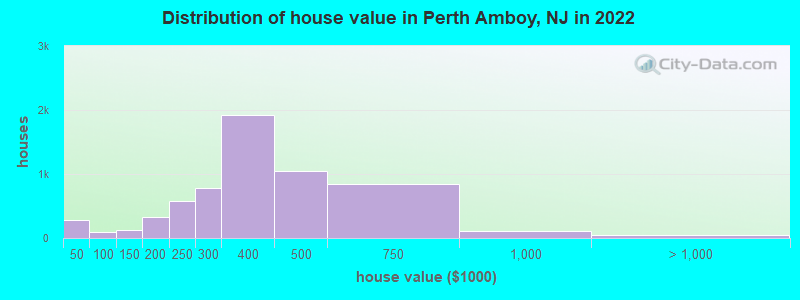
Home value of owner - occupied houses in 2022 in Perth Amboy, NJ 192 Less than $10,00011 $20,000 to $24,99919 $25,000 to $29,99929 $30,000 to $34,9999 $35,000 to $39,99921 $40,000 to $49,99978 $80,000 to $89,99926 $100,000 to $124,999101 $125,000 to $149,999210 $150,000 to $174,999121 $175,000 to $199,999581 $200,000 to $249,999789 $250,000 to $299,9991,928 $300,000 to $399,9991,043 $400,000 to $499,999840 $500,000 to $749,999108 $750,000 to $999,99923 $1,000,000 to $1,499,99917 $2,000,000 or moreRent paid by renters in 2022 in Perth Amboy, NJ 149 $100 to $149124 $150 to $19962 $200 to $24972 $250 to $299100 $300 to $3498 $350 to $399162 $400 to $44967 $450 to $49946 $500 to $54965 $550 to $599159 $600 to $64985 $650 to $699105 $700 to $749274 $750 to $799258 $800 to $899838 $900 to $9992,564 $1,000 to $1,2492,885 $1,250 to $1,4993,285 $1,500 to $1,999441 $2,000 to $2,49988 $2,500 to $2,999214 No cash rent
Percentage of workers working in this county: 82.5%Number of people working at home: 1,168 (4.7% of all workers )
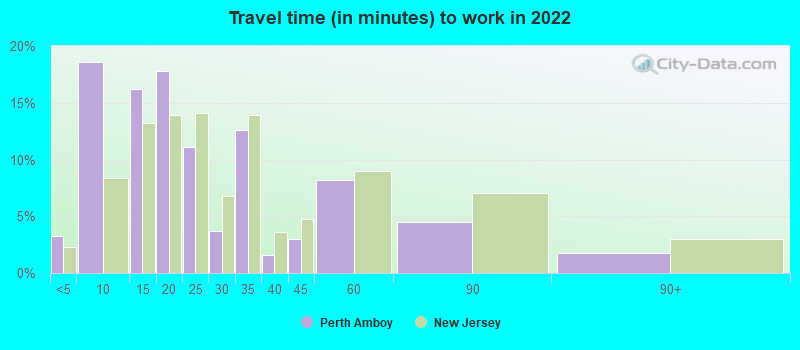
Travel time to work (commute)
Less than 5 minutes: 5265 to 9 minutes: 3,37710 to 14 minutes: 4,07215 to 19 minutes: 3,74620 to 24 minutes: 2,55025 to 29 minutes: 1,25830 to 34 minutes: 4,09735 to 39 minutes: 50340 to 44 minutes: 84045 to 59 minutes: 1,29460 to 89 minutes: 1,23490 or more minutes: 423
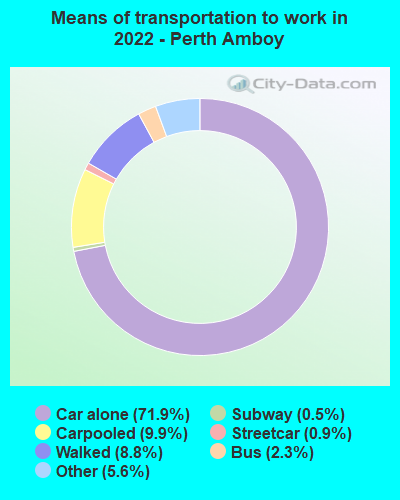
Means of transportation to work:
Drove a car alone: 9,755 (62.8%)Carpooled: 1,592 (10.2%)Bus : 141 (0.9%)Subway or elevated rail : 183 (1.2%)Long-distance train or commuter rail : 55 (0.4%)Taxi: 1,037 (6.7%)Bicycle: 8 (0.1%)Walked: 1,755 (11.3%)Worked at home: 1,168 (7.5%)
Unemployment by race in 2022
Unemployment rate for White non-Hispanic residents 3.0% Males0.5% FemalesUnemployment rate for Black residents 33.4% MalesUnemployment rate for American Indian and Alaska Native residents 36.4% FemalesUnemployment rate for Asian residents 12.0% Males1.9% FemalesUnemployment rate for other race residents 13.9% Males11.5% FemalesUnemployment rate for two or more race residents 6.7% Males14.1% FemalesUnemployment rate for Hispanic or Latino residents 11.4% Males10.1% Females
Year of entry for the foreign-born population in Perth Amboy, New Jersey
10,175 2010 or later 6,613 2000 to 2009 4,544 1990 to 1999 4,619 1980 to 1989 1,992 1970 to 1979 1,312 Before 1970
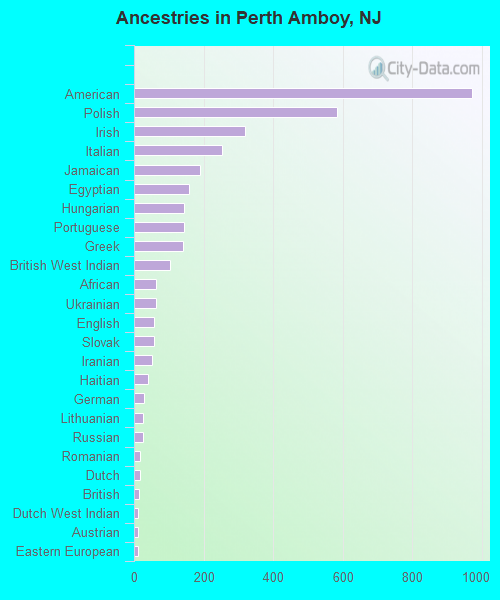
First ancestries reported:
American: 972 (2.6%)
Polish: 583 (1.5%)
Irish: 320 (0.8%)
Italian: 254 (0.7%)
Jamaican: 190 (0.5%)
Egyptian: 158 (0.4%)
Hungarian: 143 (0.4%)
Portuguese: 143 (0.4%)
Greek: 140 (0.4%)
British West Indian: 104 (0.3%)
African: 64 (0.2%)
Ukrainian: 62 (0.2%)
English: 57 (0.2%)
Slovak: 57 (0.2%)
Iranian: 53 (0.1%)
Haitian: 39 (0.1%)
German: 28 (0.07%)
Lithuanian: 26 (0.07%)
Russian: 26 (0.07%)
Romanian: 18 (0.05%)
Dutch: 16 (0.04%)
British: 15 (0.04%)
Dutch West Indian: 12 (0.03%)
Austrian: 11 (0.03%)
Eastern European: 11 (0.03%)
Carpatho Rusyn: 10 (0.03%)
French: 9 (0.02%)
West Indian: 9 (0.02%)
Czech: 8 (0.02%)
Swedish: 8 (0.02%) Most common places of birth for foreign-born residents (%): Dominican Republic Perth Amboy:
65.9% (17,164)New Jersey:
9.7% (209,055)
Mexico Perth Amboy:
7.3% (1,908)New Jersey:
4.8% (102,527)
Peru Perth Amboy:
5.0% (1,289)New Jersey:
2.7% (58,563)
Guatemala Perth Amboy:
2.5% (656)New Jersey:
2.2% (46,813)
Ecuador Perth Amboy:
2.5% (656)New Jersey:
4.4% (95,275)
El Salvador Perth Amboy:
2.3% (588)New Jersey:
2.3% (48,885)
Cuba Perth Amboy:
2.3% (586)New Jersey:
2.1% (45,435)
Colombia Perth Amboy:
1.7% (444)New Jersey:
4.2% (90,817)
Honduras Perth Amboy:
1.5% (394)New Jersey:
1.7% (37,335)
Place of birth for U.S.-born residents:
This state: 21,375Other state: 3,385Northeast: 2,411Midwest: 189South: 575West: 161 93.6% of Perth Amboy residents lived in the same house 1 years ago.
Out of people who lived in different houses, 46.5% lived in this county.
Out of people who lived in different counties, 59.7% lived in New Jersey.
Perth Amboy:
93.6%State average:
90.4%
Education attainment for males 25 years and older:
No schooling: 1,675Nursery to 4th grade: 4955th and 6th grade: 9537th and 8th grade: 5119th grade: 62910th grade: 49511th grade: 26412th grade, no diploma: 977High school graduate (or equivalency): 6,032Less than 1 year of college: 646Some college more than 1 year, no degree: 1,631Associate degree: 1,116Bachelor's degree: 1,839Master's degree: 409Professional school degree: 155Doctorate degree: 38
Education attainment for females 25 years and older:
No schooling: 1,427Nursery to 4th grade: 4905th and 6th grade: 4137th and 8th grade: 7289th grade: 56210th grade: 41611th grade: 25912th grade, no diploma: 855High school graduate (or equivalency): 5,265Less than 1 year of college: 1,461Some college more than 1 year, no degree: 2,133Associate degree: 1,782Bachelor's degree: 1,928Master's degree: 784Professional school degree: 64Doctorate degree: 79
Housing units in structures:
One, detached: 5,807One, attached: 1,327Two: 4,6353 or 4: 2,7425 to 9: 1,16510 to 19: 1,11420 to 49: 98450 or more: 1,510Mobile homes: 21Housing units lacking complete plumbing facilities in 2022: 0.4%Housing units lacking complete kitchen facilities in 2022: 2.2%House/condo owner moved in on average 16 years ago
Renter moved in on average 6 years ago
Private vs. public school enrollment:
Students in private schools in grades 1 to 8 (elementary and middle school): 300 Here:
5.6%New Jersey:
12.3%
Students in private schools in grades 9 to 12 (high school): 95 Here:
2.8%New Jersey:
13.1%
Students in private undergraduate colleges: 657 Here:
25.0%New Jersey:
33.2%