Pennington Gap, VA (Virginia) Houses and Residents
| Pennington Gap: | $97,613 |
| Virginia: | $365,700 |
Mean price in 2022:
Detached houses: $192,008
Here: $192,008 State: $472,865 Mobile homes: $48,070
Here: $48,070 State: $100,736
Total population: 1,823 (Urban population: 0, Rural population: 1,831 (all nonfarm))
Houses: 941 (762 occupied: 332 owner occupied, 437 renter occupied)
| % of renters here: | 57% |
| State: | 33% |
Housing density: 620 houses/condos per square mile
Median price asked for vacant for-sale houses and condos in 2022 in this county: $227,802.
Median contract rent in 2022: $402 (lower quartile is $282, upper quartile is $549)
Median rent asked for vacant for-rent units in 2022: $458
Median gross rent in Pennington Gap, VA in 2022: $684
Housing units in Pennington Gap with a mortgage: 151 (0 second mortgage, 0 home equity loan, 0 both second mortgage and home equity loan)
Houses without a mortgage: 0
Median household income for houses/condos with a mortgage: $35,309
Median household income for apartments without a mortgage: $32,964
Median monthly housing costs: $641
Compare current foreclosures near Pennington Gap, VA:
| Photo | Address | Area | Beds / Baths | Price | Details |
|---|---|---|---|---|---|

|
#1
Stonegate Dr Apt 335
Pennington Gap, VA 24277
|
- sq. feet
|
- baths - beds |
show details | |

|
#2
Highway 522
Cumberland, KY 40823
|
2,000 sq. feet
|
1 baths 3 beds |
$120,000
|
show details |

|
#3
Elk Knob Rd
Pennington Gap, VA 24277
|
- sq. feet
|
- baths - beds |
show details | |

|
#4
Big Hill Rd
Pennington Gap, VA 24277
|
- sq. feet
|
- baths - beds |
show details | |

|
#5
Sergent St
Evarts, KY 40828
|
1,008 sq. feet
|
1 baths 4 beds |
show details | |

|
#6
Bedrock Dr
Dryden, VA 24243
|
1,597 sq. feet
|
2 baths 3 beds |
show details | |

|
#7
Chalet Village Rd
Jonesville, VA 24263
|
1,512 sq. feet
|
1 baths 3 beds |
show details | |

|
#8
Canton Rd
Blackwater, VA 24221
|
1,435 sq. feet
|
1 baths 3 beds |
show details | |

|
#9
Bloodhound Ln
Duffield, VA 24244
|
1,232 sq. feet
|
1 baths 3 beds |
show details | |

|
#10
Delvale Rd
Keokee, VA 24265
|
- sq. feet
|
1 baths 3 beds |
show details |
| Photo | Address | Area | Beds / Baths | Price | Details |
|---|---|---|---|---|---|

|
#11
Blacktop Dr
Blackwater, VA 24221
|
- sq. feet
|
2 baths 4 beds |
show details | |

|
#12
Jasper Rd
Duffield, VA 24244
|
- sq. feet
|
2 baths 3 beds |
show details | |

|
#13
W Snowflake Rd
Surgoinsville, TN 37873
|
1,200 sq. feet
|
1 baths - beds |
show details | |

|
#14
Veterans Memorial Hwy
Big Stone Gap, VA 24219
|
- sq. feet
|
2 baths 3 beds |
show details | |

|
#15
Unicorn Ln
Sneedville, TN 37869
|
- sq. feet
|
- baths - beds |
show details | |

|
#16
Harlan Gas Rd
Harlan, KY 40831
|
- sq. feet
|
- baths - beds |
show details | |

|
#17
Spruce St
Benham, KY 40807
|
- sq. feet
|
- baths - beds |
show details | |

|
#18
Fairview Rd
Duffield, VA 24244
|
- sq. feet
|
- baths - beds |
show details | |

|
#19
Highway 522
Totz, KY 40870
|
- sq. feet
|
- baths - beds |
show details | |

|
#20
Vardy Blackwater
Sneedville, TN 37869
|
- sq. feet
|
- baths - beds |
show details |
| Photo | Address | Area | Beds / Baths | Price | Details |
|---|---|---|---|---|---|

|
#21
Salling Street, Apt #101
Duffield, VA 24244
|
- sq. feet
|
- baths - beds |
show details | |

|
#22
Shavers Ford Rd
Jonesville, VA 24263
|
- sq. feet
|
- baths - beds |
show details | |

|
#23
Highway 215
Evarts, KY 40828
|
- sq. feet
|
- baths - beds |
show details | |

|
#24
Duff Patt Hwy
Duffield, VA 24244
|
- sq. feet
|
- baths - beds |
show details | |

|
#25
Day Ln
Cawood, KY 40815
|
- sq. feet
|
- baths - beds |
show details | |

|
#26
Seibers Rd
Closplint, KY 40927
|
- sq. feet
|
- baths - beds |
show details | |

|
#27
Route 3 Box 94
Jonesville, VA 24263
|
- sq. feet
|
- baths - beds |
show details | |

|
#28
Cecil Quillen D D
Duffield, VA 24244
|
- sq. feet
|
- baths - beds |
show details | |

|
#29
Woodland Ln
Cumberland, KY 40823
|
- sq. feet
|
- baths - beds |
show details | |

|
#30
Railroad St
Cumberland, KY 40823
|
- sq. feet
|
- baths - beds |
show details |
| Photo | Address | Area | Beds / Baths | Price | Details |
|---|---|---|---|---|---|

|
#31
Rd
Big Stone Gap, VA 24219
|
- sq. feet
|
- baths - beds |
show details | |

|
#32
Red Bud Hill Rd
Evarts, KY 40828
|
- sq. feet
|
- baths - beds |
show details | |

|
#33
Derby Rd
Appalachia, VA 24216
|
- sq. feet
|
- baths - beds |
show details | |

|
#34
Derby Rd
Appalachia, VA 24216
|
- sq. feet
|
- baths - beds |
show details | |

|
#35
Poplar Ter
Harlan, KY 40831
|
- sq. feet
|
- baths - beds |
show details | |

|
Check over 1 million property listings on Foreclosure.com!
|
browse all offers | |||


 | Wise County Virginia (5 replies) |
| Best Cities /town to move to in Southern Virginia (13 replies) |

Median year apartment built: 1973
Household type by relationship:
Households: 2,269- Male householders: 290 (89 living alone), Female householders: 464 (151 living alone)
156 spouses (156 opposite-sex spouses), 61 unmarried partners, (61 opposite-sex unmarried partners), 787 children (632 natural, 79 adopted, 75 stepchildren), 206 grandchildren, 27 brothers or sisters, 31 parents, 2 foster children, 102 other relatives, 12 non-relatives
- In group quarters: 127
Size of family households: 209 2-persons, 136 3-persons, 96 4-persons, 31 5-persons, 31 7-or-more-persons.
Size of nonfamily households: 247 1-person, 16 2-persons.
198 married couples with children.
354 single-parent households (4 men, 350 women).
99.7% of residents of Pennington Gap speak English at home.
Foreign born population: 9 (0.4%)
(100.0% of them are naturalized citizens)
| Here: | 5.9 |
| State: | 7.0 |
| Here: | 5.0 |
| State: | 4.3 |

- Bedrooms in owner-occupied houses and condos in Pennington Gap, Virginia
- 8no bedroom
- 41 bedroom
- 922 bedrooms
- 2003 bedrooms
- 104 bedrooms
- 175+ bedrooms

- Bedrooms in renter-occupied apartments in Pennington Gap, Virginia
- 0no bedroom
- 551 bedroom
- 1562 bedrooms
- 2263 bedrooms
- 04 bedrooms
- 05+ bedrooms

- Cars and other vehicles available in Pennington Gap in owner-occupied houses/condos
- 35no vehicle
- 1641 vehicle
- 852 vehicles
- 293 vehicles
- 204 vehicles
- 05+ vehicles

- Cars and other vehicles available in Pennington Gap in renter-occupied apartments
- 136no vehicle
- 2571 vehicle
- 382 vehicles
- 03 vehicles
- 74 vehicles
- 05+ vehicles

- Rooms in owner-occupied houses in Pennington Gap, Virginia
- 81 room
- 02 rooms
- 03 rooms
- 614 rooms
- 795 rooms
- 436 rooms
- 727 rooms
- 318 rooms
- 399+ rooms

- Rooms in renter-occupied apartments in Pennington Gap, Virginia
- 01 room
- 72 rooms
- 523 rooms
- 874 rooms
- 1315 rooms
- 756 rooms
- 327 rooms
- 438 rooms
- 109+ rooms


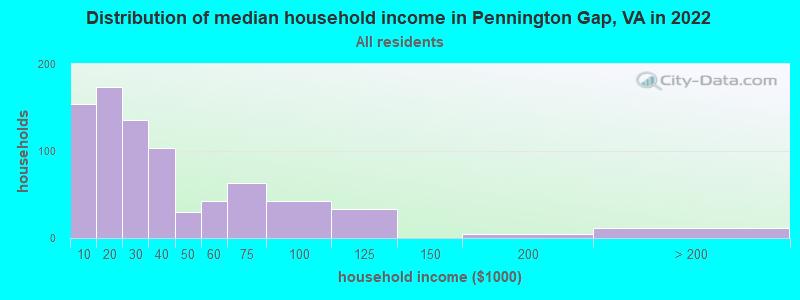
Pennington Gap, VA household income distribution

- 154Less than $10,000
- 174$10,000 to $19,999
- 136$20,000 to $29,999
- 103$30,000 to $39,999
- 30$40,000 to $49,999
- 43$50,000 to $59,999
- 63$60,000 to $74,999
- 42$75,000 to $99,999
- 33$100,000 to $124,999
- 5$150,000 to $199,999
- 12$200,000 or more
Home value of owner - occupied houses in 2022 in Pennington Gap, VA
-
- 6Less than $10,000
- 0$10,000 to $14,999
- 7$25,000 to $29,999
- 46$35,000 to $39,999
- 7$40,000 to $49,999
- 11$50,000 to $59,999
- 44$60,000 to $69,999
- 6$70,000 to $79,999
- 39$80,000 to $89,999
- 39$90,000 to $99,999
- 59$100,000 to $124,999
- 9$125,000 to $149,999
- 16$150,000 to $174,999
- 11$300,000 to $399,999
- 4$400,000 to $499,999
- 6$2,000,000 or more

Rent paid by renters in 2022 in Pennington Gap, VA
-
- 7Less than $100
- 45$100 to $149
- 16$150 to $199
- 28$200 to $249
- 6$250 to $299
- 54$300 to $349
- 44$350 to $399
- 18$400 to $449
- 37$450 to $499
- 46$500 to $549
- 65$550 to $599
- 14$600 to $649
- 33No cash rent


Percentage of workers working in this county: 62.2%
Number of people working at home: 29 (6.1% of all workers)

Travel time to work (commute)
- Less than 5 minutes: 108
- 5 to 9 minutes: 85
- 10 to 14 minutes: 22
- 15 to 19 minutes: 47
- 20 to 24 minutes: 63
- 25 to 29 minutes: 0
- 30 to 34 minutes: 54
- 35 to 39 minutes: 9
- 40 to 44 minutes: 4
- 45 to 59 minutes: 25
- 60 to 89 minutes: 25
- 90 or more minutes: 0

Means of transportation to work:
- Drove a car alone: 1,087 (87.0%)
- Carpooled: 61 (4.9%)
- Bus: 12 (1.0%)
- Walked: 4 (0.3%)
- Worked at home: 29 (2.3%)

- Unemployment by race in 2022
- Unemployment rate for White non-Hispanic residents
- 22.6%Males
- 16.9%Females

- Year of entry for the foreign-born population in Pennington Gap, Virginia
- 02010 or later
- 92000 to 2009
- 01990 to 1999
- 01980 to 1989
- 31970 to 1979
- 0Before 1970

First ancestries reported:
- Irish: 540 (37.2%)
- American: 519 (35.8%)
- German: 123 (8.5%)
- English: 44 (3.0%)
- European: 19 (1.3%)
- Italian: 12 (0.8%)
- African: 8 (0.6%)
- Scotch-Irish: 5 (0.3%)
- Swedish: 5 (0.3%)
Most common places of birth for foreign-born residents (%):
| Pennington Gap: | 77.8% (7) |
| Virginia: | 1.7% (18,227) |
Place of birth for U.S.-born residents:
- This state: 1,347
- Other state: 900
- Northeast: 3
- Midwest: 81
- South: 783
- West: 27
77.3% of Pennington Gap residents lived in the same house 1 years ago.
Out of people who lived in different houses, 25.5% lived in this county.
Out of people who lived in different counties, 0.0% lived in Virginia.
| Pennington Gap: | 77.3% |
| State average: | 86.6% |
Education attainment for males 25 years and older:
- No schooling: 16
- Nursery to 4th grade: 4
- 5th and 6th grade: 4
- 7th and 8th grade: 23
- 9th grade: 0
- 10th grade: 35
- 11th grade: 7
- 12th grade, no diploma: 5
- High school graduate (or equivalency): 176
- Less than 1 year of college: 11
- Some college more than 1 year, no degree: 78
- Associate degree: 15
- Bachelor's degree: 21
- Master's degree: 0
- Professional school degree: 0
- Doctorate degree: 0

Education attainment for females 25 years and older:
- No schooling: 9
- Nursery to 4th grade: 4
- 5th and 6th grade: 12
- 7th and 8th grade: 46
- 9th grade: 19
- 10th grade: 68
- 11th grade: 67
- 12th grade, no diploma: 0
- High school graduate (or equivalency): 274
- Less than 1 year of college: 14
- Some college more than 1 year, no degree: 161
- Associate degree: 85
- Bachelor's degree: 56
- Master's degree: 10
- Professional school degree: 5
- Doctorate degree: 10


Housing units in structures:
- One, detached: 686
- One, attached: 7
- Two: 57
- 3 or 4: 7
- 5 to 9: 2
- 10 to 19: 42
- 20 to 49: 28
- Mobile homes: 109
Housing units lacking complete kitchen facilities in 2022: 2.5%
House/condo owner moved in on average 11 years ago
Renter moved in on average 1 years ago


- 88.3%Electricity
- 6.2%Bottled, tank, or LP gas
- 2.8%Wood
- 1.5%Utility gas
- 1.2%Fuel oil, kerosene, etc.

- 95.3%Electricity
- 4.2%Bottled, tank, or LP gas
- 0.5%No fuel used
Private vs. public school enrollment:
| Here: | 0.0% |
| Virginia: | 13.2% |
| Here: | 10.5% |
| Virginia: | 10.2% |
| Here: | 0.0% |
| Virginia: | 18.7% |


