Paw Paw, IL (Illinois) Houses and Residents
| Paw Paw: | $149,108 |
| Illinois: | $251,600 |
Mean price in 2022:
Detached houses: $152,894
Here: $152,894 State: $310,164
Total population: 830 (Urban population: 0, Rural population: 853 (8 farm, 845 nonfarm))
Houses: 443 (387 occupied: 286 owner occupied, 105 renter occupied)
| % of renters here: | 27% |
| State: | 33% |
Housing density: 783 houses/condos per square mile
Median price asked for vacant for-sale houses and condos in 2022: $266,381.
Median contract rent in 2022: $794 (lower quartile is $651, upper quartile is $849)
Median rent asked for vacant for-rent units in 2022: $1,540
Median gross rent in Paw Paw, IL in 2022: $843
Housing units in Paw Paw with a mortgage: 181 (19 second mortgage, 0 home equity loan, 14 both second mortgage and home equity loan)
Houses without a mortgage: 3
Median household income for houses/condos with a mortgage: $73,056
Median household income for apartments without a mortgage: $59,111
Median monthly housing costs: $894
Compare current foreclosures near Paw Paw, IL:
| Photo | Address | Area | Beds / Baths | Price | Details |
|---|---|---|---|---|---|

|
#1
Wabansi Trl
Paw Paw, IL 61353
|
1,590 sq. feet
|
3 baths - beds |
show details | |

|
#2
Wheeler St
Paw Paw, IL 61353
|
- sq. feet
|
- baths - beds |
show details | |

|
#3
Phyllis Ave
Rochelle, IL 61068
|
1,056 sq. feet
|
1 baths 3 beds |
show details | |

|
#4
S Cherry St
Somonauk, IL 60552
|
- sq. feet
|
2 baths 3 beds |
show details | |

|
#5
14th Ave
Mendota, IL 61342
|
1,726 sq. feet
|
- baths - beds |
show details | |

|
#6
6th Ave
Rochelle, IL 61068
|
1,792 sq. feet
|
- baths - beds |
show details | |

|
#7
S 6th St
Rochelle, IL 61068
|
1,116 sq. feet
|
- baths - beds |
show details | |

|
#8
Garfield Dr
Rochelle, IL 61068
|
962 sq. feet
|
- baths - beds |
show details | |

|
#9
Lasalle Dr
Somonauk, IL 60552
|
1,344 sq. feet
|
- baths - beds |
show details | |

|
#10
N 8th St
Rochelle, IL 61068
|
1,213 sq. feet
|
- baths - beds |
show details |
| Photo | Address | Area | Beds / Baths | Price | Details |
|---|---|---|---|---|---|

|
#11
S Grant St
Earlville, IL 60518
|
1,342 sq. feet
|
- baths - beds |
show details | |

|
#12
3rd St
West Brooklyn, IL 61378
|
- sq. feet
|
- baths - beds |
show details | |

|
#13
8th Ave
Mendota, IL 61342
|
- sq. feet
|
- baths - beds |
show details | |

|
#14
N Main St
Rochelle, IL 61068
|
- sq. feet
|
- baths - beds |
show details | |

|
#15
N 46th Rd
Somonauk, IL 60552
|
- sq. feet
|
- baths - beds |
show details | |

|
#16
S 11th St
Rochelle, IL 61068
|
- sq. feet
|
- baths - beds |
show details | |

|
#17
N 36th Rd
Ottawa, IL 61350
|
- sq. feet
|
- baths - beds |
show details | |

|
#18
W Railroad St
Earlville, IL 60518
|
- sq. feet
|
- baths - beds |
show details | |

|
#19
S Main St Apt 10
Rochelle, IL 61068
|
- sq. feet
|
- baths - beds |
show details | |

|
#20
Dennis St
Rochelle, IL 61068
|
- sq. feet
|
- baths - beds |
show details |
| Photo | Address | Area | Beds / Baths | Price | Details |
|---|---|---|---|---|---|

|
#21
E Nissen Stigen
Lee, IL 60530
|
- sq. feet
|
- baths - beds |
show details | |

|
#22
N Gage St
Somonauk, IL 60552
|
- sq. feet
|
- baths - beds |
show details | |

|
#23
N 4645th Rd # B
Somonauk, IL 60552
|
- sq. feet
|
- baths - beds |
show details | |

|
#24
Willis Ave Apt 2
Rochelle, IL 61068
|
- sq. feet
|
- baths - beds |
show details | |

|
#25
N 46th Rd
Leland, IL 60531
|
- sq. feet
|
- baths - beds |
show details | |

|
#26
S 9th Ave Apt 135
Mendota, IL 61342
|
- sq. feet
|
- baths - beds |
show details | |

|
#27
2nd St
Mendota, IL 61342
|
- sq. feet
|
- baths - beds |
show details | |

|
#28
4th Ave
Mendota, IL 61342
|
- sq. feet
|
- baths - beds |
show details | |

|
#29
8th Ave
Mendota, IL 61342
|
- sq. feet
|
- baths - beds |
show details | |

|
#30
2nd Ave
Mendota, IL 61342
|
- sq. feet
|
- baths - beds |
show details |
| Photo | Address | Area | Beds / Baths | Price | Details |
|---|---|---|---|---|---|

|
#31
6th Ave
Mendota, IL 61342
|
- sq. feet
|
- baths - beds |
show details | |

|
#32
Monroe St Apt B
Mendota, IL 61342
|
- sq. feet
|
- baths - beds |
show details | |

|
#33
N Birch St
Waterman, IL 60556
|
- sq. feet
|
- baths - beds |
show details | |

|
#34
4th Ave
Mendota, IL 61342
|
- sq. feet
|
- baths - beds |
show details | |

|
#35
N 4750th Rd
Leland, IL 60531
|
- sq. feet
|
- baths - beds |
show details | |

|
#36
E Kross St
Leland, IL 60531
|
- sq. feet
|
- baths - beds |
show details | |

|
#37
W Hall St
Leland, IL 60531
|
- sq. feet
|
- baths - beds |
show details | |

|
#38
West St
Shabbona, IL 60550
|
- sq. feet
|
- baths - beds |
show details | |

|
#39
Lake Holiday Dr
Sandwich, IL 60548
|
- sq. feet
|
- baths - beds |
show details | |

|
#40
Willrett Rd
Malta, IL 60150
|
- sq. feet
|
- baths - beds |
show details |
| Photo | Address | Area | Beds / Baths | Price | Details |
|---|---|---|---|---|---|

|
#41
Fawn Dr
Somonauk, IL 60552
|
- sq. feet
|
- baths - beds |
show details | |

|
#42
Shabbona Rd
Shabbona, IL 60550
|
- sq. feet
|
- baths - beds |
show details | |

|
#43
N Main St
Rochelle, IL 61068
|
- sq. feet
|
- baths - beds |
show details | |

|
#44
Lasalle Dr
Somonauk, IL 60552
|
- sq. feet
|
- baths - beds |
show details | |

|
#45
5th St
Mendota, IL 61342
|
- sq. feet
|
- baths - beds |
show details | |

|
#46
Meriden St
Mendota, IL 61342
|
- sq. feet
|
- baths - beds |
show details | |

|
#47
S Shabbona Rd
Shabbona, IL 60550
|
- sq. feet
|
- baths - beds |
show details | |

|
#48
E Lasalle St
Somonauk, IL 60552
|
- sq. feet
|
- baths - beds |
show details | |

|
#49
W Mckinley St
Waterman, IL 60556
|
- sq. feet
|
- baths - beds |
show details | |

|
Check over 1 million property listings on Foreclosure.com!
|
browse all offers | |||


 | Within a max 4 hour drive from the Chicago area, where would you buy a vacation home? (20 replies) |
| The official IL weather thread (1217 replies) |
| Some suburb pics (56K BEWARE!) (402 replies) |
| Help smaller towns wanted! (47 replies) |
| waterman, il. (26 replies) |

Median year apartment built: 1961
Household type by relationship:
Households: 967- Male householders: 199 (55 living alone), Female householders: 181 (57 living alone)
180 spouses (180 opposite-sex spouses), 17 unmarried partners, (17 opposite-sex unmarried partners), 216 children (210 natural, 2 adopted, 3 stepchildren), 81 grandchildren, 7 brothers or sisters, 3 parents, 0 foster children, 54 other relatives, 23 non-relatives
Size of family households: 108 2-persons, 62 3-persons, 37 4-persons, 7 5-persons, 6 6-persons, 9 7-or-more-persons.
Size of nonfamily households: 118 1-person, 43 2-persons, 2 3-persons.
96 married couples with children.
36 single-parent households (25 men, 11 women).
96.7% of residents of Paw Paw speak English at home.
1.5% of residents speak Spanish at home (86% speak English very well, 14% speak English well).
0.9% of residents speak other Indo-European language at home (38% speak English very well, 62% speak English well).
Foreign born population: 8 (0.8%)
(50.0% of them are naturalized citizens)
| Here: | 6.6 |
| State: | 6.4 |
| Here: | 4.2 |
| State: | 4.1 |

- Bedrooms in owner-occupied houses and condos in Paw Paw, Illinois
- 0no bedroom
- 01 bedroom
- 512 bedrooms
- 1523 bedrooms
- 684 bedrooms
- 165+ bedrooms

- Bedrooms in renter-occupied apartments in Paw Paw, Illinois
- 0no bedroom
- 201 bedroom
- 652 bedrooms
- 183 bedrooms
- 24 bedrooms
- 05+ bedrooms

- Cars and other vehicles available in Paw Paw in owner-occupied houses/condos
- 9no vehicle
- 631 vehicle
- 1242 vehicles
- 663 vehicles
- 204 vehicles
- 45+ vehicles

- Cars and other vehicles available in Paw Paw in renter-occupied apartments
- 0no vehicle
- 511 vehicle
- 392 vehicles
- 63 vehicles
- 54 vehicles
- 55+ vehicles

- Rooms in owner-occupied houses in Paw Paw, Illinois
- 01 room
- 02 rooms
- 53 rooms
- 54 rooms
- 335 rooms
- 966 rooms
- 607 rooms
- 538 rooms
- 369+ rooms

- Rooms in renter-occupied apartments in Paw Paw, Illinois
- 01 room
- 02 rooms
- 183 rooms
- 464 rooms
- 265 rooms
- 86 rooms
- 77 rooms
- 08 rooms
- 09+ rooms


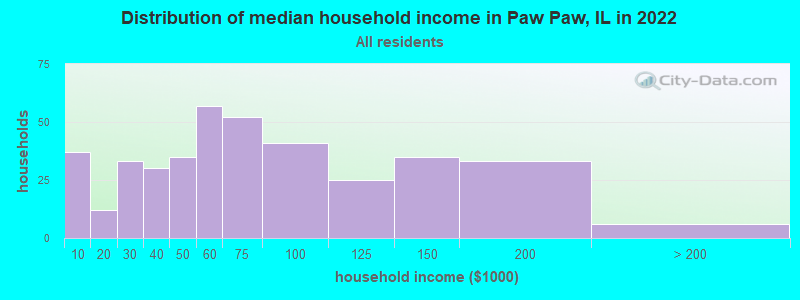
Paw Paw, IL household income distribution

- 37Less than $10,000
- 12$10,000 to $19,999
- 33$20,000 to $29,999
- 30$30,000 to $39,999
- 35$40,000 to $49,999
- 57$50,000 to $59,999
- 52$60,000 to $74,999
- 41$75,000 to $99,999
- 25$100,000 to $124,999
- 35$125,000 to $149,999
- 33$150,000 to $199,999
- 6$200,000 or more
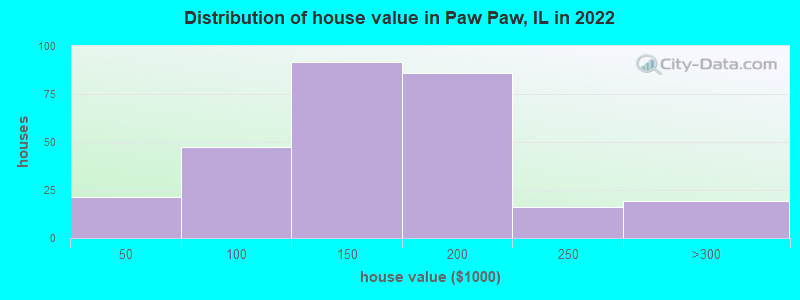
Home value of owner - occupied houses in 2022 in Paw Paw, IL
-
- 0$15,000 to $19,999
- 10$20,000 to $24,999
- 2$35,000 to $39,999
- 8$40,000 to $49,999
- 7$50,000 to $59,999
- 3$60,000 to $69,999
- 9$70,000 to $79,999
- 11$80,000 to $89,999
- 6$90,000 to $99,999
- 35$100,000 to $124,999
- 55$125,000 to $149,999
- 67$150,000 to $174,999
- 18$175,000 to $199,999
- 16$200,000 to $249,999
- 18$250,000 to $299,999
- 0$1,000,000 to $1,499,999
Rent paid by renters in 2022 in Paw Paw, IL
-
- 6$300 to $349
- 6$400 to $449
- 4$450 to $499
- 3$550 to $599
- 2$600 to $649
- 12$650 to $699
- 11$700 to $749
- 2$750 to $799
- 54$800 to $899
- 6No cash rent


Percentage of workers working in this county: 42.2%
Number of people working at home: 30 (7.0% of all workers)
Travel time to work (commute)
- Less than 5 minutes: 28
- 5 to 9 minutes: 27
- 10 to 14 minutes: 7
- 15 to 19 minutes: 36
- 20 to 24 minutes: 18
- 25 to 29 minutes: 8
- 30 to 34 minutes: 27
- 35 to 39 minutes: 16
- 40 to 44 minutes: 25
- 45 to 59 minutes: 79
- 60 to 89 minutes: 87
- 90 or more minutes: 18
Means of transportation to work:
- Drove a car alone: 325 (81.2%)
- Carpooled: 41 (10.2%)
- Bus or trolley bus: 3 (0.8%)
- Railroad: 2 (0.5%)
- Walked: 20 (5.0%)
- Worked at home: 9 (2.2%)

- Unemployment by race in 2022
- Unemployment rate for White non-Hispanic residents
- 5.9%Males
- 1.5%Females

- Year of entry for the foreign-born population in Paw Paw, Illinois
- 02010 or later
- 22000 to 2009
- 21990 to 1999
- 01980 to 1989
- 01970 to 1979
- 2Before 1970

First ancestries reported:
- German: 54 (17.3%)
- Polish: 44 (14.1%)
- American: 35 (11.2%)
- Italian: 32 (10.2%)
- English: 24 (7.7%)
- Scandinavian: 24 (7.7%)
- Irish: 21 (6.7%)
- Norwegian: 11 (3.5%)
- Czech: 10 (3.2%)
- Scotch-Irish: 7 (2.2%)
- Greek: 4 (1.3%)
- Canadian: 2 (0.6%)
- French: 2 (0.6%)
- Ukrainian: 2 (0.6%)
- Finnish: 1 (0.3%)
- French Canadian: 1 (0.3%)
- Russian: 1 (0.3%)
- Scottish: 1 (0.3%)
Most common places of birth for foreign-born residents (%):
| Paw Paw: | 25.0% (2) |
| Illinois: | 0.1% (910) |
| Paw Paw: | 25.0% (2) |
| Illinois: | 1.0% (18,753) |
| Paw Paw: | 12.5% (1) |
| Illinois: | 6.9% (124,474) |
| Paw Paw: | 12.5% (1) |
| Illinois: | 34.7% (626,958) |
Place of birth for U.S.-born residents:
- This state: 813
- Other state: 122
- Northeast: 7
- Midwest: 42
- South: 30
- West: 42
92.7% of Paw Paw residents lived in the same house 1 years ago.
Out of people who lived in different houses, 17.3% lived in this county.
Out of people who lived in different counties, 82.1% lived in Illinois.
| Paw Paw: | 92.7% |
| State average: | 88.3% |
Education attainment for males 25 years and older:
- No schooling: 0
- Nursery to 4th grade: 0
- 5th and 6th grade: 0
- 7th and 8th grade: 9
- 9th grade: 0
- 10th grade: 4
- 11th grade: 2
- 12th grade, no diploma: 7
- High school graduate (or equivalency): 158
- Less than 1 year of college: 30
- Some college more than 1 year, no degree: 108
- Associate degree: 24
- Bachelor's degree: 34
- Master's degree: 10
- Professional school degree: 0
- Doctorate degree: 0

Education attainment for females 25 years and older:
- No schooling: 0
- Nursery to 4th grade: 0
- 5th and 6th grade: 0
- 7th and 8th grade: 0
- 9th grade: 0
- 10th grade: 3
- 11th grade: 4
- 12th grade, no diploma: 2
- High school graduate (or equivalency): 86
- Less than 1 year of college: 42
- Some college more than 1 year, no degree: 76
- Associate degree: 37
- Bachelor's degree: 32
- Master's degree: 9
- Professional school degree: 0
- Doctorate degree: 0


Housing units in structures:
- One, detached: 356
- One, attached: 18
- Two: 18
- 3 or 4: 5
- 5 to 9: 45
Housing units lacking complete kitchen facilities in 2022: 5.0%
House/condo owner moved in on average 16 years ago
Renter moved in on average 2 years ago

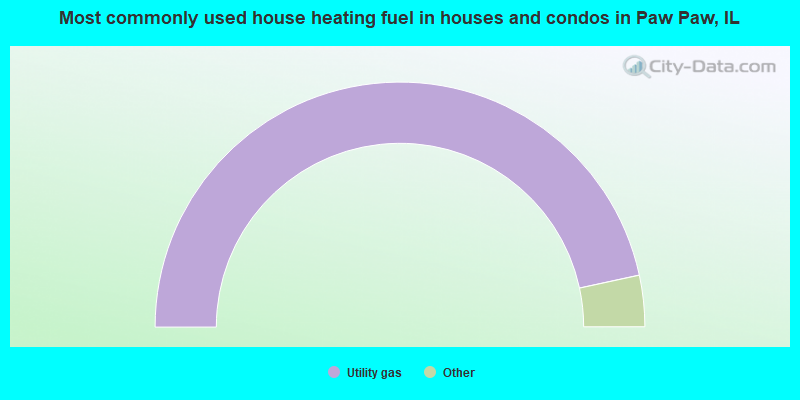
- 93.3%Utility gas
- 2.5%Electricity
- 2.1%Wood
- 1.4%Bottled, tank, or LP gas
- 0.7%No fuel used
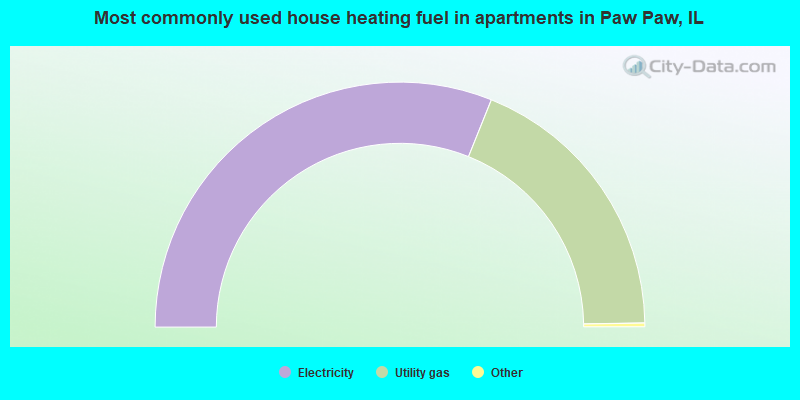
- 62.5%Electricity
- 37.5%Utility gas
Private vs. public school enrollment:
| Here: | 7.6% |
| Illinois: | 13.3% |
| Here: | 28.0% |
| Illinois: | 9.9% |
| Here: | 10.0% |
| Illinois: | 27.4% |


