Pattison, TX (Texas) Houses and Residents
| Pattison: | $350,499 |
| Texas: | $275,400 |
Mean price in 2022:
Detached houses: $365,984
Here: $365,984 State: $369,058 Mobile homes: $154,500
Here: $154,500 State: $124,413
Total population: 510 (Urban population: 0, Rural population: 425 (13 farm, 412 nonfarm))
Houses: 260 (239 occupied: 206 owner occupied, 36 renter occupied)
| % of renters here: | 15% |
| State: | 38% |
Housing density: 80 houses/condos per square mile
Median price asked for vacant for-sale houses and condos in 2022 in this county: $1,019,421.
Median gross rent in Pattison, TX in 2022: $-687,450,039
Housing units in Pattison with a mortgage: 111 (3 second mortgage, 0 home equity loan, 4 both second mortgage and home equity loan)
Houses without a mortgage: 0
Median household income for houses/condos with a mortgage: $160,949
Median household income for apartments without a mortgage: $64,477
Median monthly housing costs: $1,201
Compare current foreclosures near Pattison, TX:
| Photo | Address | Area | Beds / Baths | Price | Details |
|---|---|---|---|---|---|

|
#1
Brixham Dr
Cypress, TX 77433
|
1,740 sq. feet
|
2 baths 3 beds |
show details | |

|
#2
Smokey Hill Dr
Katy, TX 77450
|
1,576 sq. feet
|
2 baths 3 beds |
show details | |

|
#3
Boerne Creek Dr
Richmond, TX 77407
|
1,557 sq. feet
|
2 baths 3 beds |
show details | |

|
#4
Red Rocks Park Dr
Katy, TX 77494
|
3,351 sq. feet
|
3 baths 4 beds |
show details | |

|
#5
Elk Ridge Ln
Katy, TX 77494
|
2,523 sq. feet
|
2 baths 4 beds |
show details | |

|
#6
Hoppers Creek Dr
Katy, TX 77449
|
2,172 sq. feet
|
2 baths 3 beds |
show details | |

|
#7
Hamilton Crest Dr
Brookshire, TX 77423
|
2,501 sq. feet
|
2 baths 3 beds |
show details | |

|
#8
Mt Everest Way
Katy, TX 77449
|
3,128 sq. feet
|
3 baths 4 beds |
show details | |

|
#9
Shadow Mountain Dr
Katy, TX 77450
|
1,924 sq. feet
|
2 baths 4 beds |
show details | |

|
#10
Sedalia Brook Ln
Katy, TX 77494
|
3,978 sq. feet
|
3 baths 5 beds |
show details |
| Photo | Address | Area | Beds / Baths | Price | Details |
|---|---|---|---|---|---|

|
#11
Drennanburg Ct
Katy, TX 77449
|
2,056 sq. feet
|
3 baths 3 beds |
show details | |

|
#12
Hickory Meadow Ln
Houston, TX 77084
|
2,320 sq. feet
|
4 baths 4 beds |
show details | |

|
#13
Oak Rambling Dr
Katy, TX 77494
|
4,253 sq. feet
|
3 baths 4 beds |
show details | |

|
#14
S Creek Way
Fulshear, TX 77441
|
4,480 sq. feet
|
3 baths 4 beds |
show details | |

|
#15
Crested Butte Dr
Katy, TX 77494
|
- sq. feet
|
3 baths 4 beds |
show details | |

|
#16
Estes Ridge Ln
Katy, TX 77493
|
3,592 sq. feet
|
4 baths 4 beds |
show details | |

|
#17
Anthonia Ln
Richmond, TX 77406
|
10,290 sq. feet
|
7 baths 10 beds |
show details | |

|
#18
Sam Creek Ct
Katy, TX 77494
|
3,765 sq. feet
|
3 baths 4 beds |
show details | |

|
#19
Park Brook Dr
Katy, TX 77450
|
1,998 sq. feet
|
2 baths 4 beds |
show details | |

|
#20
Park York Dr
Katy, TX 77450
|
2,218 sq. feet
|
2 baths 4 beds |
show details |
| Photo | Address | Area | Beds / Baths | Price | Details |
|---|---|---|---|---|---|

|
#21
Park York Dr
Katy, TX 77450
|
2,266 sq. feet
|
2 baths 4 beds |
show details | |

|
#22
Park Brook Dr
Katy, TX 77450
|
1,653 sq. feet
|
2 baths 3 beds |
show details | |

|
#23
Crescent Cove Ct
Katy, TX 77494
|
4,094 sq. feet
|
3 baths 4 beds |
show details | |

|
#24
Pebble Garden Ln
Katy, TX 77449
|
2,782 sq. feet
|
2 baths 4 beds |
show details | |

|
#25
Sonoma Mission Ct
Katy, TX 77449
|
2,410 sq. feet
|
2 baths 4 beds |
show details | |

|
#26
Park Green Dr
Katy, TX 77450
|
1,568 sq. feet
|
2 baths 3 beds |
show details | |

|
#27
Live Oaks Spring Dr
Katy, TX 77450
|
1,804 sq. feet
|
2 baths 3 beds |
show details | |

|
#28
Oak Rain Ct
Katy, TX 77449
|
2,547 sq. feet
|
3 baths 4 beds |
show details | |

|
#29
Lauderwood Ln
Katy, TX 77449
|
1,873 sq. feet
|
2 baths 3 beds |
show details | |

|
#30
Bay Palms Dr
Katy, TX 77449
|
1,635 sq. feet
|
2 baths 3 beds |
show details |
| Photo | Address | Area | Beds / Baths | Price | Details |
|---|---|---|---|---|---|

|
#31
High Plains Dr
Katy, TX 77449
|
1,256 sq. feet
|
2 baths 3 beds |
show details | |

|
#32
W Waterlake Dr
Richmond, TX 77406
|
2,246 sq. feet
|
2 baths 4 beds |
show details | |

|
#33
Silver Cedar Trl
Katy, TX 77449
|
2,488 sq. feet
|
2 baths 4 beds |
show details | |

|
#34
Highland Knolls Dr
Katy, TX 77450
|
2,023 sq. feet
|
2 baths 3 beds |
show details | |

|
#35
Telegraph Square Ln
Katy, TX 77449
|
1,385 sq. feet
|
2 baths 3 beds |
show details | |

|
#36
N Waterlake Dr
Richmond, TX 77406
|
2,015 sq. feet
|
2 baths 3 beds |
show details | |

|
#37
Seablossom Ln
Katy, TX 77449
|
1,291 sq. feet
|
2 baths 3 beds |
show details | |

|
#38
Oakwell Ln
Katy, TX 77449
|
2,052 sq. feet
|
3 baths 4 beds |
show details | |

|
#39
Red Sun Dr
Katy, TX 77449
|
2,254 sq. feet
|
2 baths 4 beds |
show details | |

|
#40
Silver Cedar Trl
Katy, TX 77449
|
2,272 sq. feet
|
2 baths 4 beds |
show details |
| Photo | Address | Area | Beds / Baths | Price | Details |
|---|---|---|---|---|---|

|
#41
Manor Court Dr
Katy, TX 77449
|
1,732 sq. feet
|
2 baths 3 beds |
show details | |

|
#42
Tallow Grove Ln
Katy, TX 77450
|
3,212 sq. feet
|
2 baths 3 beds |
show details | |

|
#43
Winding Hollow Dr
Katy, TX 77450
|
2,878 sq. feet
|
3 baths 4 beds |
show details | |

|
#44
Silver Cypress Dr
Katy, TX 77449
|
1,204 sq. feet
|
2 baths 3 beds |
show details | |

|
#45
Hawkes Bay Ct
Katy, TX 77494
|
3,217 sq. feet
|
3 baths 4 beds |
show details | |

|
#46
Wildbrook Canyon Ct
Katy, TX 77449
|
2,884 sq. feet
|
2 baths 3 beds |
show details | |

|
#47
Hidden Chestnut Ln
Houston, TX 77084
|
1,840 sq. feet
|
2 baths 4 beds |
show details | |

|
#48
Lakearies Ln
Katy, TX 77449
|
2,682 sq. feet
|
2 baths 4 beds |
show details | |

|
#49
Elkana Deane Ln
Katy, TX 77449
|
1,302 sq. feet
|
2 baths 3 beds |
show details | |

|
Check over 1 million property listings on Foreclosure.com!
|
browse all offers | |||

Latest news about housing in Pattison, TX collected exclusively by city-data.com from local newspapers, TV, and radio stations

 | No gutters in Austin homes? (32 replies) |
| Bettter schools and district for kid on autism spectrum (7 replies) |
| What happened to plans for a Cane Island Elementary in Katy (20 replies) |
| new apartment in katy.. school overcrowded? (6 replies) |
| Two houses to choose (7 replies) |
| Best elementary schools in Katy? (8 replies) |

Median year apartment built: 1986
Household type by relationship:
Households: 671- Male householders: 123 (17 living alone), Female householders: 112 (9 living alone)
139 spouses (139 opposite-sex spouses), 30 unmarried partners, (30 opposite-sex unmarried partners), 203 children (199 natural, 4 adopted, 0 stepchildren), 42 grandchildren, 1 brothers or sisters, 4 parents, 0 foster children, 7 other relatives, 7 non-relatives
Size of family households: 105 2-persons, 82 3-persons, 13 4-persons, 3 5-persons, 4 6-persons, 4 7-or-more-persons.
Size of nonfamily households: 28 1-person, 3 2-persons.
30 married couples with children.
55 single-parent households (10 men, 45 women).
77.7% of residents of Pattison speak English at home.
19.4% of residents speak Spanish at home (64% speak English very well, 17% speak English well, 19% speak English not well).
2.4% of residents speak other Indo-European language at home (19% speak English very well, 81% speak English well).
Foreign born population: 66 (9.8%)
(71.2% of them are naturalized citizens)
| Here: | 6.4 |
| State: | 6.3 |
| Here: | 4.0 |
| State: | 4.0 |

- Bedrooms in owner-occupied houses and condos in Pattison, Texas
- 0no bedroom
- 81 bedroom
- 372 bedrooms
- 1383 bedrooms
- 224 bedrooms
- 05+ bedrooms

- Bedrooms in renter-occupied apartments in Pattison, Texas
- 0no bedroom
- 01 bedroom
- 192 bedrooms
- 183 bedrooms
- 04 bedrooms
- 05+ bedrooms

- Cars and other vehicles available in Pattison in owner-occupied houses/condos
- 0no vehicle
- 221 vehicle
- 902 vehicles
- 563 vehicles
- 274 vehicles
- 115+ vehicles

- Cars and other vehicles available in Pattison in renter-occupied apartments
- 0no vehicle
- 131 vehicle
- 132 vehicles
- 03 vehicles
- 04 vehicles
- 125+ vehicles

- Rooms in owner-occupied houses in Pattison, Texas
- 01 room
- 52 rooms
- 33 rooms
- 54 rooms
- 355 rooms
- 626 rooms
- 347 rooms
- 68 rooms
- 559+ rooms

- Rooms in renter-occupied apartments in Pattison, Texas
- 01 room
- 02 rooms
- 03 rooms
- 314 rooms
- 65 rooms
- 06 rooms
- 07 rooms
- 08 rooms
- 09+ rooms


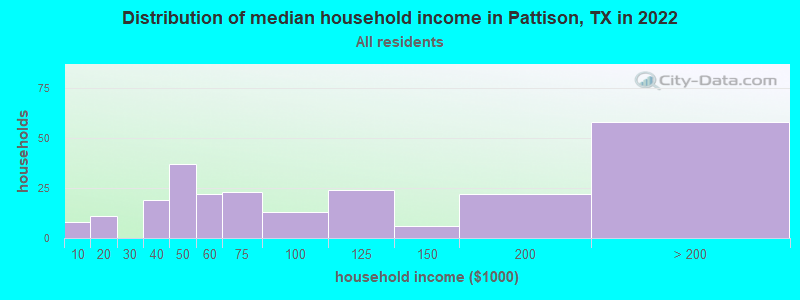
Pattison, TX household income distribution

- 8Less than $10,000
- 11$10,000 to $19,999
- 19$30,000 to $39,999
- 37$40,000 to $49,999
- 22$50,000 to $59,999
- 23$60,000 to $74,999
- 13$75,000 to $99,999
- 24$100,000 to $124,999
- 6$125,000 to $149,999
- 22$150,000 to $199,999
- 58$200,000 or more
Home value of owner - occupied houses in 2022 in Pattison, TX
-
- 3Less than $10,000
- 5$10,000 to $14,999
- 4$15,000 to $19,999
- 8$25,000 to $29,999
- 7$30,000 to $34,999
- 3$50,000 to $59,999
- 8$100,000 to $124,999
- 7$125,000 to $149,999
- 10$175,000 to $199,999
- 8$200,000 to $249,999
- 25$250,000 to $299,999
- 20$300,000 to $399,999
- 22$400,000 to $499,999
- 42$500,000 to $749,999
- 44$750,000 to $999,999
- 4$1,000,000 to $1,499,999

Rent paid by renters in 2022 in Pattison, TX
-
- 3$750 to $799
- 9$800 to $899
- 23No cash rent


Percentage of workers working in this county: 57.0%
Number of people working at home: 174 (40.8% of all workers)
Travel time to work (commute)
- Less than 5 minutes: 2
- 5 to 9 minutes: 5
- 10 to 14 minutes: 37
- 15 to 19 minutes: 16
- 20 to 24 minutes: 69
- 25 to 29 minutes: 0
- 30 to 34 minutes: 33
- 35 to 39 minutes: 22
- 40 to 44 minutes: 11
- 45 to 59 minutes: 80
- 60 to 89 minutes: 0
- 90 or more minutes: 1
Means of transportation to work:
- Drove a car alone: 140 (68.0%)
- Carpooled: 39 (18.9%)
- Bus or trolley bus: 4 (1.9%)
- Bicycle: 3 (1.5%)
- Walked: 9 (4.4%)
- Other means: 5 (2.4%)
- Worked at home: 6 (2.9%)

- Unemployment by race in 2022
- Unemployment rate for other race residents
- 21.2%Males
- Unemployment rate for two or more race residents
- 10.6%Females
- Unemployment rate for Hispanic or Latino residents
- 10.4%Males
- 3.9%Females

- Year of entry for the foreign-born population in Pattison, Texas
- 92010 or later
- 132000 to 2009
- 221990 to 1999
- 171980 to 1989
- 101970 to 1979
- 5Before 1970

First ancestries reported:
- German: 33 (8.5%)
- American: 21 (5.4%)
- European: 19 (4.9%)
- English: 14 (3.6%)
- Russian: 12 (3.1%)
- Italian: 5 (1.3%)
- Lithuanian: 5 (1.3%)
- Belgian: 1 (0.3%)
- Czech: 1 (0.3%)
Most common places of birth for foreign-born residents (%):
| Pattison: | 51.5% (34) |
| Texas: | 48.4% (2,411,723) |
| Pattison: | 21.2% (14) |
| Texas: | 0.3% (16,984) |
| Pattison: | 6.1% (4) |
| Texas: | 1.2% (60,172) |
| Pattison: | 6.1% (4) |
| Texas: | 0.3% (13,034) |
| Pattison: | 4.5% (3) |
| Texas: | 0.8% (37,989) |
| Pattison: | 4.5% (3) |
| Texas: | 0.1% (2,774) |
Place of birth for U.S.-born residents:
- This state: 475
- Other state: 117
- Northeast: 20
- Midwest: 16
- South: 54
- West: 25
97.6% of Pattison residents lived in the same house 1 years ago.
Out of people who lived in different houses, 10.5% lived in this county.
Out of people who lived in different counties, 100.0% lived in Texas.
| Pattison: | 97.6% |
| State average: | 85.7% |
Education attainment for males 25 years and older:
- No schooling: 3
- Nursery to 4th grade: 0
- 5th and 6th grade: 7
- 7th and 8th grade: 0
- 9th grade: 7
- 10th grade: 7
- 11th grade: 4
- 12th grade, no diploma: 0
- High school graduate (or equivalency): 39
- Less than 1 year of college: 5
- Some college more than 1 year, no degree: 32
- Associate degree: 11
- Bachelor's degree: 56
- Master's degree: 2
- Professional school degree: 0
- Doctorate degree: 18

Education attainment for females 25 years and older:
- No schooling: 0
- Nursery to 4th grade: 8
- 5th and 6th grade: 0
- 7th and 8th grade: 0
- 9th grade: 0
- 10th grade: 0
- 11th grade: 0
- 12th grade, no diploma: 2
- High school graduate (or equivalency): 54
- Less than 1 year of college: 5
- Some college more than 1 year, no degree: 31
- Associate degree: 5
- Bachelor's degree: 167
- Master's degree: 25
- Professional school degree: 0
- Doctorate degree: 0


Housing units in structures:
- One, detached: 207
- One, attached: 3
- Mobile homes: 49
House/condo owner moved in on average 9 years ago
Renter moved in on average 7 years ago

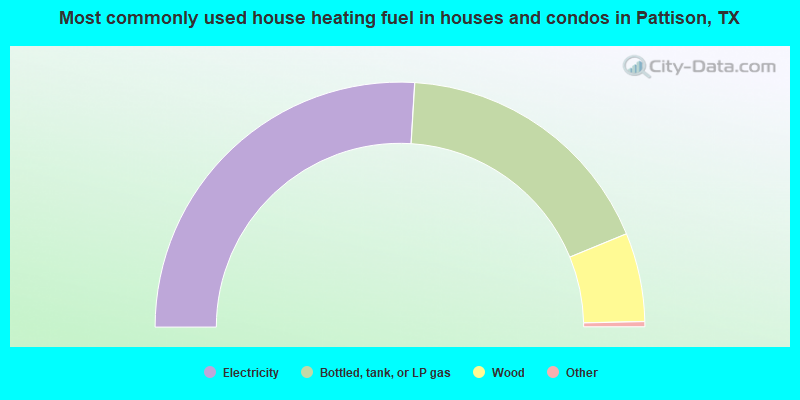
- 52.3%Electricity
- 35.9%Bottled, tank, or LP gas
- 11.8%Wood
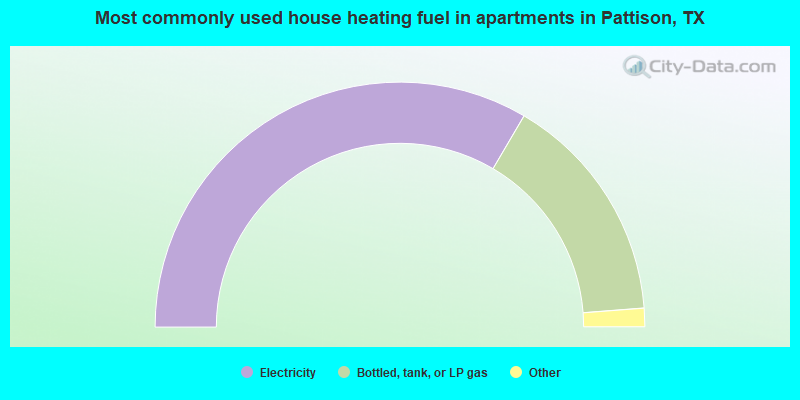
- 68.6%Electricity
- 31.4%Bottled, tank, or LP gas
Private vs. public school enrollment:
| Here: | 0.0% |
| Texas: | 8.8% |
| Here: | 15.3% |
| Texas: | 8.0% |
| Here: | 0.0% |
| Texas: | 16.2% |


