Passaic, NJ (New Jersey) Houses and Residents
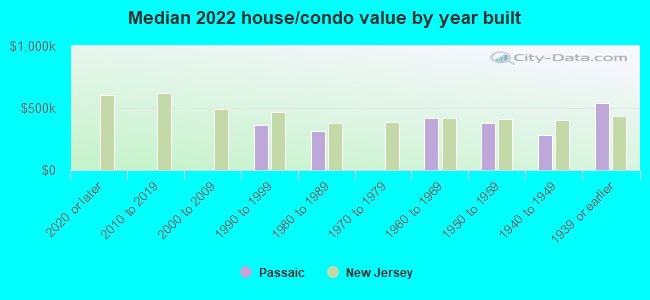
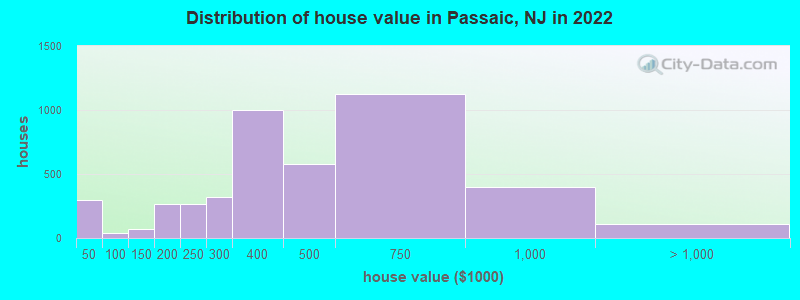
Estimated median house or condo value in 2022: $419,800 (it was $156,600 in 2000 )
Passaic:
$419,800New Jersey:
$428,900
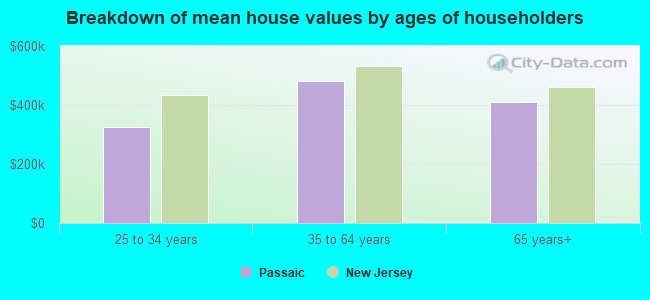
Lower value quartile - upper value quartile: $265,700 - $620,300Mean price in 2022: Detached houses: $538,970 Here:
$538,970State:
$537,591
Townhouses or other attached units: $379,236 Here:
$379,236State:
$381,113
In 2-unit structures: $393,837 Here:
$393,837State:
$444,476
In 3-to-4-unit structures: $439,407 Here:
$439,407State:
$457,463
In 5-or-more-unit structures: $231,230 Here:
$231,230State:
$368,745
Mobile homes: $338,065 Here:
$338,065State:
$119,788
Total population: 71,509 (Urban population: 67,861, Rural population: 0)
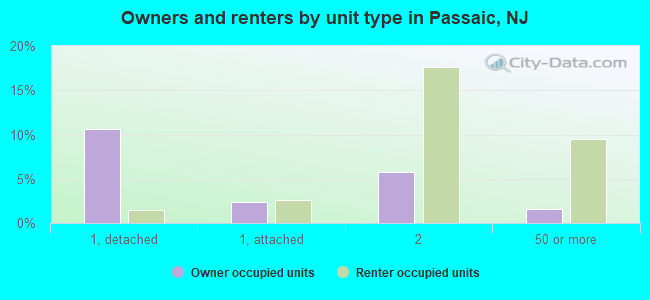
Houses: 20,613 (20,280 occupied: 4,403 owner occupied, 15,877 renter occupied )
% of renters here:
78%State:
35%
Housing density: 6,623 houses/condos per square mile
Median price asked for vacant for-sale houses and condos in 2022: $1,839,419.
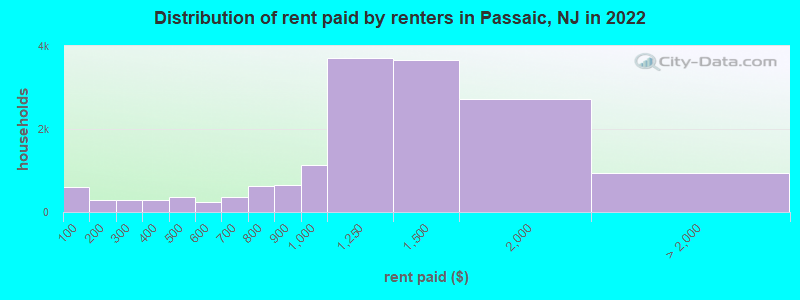
Median contract rent in 2022: $1,203 (lower quartile is $920, upper quartile is $1,471)
Median rent asked for vacant for-rent units in 2022: $1,977
Median gross rent in Passaic, NJ in 2022: $1,316
Housing units in Passaic with a mortgage: 3,049 (227 second mortgage, 0 home equity loan, 217 both second mortgage and home equity loan )Houses without a mortgage: 26
Median household income for houses/condos with a mortgage: $148,036
Median household income for apartments without a mortgage: $51,478
Median monthly housing costs: $1,399
Data:
Median house or condo value ($)
Median house or condo value ($ change since 2000)
Median house or condo value ($) - White
Median house or condo value ($) - Black or African American
Median house or condo value ($) - Asian
Median house or condo value ($) - Hispanic or Latino
Median house or condo value ($) - American Indian and Alaska Native
Median house or condo value ($) - Multirace
Median house or condo value ($) - Other Race
Median price asked for mobile homes ($)
Household density (households per square mile)
Mean house or condo value by units in structure - 1, detached ($)
Mean house or condo value by units in structure - 1, attached ($)
Mean house or condo value by units in structure - 2 ($)
Mean house or condo value by units in structure by units in structure - 3 or 4 ($)
Mean house or condo value by units in structure - 5 or more ($)
Mean house or condo value by units in structure - Boat, RV, van, etc. ($)
Mean house or condo value by units in structure - Mobile home ($)
Median contract rent ($)
Median contract rent - Lower quartile ($)
Median contract rent - Upper quartile ($)
Median gross rent ($)
Urban houses (%)
Rural houses (%)
Houses occupied (%)
Houses occupied (% change since 2000)
Houses owner occupied (%)
Houses owner occupied (% change since 2000)
Houses renter occupied (%)
Houses renter occupied (% change since 2000)
Vacant housing units - For rent (%)
Vacant housing units - For rent (% change since 2000)
Vacant housing units - For sale only (%)
Vacant housing units - For sale only (% change since 2000)
Vacant housing units - Rented or sold, not occupied (%)
Vacant housing units - Rented or sold, not occupied (% change since 2000)
Vacant housing units - For seasonal, recreational, or occasional use (%)
Vacant housing units - For seasonal, recreational, or occasional use (% change since 2000)
Vacant housing units - For migrant workers (%)
Vacant housing units - For migrant workers (% change since 2000)
Vacant housing units - Other vacant (%)
Vacant housing units - Other vacant (% change since 2000)
Median monthly housing costs ($)
Median household income for houses/condos with a mortgage ($)
Median household income for houses/condos without a mortgage ($)
Median household income ($)
Median household income ($) - White
Median household income ($) - Black or African American
Median household income ($) - Asian
Median household income ($) - Hispanic or Latino
Median household income ($) - American Indian and Alaska Native
Median household income ($) - Multirace
Median household income ($) - Other Race
Mortgage status - with mortgage (%)
Mortgage status - with second mortgage (%)
Mortgage status - with home equity loan (%)
Mortgage status - with both second mortgage and home equity loan (%)
Mortgage status - without a mortgage (%)
Median year house/condo built
Median year apartment built
Household type by relationship - Male householder living alone (%)
Household type by relationship - Male householder not living alone (%)
Household type by relationship - Female householder living alone (%)
Household type by relationship - Female householder not living alone (%)
Household type by relationship - Opposite-Sex spouse (%)
Household type by relationship - Same-Sex spouse (%)
Household type by relationship - Opposite-Sex unmarried partner (%)
Household type by relationship - Same-Sex unmarried partner (%)
Household type by relationship - In group quarters (%)
Size of family households - 2-person household (%)
Size of family households - 3-person household (%)
Size of family households - 4-person household (%)
Size of family households - 5-person household (%)
Size of family households - 6-person household (%)
Size of family households - 7-or-more-person household (%)
Size of nonfamily households - 1-person household (%)
Size of nonfamily households - 2-person household (%)
Size of nonfamily households - 3-person household (%)
Size of nonfamily households - 4-person household (%)
Size of nonfamily households - 5-person household (%)
Size of nonfamily households - 6-person household (%)
Size of nonfamily households - 7-or-moreperson household (%)
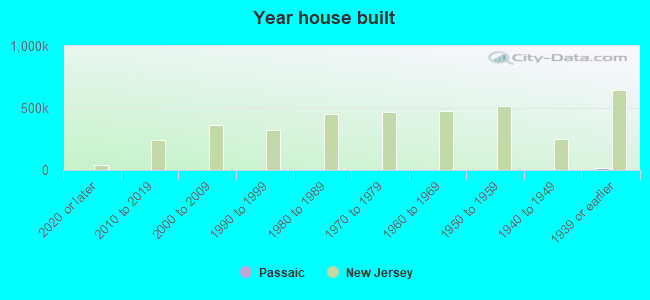
Year house built - Built 2010 or later (%)
Year house built - Built 2000 to 2009 (%)
Year house built - Built 1990 to 1999 (%)
Year house built - Built 1980 to 1989 (%)
Year house built - Built 1970 to 1979 (%)
Year house built - Built 1960 to 1969 (%)
Year house built - Built 1950 to 1959 (%)
Year house built - Built 1940 to 1949 (%)
Year house built - Built 1939 or earlier (%)
Median number of rooms in houses and condos
Median number of rooms in apartments
Median number of bedrooms in owner occupied houses
Mean number of bedrooms in owner occupied houses
Median number of bedrooms in renter occupied houses
Mean number of bedrooms in renter occupied houses
Median number of vehichles in owner occupied houses
Mean number of vehichles in owner occupied houses
Median number of vehichles in renter occupied houses
Mean number of vehichles in renter occupied houses
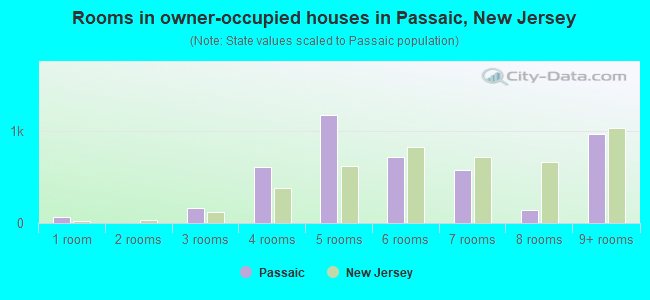
Rooms in owner-occupied houses - 1 room (%)
Rooms in owner-occupied houses - 2 rooms (%)
Rooms in owner-occupied houses - 3 rooms (%)
Rooms in owner-occupied houses - 4 rooms (%)
Rooms in owner-occupied houses - 5 rooms (%)
Rooms in owner-occupied houses - 6 rooms (%)
Rooms in owner-occupied houses - 7 rooms (%)
Rooms in owner-occupied houses - 8 rooms (%)
Rooms in owner-occupied houses - 9+ rooms (%)
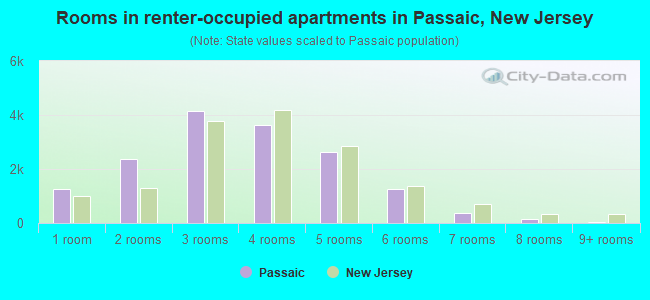
Rooms in renter-occupied houses - 1 room (%)
Rooms in renter-occupied houses - 2 rooms (%)
Rooms in renter-occupied houses - 3 rooms (%)
Rooms in renter-occupied houses - 4 rooms (%)
Rooms in renter-occupied houses - 5 rooms (%)
Rooms in renter-occupied houses - 6 rooms (%)
Rooms in renter-occupied houses - 7 rooms (%)
Rooms in renter-occupied houses - 8 rooms (%)
Rooms in renter-occupied houses - 9+ rooms (%)
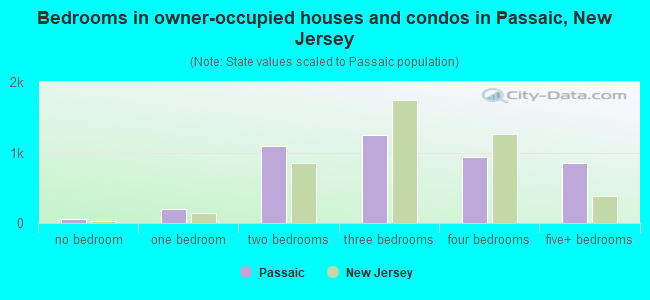
Bedrooms in owner-occupied houses - no bedrooms (%)
Bedrooms in owner-occupied houses - 1 bedroom (%)
Bedrooms in owner-occupied houses - 2 bedrooms (%)
Bedrooms in owner-occupied houses - 3 bedrooms (%)
Bedrooms in owner-occupied houses - 4 bedrooms (%)
Bedrooms in owner-occupied houses - 5+ bedrooms (%)
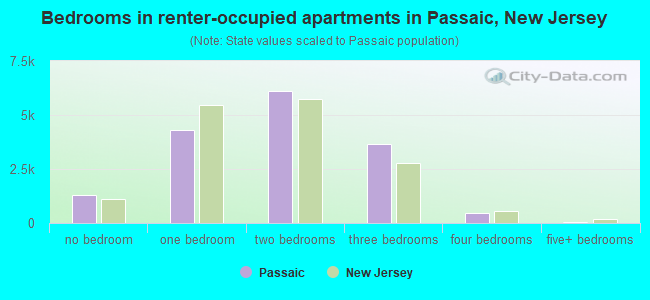
Bedrooms in renter-occupied houses - no bedrooms (%)
Bedrooms in renter-occupied houses - 1 bedroom (%)
Bedrooms in renter-occupied houses - 2 bedrooms (%)
Bedrooms in renter-occupied houses - 3 bedrooms (%)
Bedrooms in renter-occupied houses - 4 bedrooms (%)
Bedrooms in renter-occupied houses - 5+ bedrooms (%)
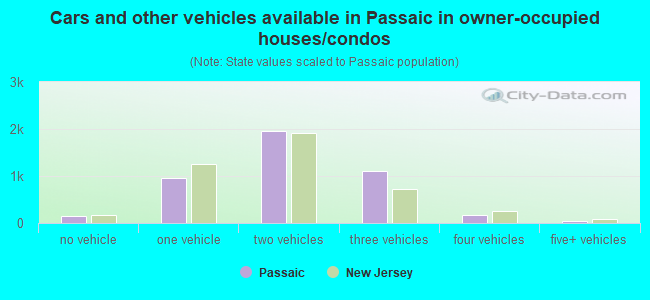
Vehicles available in owner-occupied houses - no vehicle available (%)
Vehicles available in owner-occupied houses - 1 vehicle available(%)
Vehicles available in owner-occupied houses - 2 Vehicles available (%)
Vehicles available in owner-occupied houses - 3 Vehicles available (%)
Vehicles available in owner-occupied houses - 4 Vehicles available (%)
Vehicles available in owner-occupied houses - 5+ Vehicles available (%)
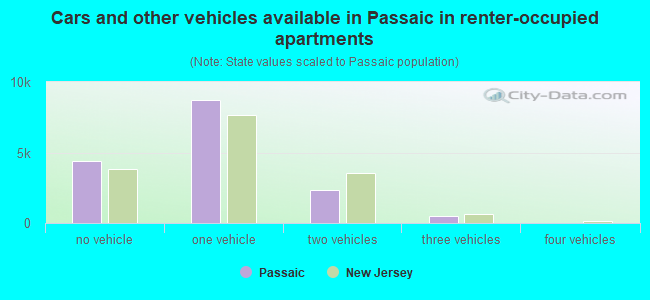
Vehicles available in renter-occupied houses - no vehicle available (%)
Vehicles available in renter-occupied houses - 1 vehicle available (%)
Vehicles available in renter-occupied houses - 2 Vehicles available (%)
Vehicles available in renter-occupied houses - 3 Vehicles available (%)
Vehicles available in renter-occupied houses - 4 Vehicles available (%)
Vehicles available in renter-occupied houses - 5+ Vehicles available (%)
Housing units in structures - 1, detached (%)
Housing units in structures - 1, attached (%)
Housing units in structures - 2 (%)
Housing units in structures - 3 or 4 (%)
Housing units in structures - 5 to 9 (%)
Housing units in structures - 10 to 19 (%)
Housing units in structures - 20 to 49 (%)
Housing units in structures - 50 or more (%)
Housing units in structures - Mobile home (%)
Housing units in structures - Boat, RV, van, etc. (%)
Housing units in structures - Owners - 1, detached (%)
Housing units in structures - Owners - 1, attached (%)
Housing units in structures - Owners - 2 (%)
Housing units in structures - Owners - 3 or 4 (%)
Housing units in structures - Owners - 5 to 9 (%)
Housing units in structures - Owners - 10 to 19 (%)
Housing units in structures - Owners - 20 to 49 (%)
Housing units in structures - Owners - 50 or more (%)
Housing units in structures - Owners - Mobile home (%)
Housing units in structures - Owners - Boat, RV, van, etc. (%)
Housing units in structures - Renters - 1, detached (%)
Housing units in structures - Renters - 1, attached (%)
Housing units in structures - Renters - 2 (%)
Housing units in structures - Renters - 3 or 4 (%)
Housing units in structures - Renters - 5 to 9 (%)
Housing units in structures - Renters - 10 to 19 (%)
Housing units in structures - Renters - 20 to 49 (%)
Housing units in structures - Renters - 50 or more (%)
Housing units in structures - Renters - Mobile home (%)
Housing units in structures - Renters - Boat, RV, van, etc. (%)
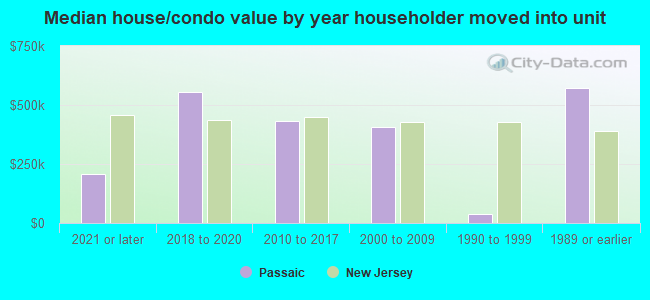
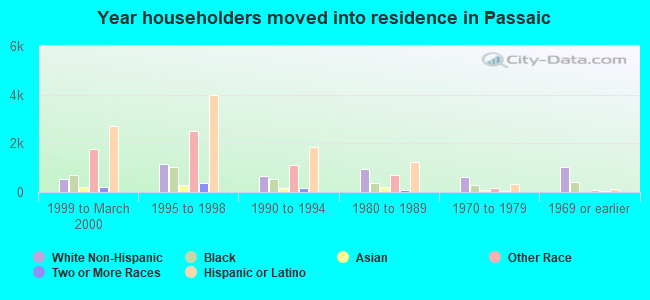
House/condo owner moved in on average (years ago)
Renter moved in on average (years ago)
Year householder moved into unit - Moved in 1999 to March 2000 (%)
Year householder moved into unit - Moved in 1999 to March 2000 (%) - White
Year householder moved into unit - Moved in 1999 to March 2000 (%) - Black or African American
Year householder moved into unit - Moved in 1999 to March 2000 (%) - Asian
Year householder moved into unit - Moved in 1999 to March 2000 (%) - Hispanic or Latino
Year householder moved into unit - Moved in 1999 to March 2000 (%) - American Indian and Alaska Native
Year householder moved into unit - Moved in 1999 to March 2000 (%) - Multirace
Year householder moved into unit - Moved in 1999 to March 2000 (%) - Other Race
Year householder moved into unit - Moved in 1995 to 1998 (%)
Year householder moved into unit - Moved in 1995 to 1998 (%) - White
Year householder moved into unit - Moved in 1995 to 1998 (%) - Black or African American
Year householder moved into unit - Moved in 1995 to 1998 (%) - Asian
Year householder moved into unit - Moved in 1995 to 1998 (%) - Hispanic or Latino
Year householder moved into unit - Moved in 1995 to 1998 (%) - American Indian and Alaska Native
Year householder moved into unit - Moved in 1995 to 1998 (%) - Multirace
Year householder moved into unit - Moved in 1995 to 1998 (%) - Other Race
Year householder moved into unit - Moved in 1990 to 1994 (%)
Year householder moved into unit - Moved in 1990 to 1994 (%) - White
Year householder moved into unit - Moved in 1990 to 1994 (%) - Black or African American
Year householder moved into unit - Moved in 1990 to 1994 (%) - Asian
Year householder moved into unit - Moved in 1990 to 1994 (%) - Hispanic or Latino
Year householder moved into unit - Moved in 1990 to 1994 (%) - American Indian and Alaska Native
Year householder moved into unit - Moved in 1990 to 1994 (%) - Multirace
Year householder moved into unit - Moved in 1990 to 1994 (%) - Other Race
Year householder moved into unit - Moved in 1980 to 1989 (%)
Year householder moved into unit - Moved in 1980 to 1989 (%) - White
Year householder moved into unit - Moved in 1980 to 1989 (%) - Black or African American
Year householder moved into unit - Moved in 1980 to 1989 (%) - Asian
Year householder moved into unit - Moved in 1980 to 1989 (%) - Hispanic or Latino
Year householder moved into unit - Moved in 1980 to 1989 (%) - American Indian and Alaska Native
Year householder moved into unit - Moved in 1980 to 1989 (%) - Multirace
Year householder moved into unit - Moved in 1980 to 1989 (%) - Other Race
Year householder moved into unit - Moved in 1970 to 1979 (%)
Year householder moved into unit - Moved in 1970 to 1979 (%) - White
Year householder moved into unit - Moved in 1970 to 1979 (%) - Black or African American
Year householder moved into unit - Moved in 1970 to 1979 (%) - Asian
Year householder moved into unit - Moved in 1970 to 1979 (%) - Hispanic or Latino
Year householder moved into unit - Moved in 1970 to 1979 (%) - American Indian and Alaska Native
Year householder moved into unit - Moved in 1970 to 1979 (%) - Multirace
Year householder moved into unit - Moved in 1970 to 1979 (%) - Other Race
Year householder moved into unit - Moved in 1969 or earlier (%)
Year householder moved into unit - Moved in 1969 or earlier (%) - White
Year householder moved into unit - Moved in 1969 or earlier (%) - Black or African American
Year householder moved into unit - Moved in 1969 or earlier (%) - Asian
Year householder moved into unit - Moved in 1969 or earlier (%) - Hispanic or Latino
Year householder moved into unit - Moved in 1969 or earlier (%) - American Indian and Alaska Native
Year householder moved into unit - Moved in 1969 or earlier (%) - Multirace
Year householder moved into unit - Moved in 1969 or earlier (%) - Other Race
Housing units lacking complete plumbing facilities (%)
Housing units lacking complete kitchen facilities (%)
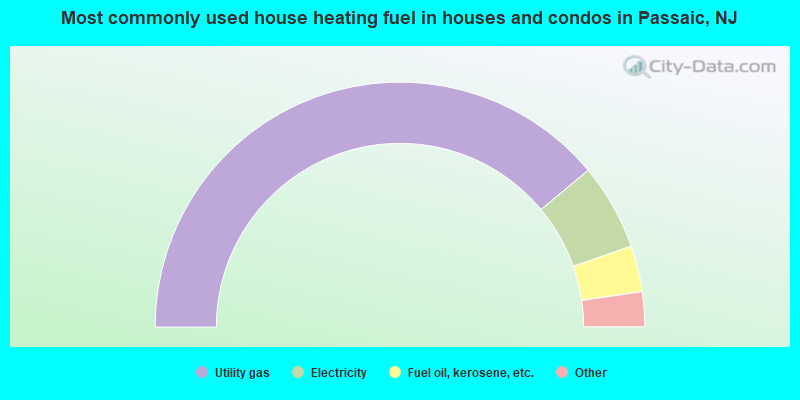
House heating fuel used in houses and condos - Utility gas (%)
House heating fuel used in houses and condos - Bottled, tank, or LP gas (%)
House heating fuel used in houses and condos - Electricity (%)
House heating fuel used in houses and condos - Fuel oil, kerosene, etc. (%)
House heating fuel used in houses and condos - Coal or coke (%)
House heating fuel used in houses and condos - Wood (%)
House heating fuel used in houses and condos - Solar energy (%)
House heating fuel used in houses and condos - Other fuel (%)
House heating fuel used in houses and condos - No fuel used (%)
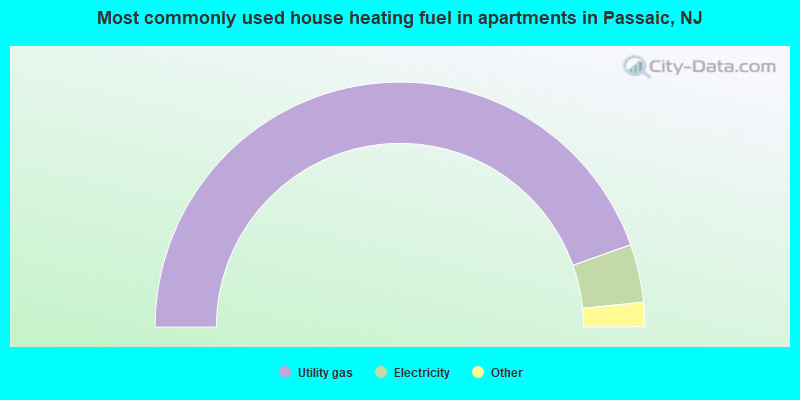
House heating fuel used in apartments - Utility gas (%)
House heating fuel used in apartments - Bottled, tank, or LP gas (%)
House heating fuel used in apartments - Electricity (%)
House heating fuel used in apartments - Fuel oil, kerosene, etc. (%)
House heating fuel used in apartments - Coal or coke (%)
House heating fuel used in apartments - Wood (%)
House heating fuel used in apartments - Solar energy (%)
House heating fuel used in apartments - Other fuel (%)
House heating fuel used in apartments - No fuel used (%)
Latest news about housing in Passaic, NJ collected exclusively by city-data.com from local newspapers, TV, and radio stations
Median year house/condo built: 1943Median year apartment built: 1938Household type by relationship:
Households: 69,121
Male householders: 8,070 (1,773 living alone ), Female householders: 12,210 (3,003 living alone )7,038 spouses (6,956 opposite-sex spouses ), 2,745 unmarried partners , (2,745 opposite-sex unmarried partners ), 26,991 children (26,548 natural , 0 adopted , 443 stepchildren ), 2,580 grandchildren , 2,133 brothers or sisters , 2,223 parents , 0 foster children , 2,889 other relatives , 1,762 non-relatives In group quarters: 480
Size of family households: 3,751 2-persons , 3,589 3-persons , 3,122 4-persons , 1,651 5-persons , 1,366 6-persons , 1,516 7-or-more-persons .
Size of nonfamily households: 4,776 1-person , 356 2-persons , 153 3-persons .
7,929 married couples with children. single-parent households (786 men , 7,386 women ).
26.5% of residents of Passaic speak English at home. of residents speak Spanish at home (47% speak English very well , 13% speak English well , 16% speak English not well , 24% don't speak English at all ).of residents speak other Indo-European language at home (47% speak English very well , 26% speak English well , 17% speak English not well , 10% don't speak English at all ).of residents speak Asian or Pacific Island language at home (81% speak English very well , 15% speak English well , 3% speak English not well , 2% don't speak English at all ).of residents speak other language at home (86% speak English very well , 13% speak English well , 1% speak English not well ).
Foreign born population: 31,384 (45.4%)of them are naturalized citizens )
Median number of rooms in houses and condos:
Median number of rooms in apartments
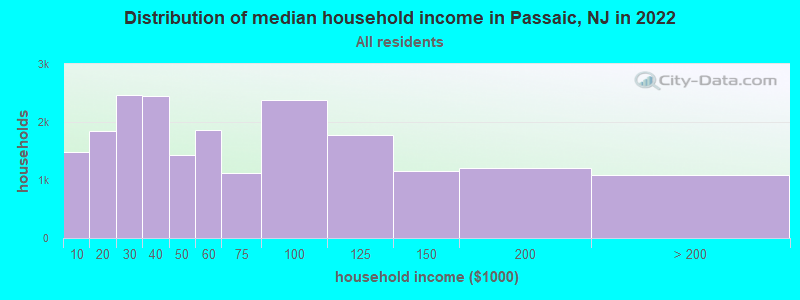
Passaic, NJ household income distribution 1,490 Less than $10,0001,845 $10,000 to $19,9992,464 $20,000 to $29,9992,456 $30,000 to $39,9991,434 $40,000 to $49,9991,860 $50,000 to $59,9991,119 $60,000 to $74,9992,379 $75,000 to $99,9991,770 $100,000 to $124,9991,157 $125,000 to $149,9991,214 $150,000 to $199,9991,092 $200,000 or more
Home value of owner - occupied houses in 2022 in Passaic, NJ 191 Less than $10,00022 $20,000 to $24,99933 $25,000 to $29,99938 $35,000 to $39,9998 $40,000 to $49,9995 $50,000 to $59,9992 $60,000 to $69,99919 $70,000 to $79,9992 $90,000 to $99,99936 $100,000 to $124,99931 $125,000 to $149,999161 $150,000 to $174,999106 $175,000 to $199,999267 $200,000 to $249,999322 $250,000 to $299,9991,002 $300,000 to $399,999581 $400,000 to $499,9991,127 $500,000 to $749,999396 $750,000 to $999,99956 $1,000,000 to $1,499,99918 $1,500,000 to $1,999,99937 $2,000,000 or moreRent paid by renters in 2022 in Passaic, NJ 607 Less than $100292 $150 to $199106 $200 to $249180 $250 to $299227 $300 to $34968 $350 to $39981 $400 to $449272 $450 to $499236 $500 to $549124 $600 to $649238 $650 to $69966 $700 to $749557 $750 to $799652 $800 to $8991,144 $900 to $9993,722 $1,000 to $1,2493,658 $1,250 to $1,4992,711 $1,500 to $1,999387 $2,000 to $2,499329 $2,500 to $2,99979 $3,500 or more141 No cash rent
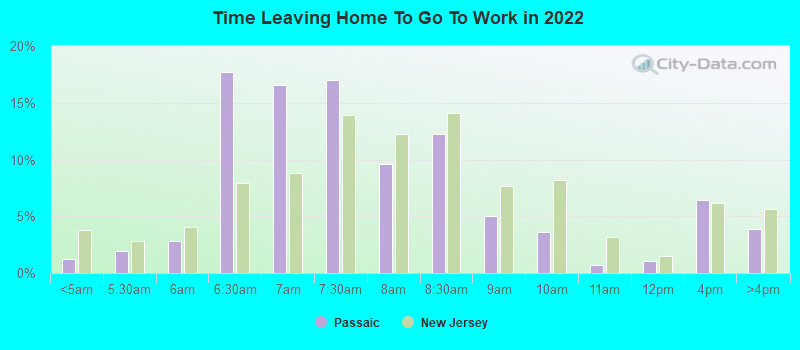
Percentage of workers working in this county: 55.2%Number of people working at home: 2,443 (7.7% of all workers )
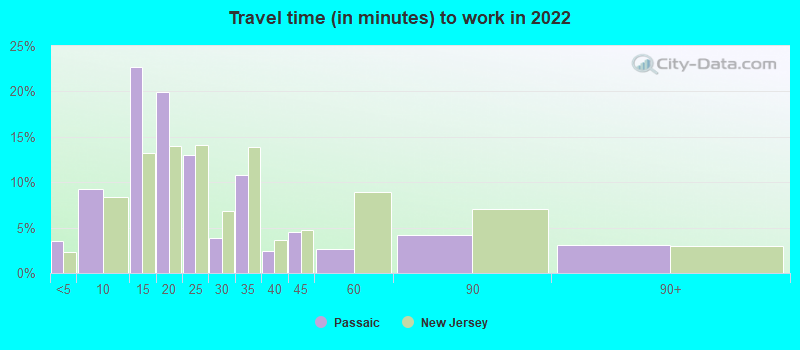
Travel time to work (commute)
Less than 5 minutes: 5585 to 9 minutes: 1,69710 to 14 minutes: 5,62515 to 19 minutes: 4,58720 to 24 minutes: 5,13425 to 29 minutes: 2,58230 to 34 minutes: 3,88135 to 39 minutes: 72540 to 44 minutes: 1,15245 to 59 minutes: 1,69260 to 89 minutes: 1,27990 or more minutes: 405
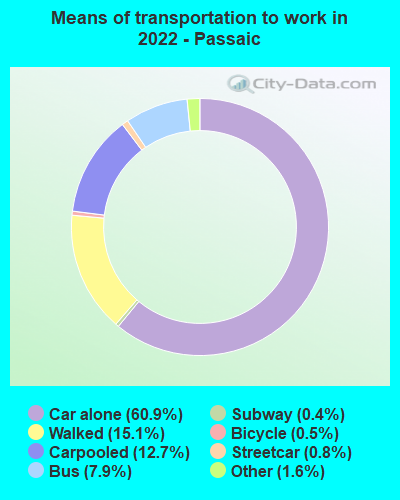
Means of transportation to work:
Drove a car alone: 11,294 (51.9%)Carpooled: 2,485 (11.4%)Bus : 1,778 (8.2%)Subway or elevated rail : 131 (0.6%)Long-distance train or commuter rail : 81 (0.4%)Light rail, streetcar or trolley : 8 (0.0%)Taxi: 333 (1.5%)Bicycle: 100 (0.5%)Walked: 3,404 (15.6%)Worked at home: 2,575 (11.8%)
Unemployment by race in 2022
Unemployment rate for White non-Hispanic residents 8.6% Males2.1% FemalesUnemployment rate for Black residents 21.8% Males18.7% FemalesUnemployment rate for American Indian and Alaska Native residents 2.6% Males7.6% FemalesUnemployment rate for Asian residents 5.4% Males0.4% FemalesUnemployment rate for other race residents 8.4% Males3.4% FemalesUnemployment rate for two or more race residents 4.6% Males12.1% FemalesUnemployment rate for Hispanic or Latino residents 4.7% Males9.9% Females
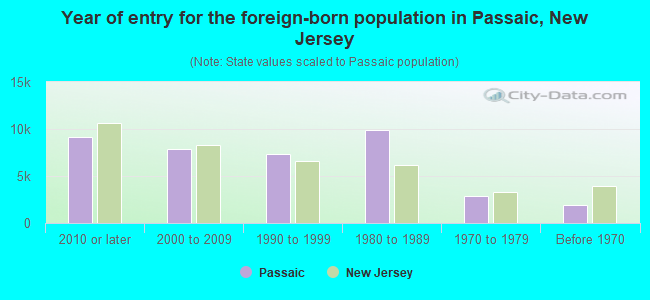
Year of entry for the foreign-born population in Passaic, New Jersey
9,110 2010 or later 7,828 2000 to 2009 7,357 1990 to 1999 9,851 1980 to 1989 2,859 1970 to 1979 1,879 Before 1970
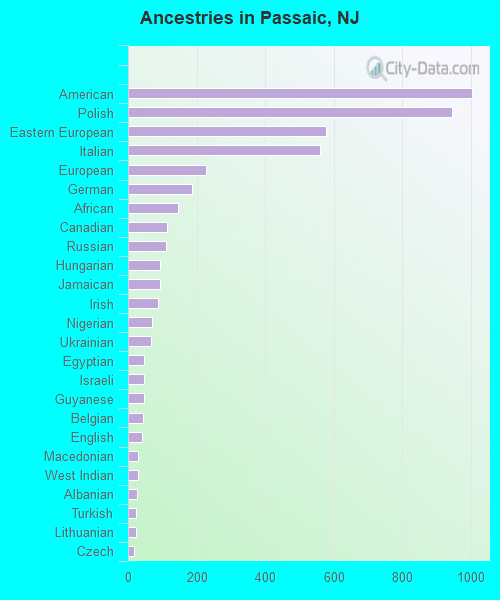
First ancestries reported:
American: 1,003 (1.8%)
Polish: 945 (1.7%)
Eastern European: 577 (1.1%)
Italian: 561 (1.0%)
European: 229 (0.4%)
German: 188 (0.3%)
African: 146 (0.3%)
Canadian: 113 (0.2%)
Russian: 112 (0.2%)
Hungarian: 92 (0.2%)
Jamaican: 92 (0.2%)
Irish: 88 (0.2%)
Nigerian: 70 (0.1%)
Ukrainian: 67 (0.1%)
Egyptian: 48 (0.09%)
Israeli: 48 (0.09%)
Guyanese: 48 (0.09%)
Belgian: 44 (0.08%)
English: 40 (0.07%)
Macedonian: 30 (0.05%)
West Indian: 29 (0.05%)
Albanian: 25 (0.05%)
Turkish: 23 (0.04%)
Lithuanian: 22 (0.04%)
Czech: 17 (0.03%)
Austrian: 17 (0.03%)
Haitian: 17 (0.03%)
Romanian: 16 (0.03%)
Trinidadian and Tobagonian: 15 (0.03%)
Scotch-Irish: 11 (0.02%)
French Canadian: 10 (0.02%)
Moroccan: 8 (0.01%)
Yugoslavian: 7 (0.01%)
British: 6 (0.01%)
Syrian: 5 (0.01%)
Greek: 4 (0.01%) Most common places of birth for foreign-born residents (%): Dominican Republic Passaic:
38.1% (11,475)New Jersey:
9.7% (209,055)
Mexico Passaic:
35.5% (10,670)New Jersey:
4.8% (102,527)
Peru Passaic:
5.1% (1,531)New Jersey:
2.7% (58,563)
India Passaic:
4.9% (1,461)New Jersey:
12.8% (274,609)
Colombia Passaic:
2.9% (861)New Jersey:
4.2% (90,817)
Guatemala Passaic:
2.3% (681)New Jersey:
2.2% (46,813)
Ecuador Passaic:
1.8% (545)New Jersey:
4.4% (95,275)
Place of birth for U.S.-born residents:
This state: 28,824Other state: 6,822Northeast: 3,737Midwest: 550South: 2,347West: 188 94.5% of Passaic residents lived in the same house 1 years ago.
Out of people who lived in different houses, 43.3% lived in this county.
Out of people who lived in different counties, 58.0% lived in New Jersey.
Passaic:
94.5%State average:
90.4%
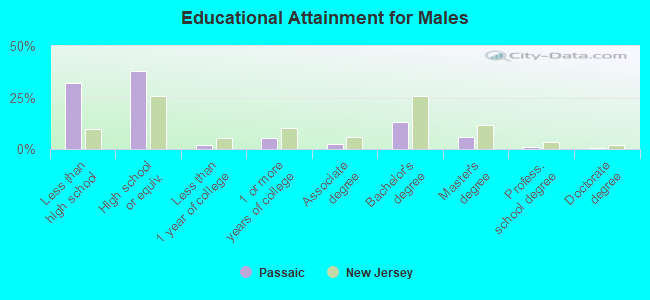
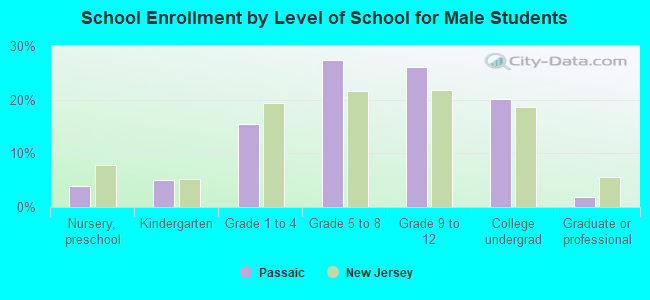
Education attainment for males 25 years and older:
No schooling: 505Nursery to 4th grade: 3925th and 6th grade: 1,1627th and 8th grade: 1,5669th grade: 1,15110th grade: 64811th grade: 25712th grade, no diploma: 524High school graduate (or equivalency): 7,371Less than 1 year of college: 360Some college more than 1 year, no degree: 1,082Associate degree: 446Bachelor's degree: 2,576Master's degree: 1,120Professional school degree: 151Doctorate degree: 141
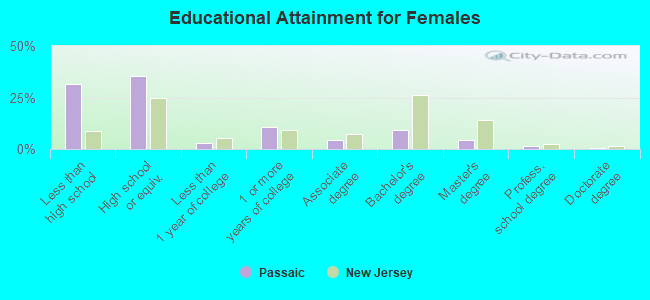
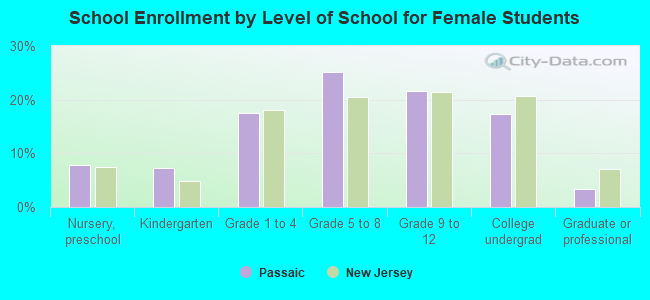
Education attainment for females 25 years and older:
No schooling: 623Nursery to 4th grade: 7825th and 6th grade: 1,2697th and 8th grade: 9159th grade: 84110th grade: 89211th grade: 87012th grade, no diploma: 503High school graduate (or equivalency): 7,488Less than 1 year of college: 625Some college more than 1 year, no degree: 2,276Associate degree: 894Bachelor's degree: 1,973Master's degree: 957Professional school degree: 300Doctorate degree: 53
Housing units in structures:
One, detached: 2,436One, attached: 1,133Two: 5,1653 or 4: 2,9665 to 9: 3,52710 to 19: 1,82120 to 49: 1,27850 or more: 2,287Housing units lacking complete kitchen facilities in 2022: 2.8%House/condo owner moved in on average 17 years ago
Renter moved in on average 6 years ago
Private vs. public school enrollment:
Students in private schools in grades 1 to 8 (elementary and middle school): 1,415 Here:
15.4%New Jersey:
12.3%
Students in private schools in grades 9 to 12 (high school): 749 Here:
14.7%New Jersey:
13.1%
Students in private undergraduate colleges: 266 Here:
6.6%New Jersey:
33.2%