Parris Island, SC (South Carolina) Houses and Residents
| Parris Island: | $111,322 |
| South Carolina: | $254,600 |
Total population: 5,867 (Urban population: 4,841 (all inside urban clusters), Rural population: 0)
Houses: 358 (318 occupied: 128 owner occupied, 190 renter occupied)
| % of renters here: | 60% |
| State: | 28% |
Housing density: 29 houses/condos per square mile
Median price asked for vacant for-sale houses and condos in 2022 in this county: $379,761.
Median contract rent in 2022: $1,452 (lower quartile is $1,108, upper quartile is $1,860)
Median gross rent in Parris Island, SC in 2022: $1,401
Housing units in Parris Island with a mortgage: 16 (0 second mortgage, 7 home equity loan, 0 both second mortgage and home equity loan)
Houses without a mortgage: 9
Compare current foreclosures near Parris Island, SC:
| Photo | Address | Area | Beds / Baths | Price | Details |
|---|---|---|---|---|---|

|
#1
Bobwhite Ct
Ladys Island, SC 29907
|
1,333 sq. feet
|
2 baths 4 beds |
show details | |

|
#2
Old Farm Rd
Bluffton, SC 29910
|
1,713 sq. feet
|
3 baths 3 beds |
show details | |

|
#3
Dudley Ave
Okatie, SC 29909
|
2,715 sq. feet
|
4 baths 3 beds |
show details | |

|
#4
South St
Bluffton, SC 29910
|
1,561 sq. feet
|
2 baths 3 beds |
show details | |

|
#5
W Chelsea Ct
Bluffton, SC 29910
|
2,569 sq. feet
|
2 baths 3 beds |
show details | |

|
#6
Knightsbridge Rd
Bluffton, SC 29910
|
1,332 sq. feet
|
2 baths 3 beds |
show details | |

|
#7
Red Cedar St
Bluffton, SC 29910
|
1,840 sq. feet
|
3 baths 3 beds |
show details | |

|
#8
Hidden Lakes Cir
Bluffton, SC 29910
|
2,324 sq. feet
|
2 baths 3 beds |
show details | |

|
#9
Kings Tree Rd
Hilton Head Island, SC 29928
|
4,060 sq. feet
|
5 baths 4 beds |
show details | |

|
#10
Hidden Lakes Cir
Bluffton, SC 29910
|
2,120 sq. feet
|
2 baths 1 beds |
show details |
| Photo | Address | Area | Beds / Baths | Price | Details |
|---|---|---|---|---|---|

|
#11
Walling Grove Rd
Ladys Island, SC 29907
|
3,811 sq. feet
|
3 baths 1 beds |
show details | |

|
#12
Blythewood Rd
Ladys Island, SC 29907
|
1,430 sq. feet
|
2 baths 2 beds |
show details | |

|
#13
Regent Ave
Bluffton, SC 29910
|
1,474 sq. feet
|
2 baths 1 beds |
show details | |

|
#14
Wheatfield Cir
Bluffton, SC 29910
|
1,524 sq. feet
|
2 baths 1 beds |
show details | |

|
#15
Waight St
Beaufort, SC 29902
|
624 sq. feet
|
1 baths 2 beds |
show details | |

|
#16
Chinaberry Dr
Hilton Head Island, SC 29926
|
1,579 sq. feet
|
3 baths 1 beds |
show details | |

|
#17
Magazine Pl
Hilton Head Island, SC 29928
|
4,146 sq. feet
|
4 baths 3 beds |
show details | |

|
#18
Ceasar Pl
Hilton Head Island, SC 29926
|
2,022 sq. feet
|
2 baths 1 beds |
show details | |

|
#19
Ceasar Pl
Hilton Head Island, SC 29926
|
1,894 sq. feet
|
4 baths 4 beds |
show details | |

|
#20
Gibson Dr
Hilton Head Island, SC 29926
|
1,722 sq. feet
|
2 baths 3 beds |
show details |
| Photo | Address | Area | Beds / Baths | Price | Details |
|---|---|---|---|---|---|

|
#21
Scarborough Head Rd
Hilton Head Island, SC 29928
|
1,760 sq. feet
|
2 baths 3 beds |
show details | |

|
#22
Purrysburg Dr
Ladys Island, SC 29907
|
1,865 sq. feet
|
2 baths 3 beds |
show details | |

|
#23
Country Manor Rd
Beaufort, SC 29906
|
1,025 sq. feet
|
1 baths 3 beds |
show details | |

|
#24
Jonesville Rd
Hilton Head Island, SC 29926
|
3,344 sq. feet
|
2 baths 1 beds |
show details | |

|
#25
Buck Rd
Ladys Island, SC 29907
|
1,100 sq. feet
|
1 baths 3 beds |
show details | |

|
#26
Mystic Dr E
Beaufort, SC 29902
|
1,153 sq. feet
|
2 baths 3 beds |
show details | |

|
#27
Hilda Ave
Ladys Island, SC 29907
|
1,516 sq. feet
|
2 baths 3 beds |
show details | |

|
#28
Belleview Cir W
Beaufort, SC 29902
|
1,026 sq. feet
|
1 baths 3 beds |
show details | |

|
#29
Blakers Blvd
Okatie, SC 29909
|
1,976 sq. feet
|
3 baths 3 beds |
show details | |

|
#30
Stuart Point Rd
Seabrook, SC 29940
|
1,568 sq. feet
|
2 baths 3 beds |
show details |
| Photo | Address | Area | Beds / Baths | Price | Details |
|---|---|---|---|---|---|

|
#31
Station Pkwy
Bluffton, SC 29910
|
2,582 sq. feet
|
2 baths 1 beds |
show details | |

|
#32
Hollowtail Dr
Bluffton, SC 29910
|
2,327 sq. feet
|
2 baths 3 beds |
show details | |

|
#33
Heartstone Cir
Bluffton, SC 29910
|
1,636 sq. feet
|
2 baths 3 beds |
show details | |

|
#34
Isle Of Palms E
Bluffton, SC 29910
|
2,723 sq. feet
|
2 baths 1 beds |
show details | |

|
#35
Stuart Point Rd
Seabrook, SC 29940
|
1,456 sq. feet
|
2 baths 3 beds |
show details | |

|
#36
Broadland Cir
Bluffton, SC 29910
|
1,600 sq. feet
|
2 baths 4 beds |
show details | |

|
#37
N Sea Pines Dr
Hilton Head Island, SC 29928
|
3,900 sq. feet
|
- baths 4 beds |
show details | |

|
#38
Broad River Blvd
Beaufort, SC 29906
|
840 sq. feet
|
1 baths 3 beds |
show details | |

|
#39
Island Pines Dr
Port Royal, SC 29935
|
1,088 sq. feet
|
2 baths 2 beds |
show details | |

|
#40
Scott St
Beaufort, SC 29902
|
1,280 sq. feet
|
1 baths 3 beds |
show details |
| Photo | Address | Area | Beds / Baths | Price | Details |
|---|---|---|---|---|---|

|
#41
Fairlawn Ct
Hilton Head Island, SC 29926
|
3,678 sq. feet
|
3 baths 4 beds |
show details | |

|
#42
Cobblestone Ct
Hilton Head Island, SC 29928
|
974 sq. feet
|
2 baths - beds |
show details | |

|
#43
Charles St # A
Beaufort, SC 29902
|
1,530 sq. feet
|
1 baths 2 beds |
show details | |

|
#44
Mary Elizabeth Dr
Ladys Island, SC 29907
|
1,186 sq. feet
|
2 baths 3 beds |
show details | |

|
#45
Ramsey Rd
Beaufort, SC 29906
|
1,150 sq. feet
|
1 baths 3 beds |
show details | |

|
#46
Middlefield Cir
Seabrook, SC 29940
|
1,388 sq. feet
|
1 baths 3 beds |
show details | |

|
#47
Fording Island Rd Apt 1804
Bluffton, SC 29910
|
1,001 sq. feet
|
- baths 2 beds |
show details | |

|
#48
Pickens St
Ladys Island, SC 29907
|
2,520 sq. feet
|
3 baths 4 beds |
show details | |

|
#49
Pickens St
Ladys Island, SC 29907
|
1,806 sq. feet
|
2 baths 3 beds |
show details | |

|
Check over 1 million property listings on Foreclosure.com!
|
browse all offers | |||


Household type by relationship:
Households: 156,968- In family households: 132,398 (32,225 male householders, 13,097 female householders)
35,966 spouses, 38,550 children (35,661 natural, 940 adopted, 1,949 stepchildren), 3,115 grandchildren, 1,565 brothers or sisters, 1,088 parents, foster children, 2,279 other relatives, 3,798 non-relatives
- In nonfamily households: 24,570 (8,451 male householders (6,212 living alone)), 11,172 female householders (9,597 living alone)), 4,947 nonrelatives
- In group quarters: 5,265 (650 institutionalized population)
18,192 married couples with children.
6,859 single-parent households (1,353 men, 5,506 women).
82.4% of residents of Parris Island speak English at home.
13.3% of residents speak Spanish at home (71% speak English very well, 23% speak English well, 6% speak English not well).
2.3% of residents speak other Indo-European language at home (71% speak English very well, 22% speak English well, 7% speak English not well).
2.0% of residents speak Asian or Pacific Island language at home (75% speak English very well, 25% speak English well).
Foreign born population: 624 (7.9%)
(60.4% of them are naturalized citizens)
| Here: | 5.5 |
| State: | 6.4 |
| Here: | 6.8 |
| State: | 4.5 |

- Bedrooms in owner-occupied houses and condos in Parris Island, South Carolina
- 0no bedroom
- 01 bedroom
- 262 bedrooms
- 853 bedrooms
- 174 bedrooms
- 05+ bedrooms

- Bedrooms in renter-occupied apartments in Parris Island, South Carolina
- 0no bedroom
- 61 bedroom
- 452 bedrooms
- 1153 bedrooms
- 244 bedrooms
- 05+ bedrooms

- Cars and other vehicles available in Parris Island in owner-occupied houses/condos
- 0no vehicle
- 161 vehicle
- 1052 vehicles
- 73 vehicles
- 04 vehicles
- 05+ vehicles

- Cars and other vehicles available in Parris Island in renter-occupied apartments
- 0no vehicle
- 301 vehicle
- 1442 vehicles
- 163 vehicles
- 04 vehicles
- 05+ vehicles

- Rooms in owner-occupied houses in Parris Island, South Carolina
- 01 room
- 02 rooms
- 173 rooms
- 94 rooms
- 455 rooms
- 266 rooms
- 317 rooms
- 08 rooms
- 09+ rooms

- Rooms in renter-occupied apartments in Parris Island, South Carolina
- 01 room
- 62 rooms
- 63 rooms
- 224 rooms
- 155 rooms
- 826 rooms
- 417 rooms
- 68 rooms
- 129+ rooms


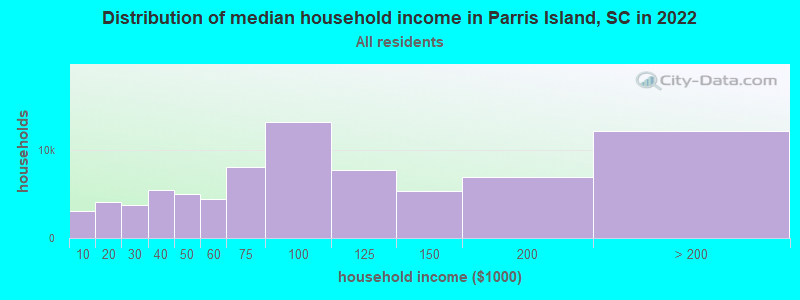
Parris Island, SC household income distribution

- 3,119Less than $10,000
- 4,154$10,000 to $19,999
- 3,740$20,000 to $29,999
- 5,514$30,000 to $39,999
- 5,060$40,000 to $49,999
- 4,390$50,000 to $59,999
- 8,091$60,000 to $74,999
- 13,221$75,000 to $99,999
- 7,703$100,000 to $124,999
- 5,403$125,000 to $149,999
- 6,987$150,000 to $199,999
- 12,161$200,000 or more
Percentage of workers working in this county: 95.0%
Number of people working at home: 835 (13.1% of all workers)
Travel time to work (commute)
- Less than 5 minutes: 965
- 5 to 9 minutes: 1,057
- 10 to 14 minutes: 284
- 15 to 19 minutes: 320
- 20 to 24 minutes: 77
- 25 to 29 minutes: 12
- 30 to 34 minutes: 34
- 35 to 39 minutes: 8
- 40 to 44 minutes: 0
- 45 to 59 minutes: 38
- 60 to 89 minutes: 6
- 90 or more minutes: 689
Means of transportation to work:
- Drove a car alone: 669 (16.2%)
- Carpooled: 101 (2.4%)
- Bus or trolley bus: 14 (0.3%)
- Motorcycle: 6 (0.1%)
- Walked: 2,040 (49.3%)
- Other means: 660 (15.9%)
- Worked at home: 649 (15.7%)


- Year of entry for the foreign-born population in Parris Island, South Carolina
- 661995 to March 2000
- 831990 to 1994
- 961985 to 1989
- 811980 to 1984
- 141975 to 1979
- 01970 to 1974
- 01965 to 1969
- 0Before 1965
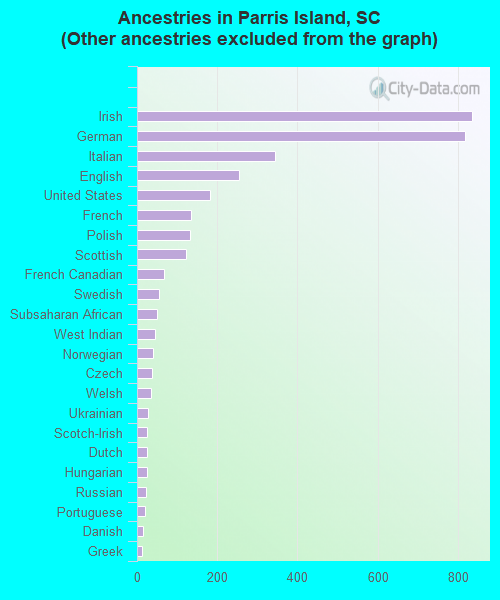
First ancestries reported:
- Other: 1,892 (36.1%)
- Irish: 836 (16.0%)
- German: 819 (15.6%)
- Italian: 343 (6.6%)
- English: 255 (4.9%)
- United States: 181 (3.5%)
- French: 135 (2.6%)
- Polish: 133 (2.5%)
- Scottish: 123 (2.4%)
- French Canadian: 67 (1.3%)
- Swedish: 55 (1.1%)
- Subsaharan African: 49 (0.9%)
- West Indian: 46 (0.9%)
- Norwegian: 40 (0.8%)
- Czech: 37 (0.7%)
- Welsh: 35 (0.7%)
- Ukrainian: 28 (0.5%)
- Scotch-Irish: 25 (0.5%)
- Dutch: 24 (0.5%)
- Hungarian: 24 (0.5%)
- Russian: 22 (0.4%)
- Portuguese: 19 (0.4%)
- Danish: 16 (0.3%)
- Greek: 12 (0.2%)
- Arab: 6 (0.1%)
- Lithuanian: 6 (0.1%)
- Slovak: 6 (0.1%)
Most common places of birth for foreign-born residents (%):
| Parris Island: | 14.1% (48) |
| South Carolina: | 27.3% (31,719) |
| Parris Island: | 12.9% (44) |
| South Carolina: | 2.9% (3,394) |
| Parris Island: | 10.3% (35) |
| South Carolina: | 0.4% (475) |
| Parris Island: | 6.5% (22) |
| South Carolina: | 0.6% (662) |
| Parris Island: | 5.3% (18) |
| South Carolina: | 2.6% (3,030) |
| Parris Island: | 4.7% (16) |
| South Carolina: | 0.7% (823) |
| Parris Island: | 3.8% (13) |
| South Carolina: | 0.8% (875) |
| Parris Island: | 3.8% (13) |
| South Carolina: | 0.2% (279) |
| Parris Island: | 3.5% (12) |
| South Carolina: | 0.8% (977) |
| Parris Island: | 3.5% (12) |
| South Carolina: | 0.4% (432) |
| Parris Island: | 3.5% (12) |
| South Carolina: | 4.4% (5,130) |
| Parris Island: | 3.5% (12) |
| South Carolina: | 0.2% (276) |
| Parris Island: | 3.2% (11) |
| South Carolina: | 1.0% (1,145) |
| Parris Island: | 3.2% (11) |
| South Carolina: | 0.4% (506) |
| Parris Island: | 2.6% (9) |
| South Carolina: | 0.5% (555) |
| Parris Island: | 2.1% (7) |
| South Carolina: | 1.0% (1,124) |
| Parris Island: | 1.8% (6) |
| South Carolina: | 1.3% (1,526) |
| Parris Island: | 1.8% (6) |
| South Carolina: | 0.4% (413) |
| Parris Island: | 1.8% (6) |
| South Carolina: | 0.7% (795) |
| Parris Island: | 1.8% (6) |
| South Carolina: | 4.4% (5,108) |
| Parris Island: | 1.8% (6) |
| South Carolina: | 0.1% (172) |
Place of birth for U.S.-born residents:
- This state: 230
- Other state: 4,100
- Northeast: 1,090
- Midwest: 948
- South: 1,691
- West: 371
8% of Parris Island residents lived in the same house 5 years ago.
Out of people who lived in different houses, 0% lived in this county.
Out of people who lived in different counties, 4% lived in South Carolina.
Education attainment for males 25 years and older:
- No schooling: 0
- Nursery to 4th grade: 0
- 5th and 6th grade: 0
- 7th and 8th grade: 0
- 9th grade: 11
- 10th grade: 0
- 11th grade: 5
- 12th grade, no diploma: 0
- High school graduate (or equivalency): 173
- Less than 1 year of college: 104
- Some college more than 1 year, no degree: 132
- Associate degree: 20
- Bachelor's degree: 64
- Master's degree: 19
- Professional school degree: 38
- Doctorate degree: 0

Education attainment for females 25 years and older:
- No schooling: 7
- Nursery to 4th grade: 0
- 5th and 6th grade: 0
- 7th and 8th grade: 0
- 9th grade: 0
- 10th grade: 0
- 11th grade: 0
- 12th grade, no diploma: 7
- High school graduate (or equivalency): 51
- Less than 1 year of college: 79
- Some college more than 1 year, no degree: 29
- Associate degree: 29
- Bachelor's degree: 59
- Master's degree: 0
- Professional school degree: 10
- Doctorate degree: 0


Housing units in structures:
- One, detached: 145
- One, attached: 44
- Two: 20
- 3 or 4: 35
- 5 to 9: 6
- 10 to 19: 5
- Mobile homes: 103
Median worth of mobile homes: $72,226

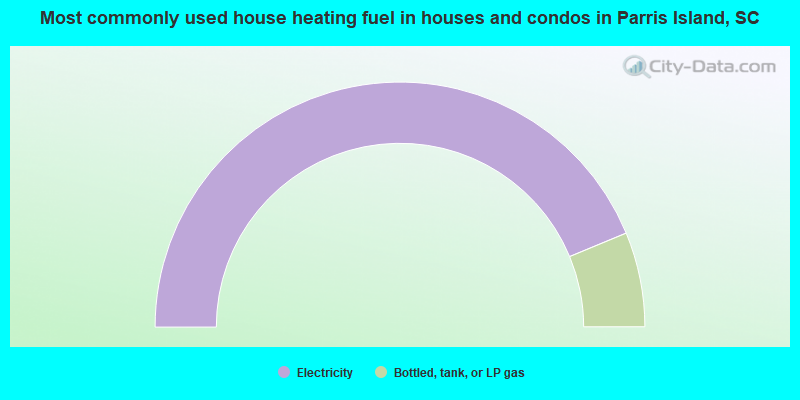
- 87.5%Electricity
- 12.5%Bottled, tank, or LP gas
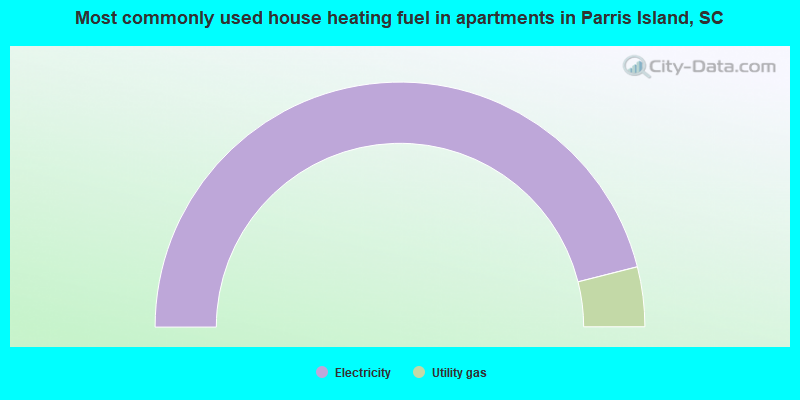
- 92.1%Electricity
- 7.9%Utility gas
Private vs. public school enrollment:
| Here: | 13.3% |
| South Carolina: | 9.2% |
| Here: | 16.5% |
| South Carolina: | 8.1% |
| Here: | 12.9% |
| South Carolina: | 20.3% |


