Parma, OH (Ohio) Houses and Residents
Estimated median house or condo value in 2022: $157,600 (it was $113,500 in 2000 )
Parma:
$157,600Ohio:
$204,100
Lower value quartile - upper value quartile: $123,500 - $206,300Total population: 80,015 (All urban)
Houses: 36,252 (34,961 occupied: 25,569 owner occupied, 9,392 renter occupied )
% of renters here:
27%State:
33%
Housing density: 1,816 houses/condos per square mile
Median price asked for vacant for-sale houses and condos in 2022: $145,006.
Median contract rent in 2022: $839 (lower quartile is $711, upper quartile is $993)
Median rent asked for vacant for-rent units in 2022: $1,294
Median gross rent in Parma, OH in 2022: $956
Housing units in Parma with a mortgage: 14,691 (1,499 second mortgage, 60 home equity loan, 965 both second mortgage and home equity loan )Houses without a mortgage: 1,189
Median household income for houses/condos with a mortgage: $84,825
Median household income for apartments without a mortgage: $63,913
Median monthly housing costs: $944
Data:
Median house or condo value ($)
Median house or condo value ($ change since 2000)
Median house or condo value ($) - White
Median house or condo value ($) - Black or African American
Median house or condo value ($) - Asian
Median house or condo value ($) - Hispanic or Latino
Median house or condo value ($) - American Indian and Alaska Native
Median house or condo value ($) - Multirace
Median house or condo value ($) - Other Race
Median price asked for mobile homes ($)
Household density (households per square mile)
Mean house or condo value by units in structure - 1, detached ($)
Mean house or condo value by units in structure - 1, attached ($)
Mean house or condo value by units in structure - 2 ($)
Mean house or condo value by units in structure by units in structure - 3 or 4 ($)
Mean house or condo value by units in structure - 5 or more ($)
Mean house or condo value by units in structure - Boat, RV, van, etc. ($)
Mean house or condo value by units in structure - Mobile home ($)
Median contract rent ($)
Median contract rent - Lower quartile ($)
Median contract rent - Upper quartile ($)
Median gross rent ($)
Urban houses (%)
Rural houses (%)
Houses occupied (%)
Houses occupied (% change since 2000)
Houses owner occupied (%)
Houses owner occupied (% change since 2000)
Houses renter occupied (%)
Houses renter occupied (% change since 2000)
Vacant housing units - For rent (%)
Vacant housing units - For rent (% change since 2000)
Vacant housing units - For sale only (%)
Vacant housing units - For sale only (% change since 2000)
Vacant housing units - Rented or sold, not occupied (%)
Vacant housing units - Rented or sold, not occupied (% change since 2000)
Vacant housing units - For seasonal, recreational, or occasional use (%)
Vacant housing units - For seasonal, recreational, or occasional use (% change since 2000)
Vacant housing units - For migrant workers (%)
Vacant housing units - For migrant workers (% change since 2000)
Vacant housing units - Other vacant (%)
Vacant housing units - Other vacant (% change since 2000)
Median monthly housing costs ($)
Median household income for houses/condos with a mortgage ($)
Median household income for houses/condos without a mortgage ($)
Median household income ($)
Median household income ($) - White
Median household income ($) - Black or African American
Median household income ($) - Asian
Median household income ($) - Hispanic or Latino
Median household income ($) - American Indian and Alaska Native
Median household income ($) - Multirace
Median household income ($) - Other Race
Mortgage status - with mortgage (%)
Mortgage status - with second mortgage (%)
Mortgage status - with home equity loan (%)
Mortgage status - with both second mortgage and home equity loan (%)
Mortgage status - without a mortgage (%)
Median year house/condo built
Median year apartment built
Household type by relationship - Male householder living alone (%)
Household type by relationship - Male householder not living alone (%)
Household type by relationship - Female householder living alone (%)
Household type by relationship - Female householder not living alone (%)
Household type by relationship - Opposite-Sex spouse (%)
Household type by relationship - Same-Sex spouse (%)
Household type by relationship - Opposite-Sex unmarried partner (%)
Household type by relationship - Same-Sex unmarried partner (%)
Household type by relationship - In group quarters (%)
Size of family households - 2-person household (%)
Size of family households - 3-person household (%)
Size of family households - 4-person household (%)
Size of family households - 5-person household (%)
Size of family households - 6-person household (%)
Size of family households - 7-or-more-person household (%)
Size of nonfamily households - 1-person household (%)
Size of nonfamily households - 2-person household (%)
Size of nonfamily households - 3-person household (%)
Size of nonfamily households - 4-person household (%)
Size of nonfamily households - 5-person household (%)
Size of nonfamily households - 6-person household (%)
Size of nonfamily households - 7-or-moreperson household (%)
Year house built - Built 2010 or later (%)
Year house built - Built 2000 to 2009 (%)
Year house built - Built 1990 to 1999 (%)
Year house built - Built 1980 to 1989 (%)
Year house built - Built 1970 to 1979 (%)
Year house built - Built 1960 to 1969 (%)
Year house built - Built 1950 to 1959 (%)
Year house built - Built 1940 to 1949 (%)
Year house built - Built 1939 or earlier (%)
Median number of rooms in houses and condos
Median number of rooms in apartments
Median number of bedrooms in owner occupied houses
Mean number of bedrooms in owner occupied houses
Median number of bedrooms in renter occupied houses
Mean number of bedrooms in renter occupied houses
Median number of vehichles in owner occupied houses
Mean number of vehichles in owner occupied houses
Median number of vehichles in renter occupied houses
Mean number of vehichles in renter occupied houses
Rooms in owner-occupied houses - 1 room (%)
Rooms in owner-occupied houses - 2 rooms (%)
Rooms in owner-occupied houses - 3 rooms (%)
Rooms in owner-occupied houses - 4 rooms (%)
Rooms in owner-occupied houses - 5 rooms (%)
Rooms in owner-occupied houses - 6 rooms (%)
Rooms in owner-occupied houses - 7 rooms (%)
Rooms in owner-occupied houses - 8 rooms (%)
Rooms in owner-occupied houses - 9+ rooms (%)
Rooms in renter-occupied houses - 1 room (%)
Rooms in renter-occupied houses - 2 rooms (%)
Rooms in renter-occupied houses - 3 rooms (%)
Rooms in renter-occupied houses - 4 rooms (%)
Rooms in renter-occupied houses - 5 rooms (%)
Rooms in renter-occupied houses - 6 rooms (%)
Rooms in renter-occupied houses - 7 rooms (%)
Rooms in renter-occupied houses - 8 rooms (%)
Rooms in renter-occupied houses - 9+ rooms (%)
Bedrooms in owner-occupied houses - no bedrooms (%)
Bedrooms in owner-occupied houses - 1 bedroom (%)
Bedrooms in owner-occupied houses - 2 bedrooms (%)
Bedrooms in owner-occupied houses - 3 bedrooms (%)
Bedrooms in owner-occupied houses - 4 bedrooms (%)
Bedrooms in owner-occupied houses - 5+ bedrooms (%)
Bedrooms in renter-occupied houses - no bedrooms (%)
Bedrooms in renter-occupied houses - 1 bedroom (%)
Bedrooms in renter-occupied houses - 2 bedrooms (%)
Bedrooms in renter-occupied houses - 3 bedrooms (%)
Bedrooms in renter-occupied houses - 4 bedrooms (%)
Bedrooms in renter-occupied houses - 5+ bedrooms (%)
Vehicles available in owner-occupied houses - no vehicle available (%)
Vehicles available in owner-occupied houses - 1 vehicle available(%)
Vehicles available in owner-occupied houses - 2 Vehicles available (%)
Vehicles available in owner-occupied houses - 3 Vehicles available (%)
Vehicles available in owner-occupied houses - 4 Vehicles available (%)
Vehicles available in owner-occupied houses - 5+ Vehicles available (%)
Vehicles available in renter-occupied houses - no vehicle available (%)
Vehicles available in renter-occupied houses - 1 vehicle available (%)
Vehicles available in renter-occupied houses - 2 Vehicles available (%)
Vehicles available in renter-occupied houses - 3 Vehicles available (%)
Vehicles available in renter-occupied houses - 4 Vehicles available (%)
Vehicles available in renter-occupied houses - 5+ Vehicles available (%)
Housing units in structures - 1, detached (%)
Housing units in structures - 1, attached (%)
Housing units in structures - 2 (%)
Housing units in structures - 3 or 4 (%)
Housing units in structures - 5 to 9 (%)
Housing units in structures - 10 to 19 (%)
Housing units in structures - 20 to 49 (%)
Housing units in structures - 50 or more (%)
Housing units in structures - Mobile home (%)
Housing units in structures - Boat, RV, van, etc. (%)
Housing units in structures - Owners - 1, detached (%)
Housing units in structures - Owners - 1, attached (%)
Housing units in structures - Owners - 2 (%)
Housing units in structures - Owners - 3 or 4 (%)
Housing units in structures - Owners - 5 to 9 (%)
Housing units in structures - Owners - 10 to 19 (%)
Housing units in structures - Owners - 20 to 49 (%)
Housing units in structures - Owners - 50 or more (%)
Housing units in structures - Owners - Mobile home (%)
Housing units in structures - Owners - Boat, RV, van, etc. (%)
Housing units in structures - Renters - 1, detached (%)
Housing units in structures - Renters - 1, attached (%)
Housing units in structures - Renters - 2 (%)
Housing units in structures - Renters - 3 or 4 (%)
Housing units in structures - Renters - 5 to 9 (%)
Housing units in structures - Renters - 10 to 19 (%)
Housing units in structures - Renters - 20 to 49 (%)
Housing units in structures - Renters - 50 or more (%)
Housing units in structures - Renters - Mobile home (%)
Housing units in structures - Renters - Boat, RV, van, etc. (%)
House/condo owner moved in on average (years ago)
Renter moved in on average (years ago)
Year householder moved into unit - Moved in 1999 to March 2000 (%)
Year householder moved into unit - Moved in 1999 to March 2000 (%) - White
Year householder moved into unit - Moved in 1999 to March 2000 (%) - Black or African American
Year householder moved into unit - Moved in 1999 to March 2000 (%) - Asian
Year householder moved into unit - Moved in 1999 to March 2000 (%) - Hispanic or Latino
Year householder moved into unit - Moved in 1999 to March 2000 (%) - American Indian and Alaska Native
Year householder moved into unit - Moved in 1999 to March 2000 (%) - Multirace
Year householder moved into unit - Moved in 1999 to March 2000 (%) - Other Race
Year householder moved into unit - Moved in 1995 to 1998 (%)
Year householder moved into unit - Moved in 1995 to 1998 (%) - White
Year householder moved into unit - Moved in 1995 to 1998 (%) - Black or African American
Year householder moved into unit - Moved in 1995 to 1998 (%) - Asian
Year householder moved into unit - Moved in 1995 to 1998 (%) - Hispanic or Latino
Year householder moved into unit - Moved in 1995 to 1998 (%) - American Indian and Alaska Native
Year householder moved into unit - Moved in 1995 to 1998 (%) - Multirace
Year householder moved into unit - Moved in 1995 to 1998 (%) - Other Race
Year householder moved into unit - Moved in 1990 to 1994 (%)
Year householder moved into unit - Moved in 1990 to 1994 (%) - White
Year householder moved into unit - Moved in 1990 to 1994 (%) - Black or African American
Year householder moved into unit - Moved in 1990 to 1994 (%) - Asian
Year householder moved into unit - Moved in 1990 to 1994 (%) - Hispanic or Latino
Year householder moved into unit - Moved in 1990 to 1994 (%) - American Indian and Alaska Native
Year householder moved into unit - Moved in 1990 to 1994 (%) - Multirace
Year householder moved into unit - Moved in 1990 to 1994 (%) - Other Race
Year householder moved into unit - Moved in 1980 to 1989 (%)
Year householder moved into unit - Moved in 1980 to 1989 (%) - White
Year householder moved into unit - Moved in 1980 to 1989 (%) - Black or African American
Year householder moved into unit - Moved in 1980 to 1989 (%) - Asian
Year householder moved into unit - Moved in 1980 to 1989 (%) - Hispanic or Latino
Year householder moved into unit - Moved in 1980 to 1989 (%) - American Indian and Alaska Native
Year householder moved into unit - Moved in 1980 to 1989 (%) - Multirace
Year householder moved into unit - Moved in 1980 to 1989 (%) - Other Race
Year householder moved into unit - Moved in 1970 to 1979 (%)
Year householder moved into unit - Moved in 1970 to 1979 (%) - White
Year householder moved into unit - Moved in 1970 to 1979 (%) - Black or African American
Year householder moved into unit - Moved in 1970 to 1979 (%) - Asian
Year householder moved into unit - Moved in 1970 to 1979 (%) - Hispanic or Latino
Year householder moved into unit - Moved in 1970 to 1979 (%) - American Indian and Alaska Native
Year householder moved into unit - Moved in 1970 to 1979 (%) - Multirace
Year householder moved into unit - Moved in 1970 to 1979 (%) - Other Race
Year householder moved into unit - Moved in 1969 or earlier (%)
Year householder moved into unit - Moved in 1969 or earlier (%) - White
Year householder moved into unit - Moved in 1969 or earlier (%) - Black or African American
Year householder moved into unit - Moved in 1969 or earlier (%) - Asian
Year householder moved into unit - Moved in 1969 or earlier (%) - Hispanic or Latino
Year householder moved into unit - Moved in 1969 or earlier (%) - American Indian and Alaska Native
Year householder moved into unit - Moved in 1969 or earlier (%) - Multirace
Year householder moved into unit - Moved in 1969 or earlier (%) - Other Race
Housing units lacking complete plumbing facilities (%)
Housing units lacking complete kitchen facilities (%)
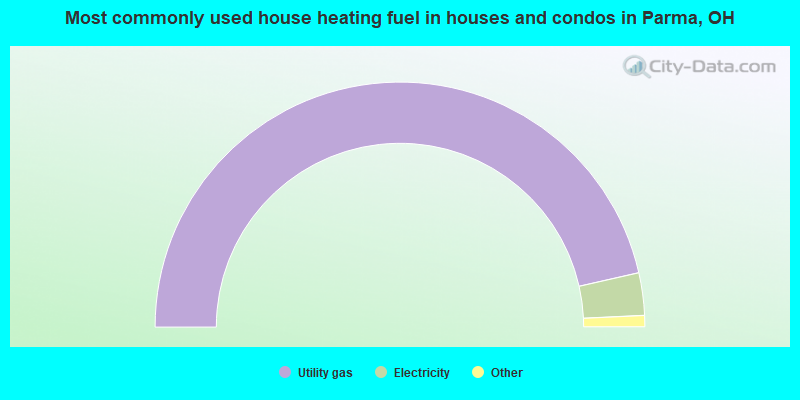
House heating fuel used in houses and condos - Utility gas (%)
House heating fuel used in houses and condos - Bottled, tank, or LP gas (%)
House heating fuel used in houses and condos - Electricity (%)
House heating fuel used in houses and condos - Fuel oil, kerosene, etc. (%)
House heating fuel used in houses and condos - Coal or coke (%)
House heating fuel used in houses and condos - Wood (%)
House heating fuel used in houses and condos - Solar energy (%)
House heating fuel used in houses and condos - Other fuel (%)
House heating fuel used in houses and condos - No fuel used (%)
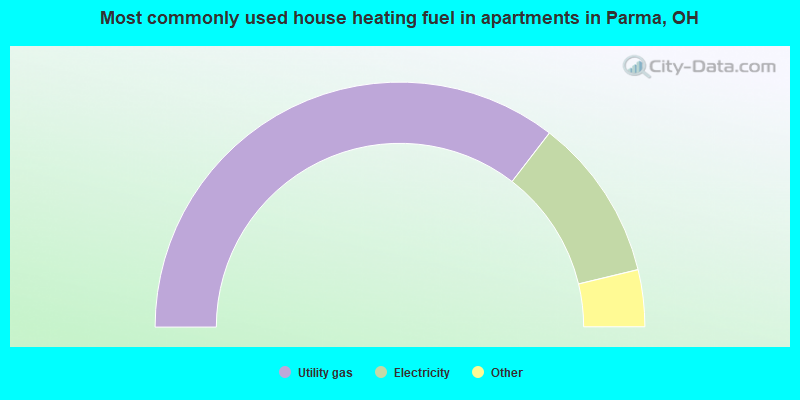
House heating fuel used in apartments - Utility gas (%)
House heating fuel used in apartments - Bottled, tank, or LP gas (%)
House heating fuel used in apartments - Electricity (%)
House heating fuel used in apartments - Fuel oil, kerosene, etc. (%)
House heating fuel used in apartments - Coal or coke (%)
House heating fuel used in apartments - Wood (%)
House heating fuel used in apartments - Solar energy (%)
House heating fuel used in apartments - Other fuel (%)
House heating fuel used in apartments - No fuel used (%)
Latest news about housing in Parma, OH collected exclusively by city-data.com from local newspapers, TV, and radio stations
Median year house/condo built: 1957Median year apartment built: 1965Household type by relationship:
Households: 79,356
Male householders: 15,958 (4,446 living alone ), Female householders: 19,003 (6,755 living alone )14,694 spouses (14,429 opposite-sex spouses ), 2,303 unmarried partners , (2,148 opposite-sex unmarried partners ), 21,620 children (20,597 natural , 638 adopted , 385 stepchildren ), 424 grandchildren , 790 brothers or sisters , 1,098 parents , 0 foster children , 730 other relatives , 1,455 non-relatives In group quarters: 1,281
Size of family households: 11,188 2-persons , 4,759 3-persons , 3,659 4-persons , 1,226 5-persons , 493 6-persons , 44 7-or-more-persons .
Size of nonfamily households: 11,201 1-person , 2,064 2-persons , 158 3-persons , 169 4-persons .
9,480 married couples with children. single-parent households (679 men , 3,406 women ).
84.7% of residents of Parma speak English at home. of residents speak Spanish at home (70% speak English very well , 17% speak English well , 13% speak English not well ).of residents speak other Indo-European language at home (56% speak English very well , 31% speak English well , 10% speak English not well , 4% don't speak English at all ).of residents speak Asian or Pacific Island language at home (53% speak English very well , 22% speak English well , 23% speak English not well , 2% don't speak English at all ).of residents speak other language at home (60% speak English very well , 27% speak English well , 8% speak English not well , 5% don't speak English at all ).
Foreign born population: 7,328 (9.2%)of them are naturalized citizens )
Median number of rooms in houses and condos:
Median number of rooms in apartments
Owner-occupied Renter-occupied
Rooms in owner-occupied houses in Parma, Ohio
50 1 room 0 2 rooms 146 3 rooms 1,260 4 rooms 4,626 5 rooms 7,875 6 rooms 4,790 7 rooms 3,462 8 rooms 3,360 9+ rooms
Rooms in renter-occupied apartments in Parma, Ohio
120 1 room 583 2 rooms 1,936 3 rooms 3,033 4 rooms 889 5 rooms 1,298 6 rooms 769 7 rooms 567 8 rooms 197 9+ rooms
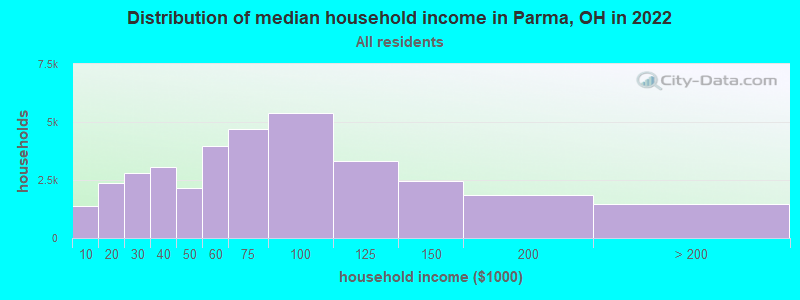
Parma, OH household income distribution 1,381 Less than $10,0002,387 $10,000 to $19,9992,808 $20,000 to $29,9993,061 $30,000 to $39,9992,145 $40,000 to $49,9993,977 $50,000 to $59,9994,693 $60,000 to $74,9995,397 $75,000 to $99,9993,325 $100,000 to $124,9992,478 $125,000 to $149,9991,842 $150,000 to $199,9991,467 $200,000 or more
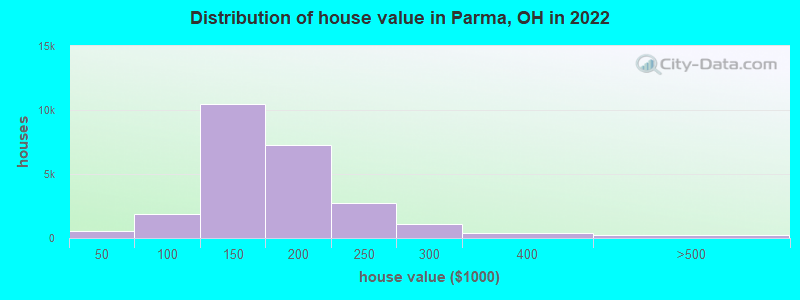
Home value of owner - occupied houses in 2022 in Parma, OH 128 Less than $10,000115 $10,000 to $14,999163 $15,000 to $19,99953 $20,000 to $24,99914 $25,000 to $29,99933 $30,000 to $34,9993 $35,000 to $39,9994 $40,000 to $49,99980 $50,000 to $59,99994 $60,000 to $69,999152 $70,000 to $79,999521 $80,000 to $89,9991,051 $90,000 to $99,9994,457 $100,000 to $124,9996,011 $125,000 to $149,9994,887 $150,000 to $174,9992,346 $175,000 to $199,9992,748 $200,000 to $249,9991,124 $250,000 to $299,999424 $300,000 to $399,99984 $400,000 to $499,99987 $500,000 to $749,99931 $750,000 to $999,9999 $1,000,000 to $1,499,99946 $2,000,000 or moreRent paid by renters in 2022 in Parma, OH 38 Less than $10069 $100 to $14912 $150 to $19927 $200 to $24911 $250 to $2999 $300 to $34910 $350 to $399300 $400 to $44955 $450 to $499122 $500 to $549219 $550 to $599686 $600 to $649878 $650 to $699597 $700 to $749520 $750 to $7991,465 $800 to $8991,210 $900 to $9992,079 $1,000 to $1,249634 $1,250 to $1,499149 $1,500 to $1,99910 $3,000 to $3,4997 $3,500 or more473 No cash rent
Percentage of workers working in this county: 86.1%Number of people working at home: 5,186 (12.3% of all workers )
Travel time to work (commute)
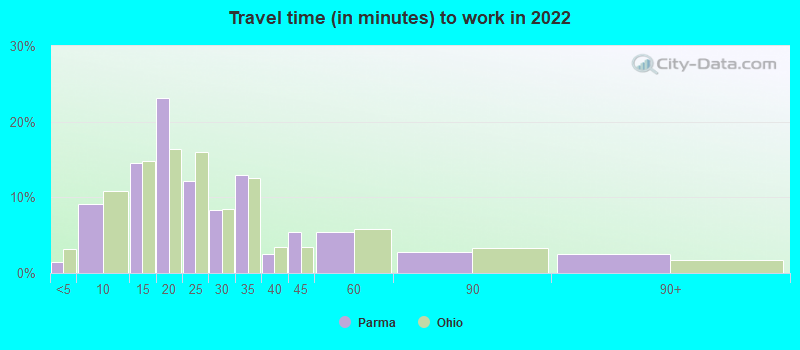
Less than 5 minutes: 815 to 9 minutes: 3,00810 to 14 minutes: 4,29215 to 19 minutes: 6,24520 to 24 minutes: 7,47425 to 29 minutes: 3,41130 to 34 minutes: 5,10335 to 39 minutes: 1,19540 to 44 minutes: 1,16645 to 59 minutes: 3,15960 to 89 minutes: 51390 or more minutes: 1,266
Means of transportation to work:
Drove a car alone: 17,587 (70.3%)Carpooled: 1,793 (7.2%)Bus : 197 (0.8%)Taxi: 265 (1.1%)Walked: 577 (2.3%)Worked at home: 5,186 (20.7%)
Unemployment by race in 2022
Unemployment rate for White non-Hispanic residents 1.6% Males4.6% FemalesUnemployment rate for Black residents 31.9% Males16.0% FemalesUnemployment rate for American Indian and Alaska Native residents 33.5% MalesUnemployment rate for Asian residents 7.9% Males3.0% FemalesUnemployment rate for other race residents 4.4% MalesUnemployment rate for two or more race residents 1.5% Males1.3% FemalesUnemployment rate for Hispanic or Latino residents 3.2% Males1.7% Females
Year of entry for the foreign-born population in Parma, Ohio
2,359 2010 or later 1,250 2000 to 2009 1,756 1990 to 1999 747 1980 to 1989 923 1970 to 1979 3,889 Before 1970
First ancestries reported:
German: 3,331 (9.8%)
Polish: 3,330 (9.8%)
Irish: 2,459 (7.2%)
Ukrainian: 2,320 (6.8%)
Italian: 2,294 (6.7%)
American: 1,965 (5.8%)
Slovak: 1,244 (3.6%)
Serbian: 1,076 (3.2%)
Hungarian: 1,009 (3.0%)
English: 915 (2.7%)
European: 677 (2.0%)
Romanian: 568 (1.7%)
Czech: 373 (1.1%)
Lebanese: 313 (0.9%)
Scottish: 286 (0.8%)
Greek: 242 (0.7%)
Egyptian: 236 (0.7%)
Russian: 234 (0.7%)
Slovene: 233 (0.7%)
Scotch-Irish: 160 (0.5%)
French: 159 (0.5%)
Eastern European: 140 (0.4%)
Jordanian: 112 (0.3%)
African: 106 (0.3%)
Croatian: 99 (0.3%)
Somali: 98 (0.3%)
Welsh: 93 (0.3%)
Czechoslovakian: 91 (0.3%)
Palestinian: 81 (0.2%)
Albanian: 73 (0.2%)
Dutch: 66 (0.2%)
Nigerian: 54 (0.2%)
Finnish: 52 (0.2%)
Barbadian: 52 (0.2%)
Guyanese: 51 (0.1%)
Yugoslavian: 51 (0.1%)
Jamaican: 49 (0.1%)
Northern European: 47 (0.1%)
Pennsylvania German: 45 (0.1%)
Bulgarian: 42 (0.1%)
Arab: 41 (0.1%)
Austrian: 39 (0.1%)
Iraqi: 34 (0.10%)
Latvian: 31 (0.09%)
Swedish: 29 (0.09%)
Armenian: 27 (0.08%)
Moroccan: 27 (0.08%)
British: 26 (0.08%)
Macedonian: 26 (0.08%)
French Canadian: 24 (0.07%)
Belizean: 21 (0.06%)
Norwegian: 19 (0.06%)
Ghanaian: 14 (0.04%)
Lithuanian: 10 (0.03%)
Carpatho Rusyn: 9 (0.03%)
Celtic: 8 (0.02%)
Afghan: 8 (0.02%)
Canadian: 4 (0.01%)
Most common places of birth for foreign-born residents (%): Ukraine Parma:
17.3% (1,361)Ohio:
1.7% (9,564)
Romania Parma:
5.1% (405)Ohio:
1.1% (6,346)
Egypt Parma:
4.8% (377)Ohio:
0.8% (4,651)
Serbia Parma:
4.7% (372)Ohio:
0.3% (1,875)
India Parma:
4.4% (347)Ohio:
11.6% (66,525)
Germany Parma:
4.1% (326)Ohio:
2.2% (12,846)
Poland Parma:
3.5% (273)Ohio:
0.8% (4,490)
Uzbekistan Parma:
3.2% (255)Ohio:
0.7% (3,864)
Bosnia and Herzegovina Parma:
3.1% (245)Ohio:
0.6% (3,269)
Italy Parma:
3.0% (236)Ohio:
1.2% (6,679)
Vietnam Parma:
2.7% (212)Ohio:
1.9% (10,960)
Moldova Parma:
2.6% (207)Ohio:
0.2% (1,047)
Philippines Parma:
2.4% (189)Ohio:
3.1% (17,818)
Bhutan Parma:
2.3% (183)Ohio:
2.4% (13,773)
Peru Parma:
1.8% (141)Ohio:
0.6% (3,210)
Other Eastern Europe Parma:
1.7% (136)Ohio:
0.7% (4,155)
Ecuador Parma:
1.7% (132)Ohio:
0.3% (1,918)
Albania Parma:
1.6% (130)Ohio:
0.4% (2,186)
Russia Parma:
1.6% (130)Ohio:
1.5% (8,452)
Lebanon Parma:
1.5% (121)Ohio:
0.7% (3,862)
Place of birth for U.S.-born residents:
This state: 59,233Other state: 11,139Northeast: 4,693Midwest: 1,945South: 3,380West: 1,121 87.9% of Parma residents lived in the same house 1 years ago.
Out of people who lived in different houses, 40.8% lived in this county.
Out of people who lived in different counties, 46.7% lived in Ohio.
Parma:
87.9%State average:
87.8%
Education attainment for males 25 years and older:
No schooling: 232Nursery to 4th grade: 05th and 6th grade: 327th and 8th grade: 999th grade: 26310th grade: 011th grade: 21012th grade, no diploma: 657High school graduate (or equivalency): 9,869Less than 1 year of college: 2,487Some college more than 1 year, no degree: 3,444Associate degree: 2,920Bachelor's degree: 5,039Master's degree: 980Professional school degree: 223Doctorate degree: 204
Education attainment for females 25 years and older:
No schooling: 513Nursery to 4th grade: 1235th and 6th grade: 387th and 8th grade: 1819th grade: 10410th grade: 19311th grade: 36512th grade, no diploma: 899High school graduate (or equivalency): 11,267Less than 1 year of college: 2,747Some college more than 1 year, no degree: 3,184Associate degree: 3,350Bachelor's degree: 5,134Master's degree: 2,736Professional school degree: 373Doctorate degree: 267
Housing units in structures:
One, detached: 27,043One, attached: 1,598Two: 1,5723 or 4: 3095 to 9: 1,20210 to 19: 2,13520 to 49: 21250 or more: 2,181Housing units lacking complete plumbing facilities in 2022: 0.2%Housing units lacking complete kitchen facilities in 2022: 0.9%House/condo owner moved in on average 16 years ago
Renter moved in on average 2 years ago
Private vs. public school enrollment:
Students in private schools in grades 1 to 8 (elementary and middle school): 1,389 Students in private schools in grades 9 to 12 (high school): 863 Students in private undergraduate colleges: 483