Palm River-Clair Mel, FL (Florida) Houses and Residents
| Palm River-Clair Mel: | $256,295 |
| Florida: | $354,100 |
Total population: 21,024 (Urban population: 17,598, Rural population: 0)
Houses: 10,481 (9,765 occupied: 6,083 owner occupied, 3,721 renter occupied)
| % of renters here: | 38% |
| State: | 33% |
Housing density: 895 houses/condos per square mile
Median price asked for vacant for-sale houses and condos in 2022: $241,750.
Median contract rent in 2022: $1,277 (lower quartile is $968, upper quartile is $1,733)
Median rent asked for vacant for-rent units in 2022: $1,907
Median gross rent in Palm River-Clair Mel, FL in 2022: $1,369
Housing units in Palm River-Clair Mel with a mortgage: 4,342 (264 second mortgage, 6 home equity loan, 204 both second mortgage and home equity loan)
Houses without a mortgage: 0
Median household income for houses/condos with a mortgage: $84,794
Median household income for apartments without a mortgage: $52,153
Median monthly housing costs: $1,255
Compare current foreclosures near Palm River-Clair Mel, FL:
| Photo | Address | Area | Beds / Baths | Price | Details |
|---|---|---|---|---|---|

|
#1
Blue Magnolia Rd
Brandon, FL 33510
|
1,231 sq. feet
|
2 baths 2 beds |
$200,000
|
show details |

|
#2
Harris Hawk Ave
Ruskin, FL 33570
|
1,926 sq. feet
|
2 baths 4 beds |
$365,000
|
show details |

|
#3
N 21st St
Tampa, FL 33605
|
1,250 sq. feet
|
2 baths 3 beds |
show details | |

|
#4
Corvette Dr
Tampa, FL 33624
|
1,404 sq. feet
|
1 baths 2 beds |
show details | |

|
#5
Gaspar Oaks Dr
Tampa, FL 33611
|
1,844 sq. feet
|
3 baths 2 beds |
show details | |

|
#6
Mariners Watch Dr
Tampa, FL 33615
|
3,607 sq. feet
|
3 baths 5 beds |
show details | |

|
#7
Lancer Dr
Tampa, FL 33618
|
1,452 sq. feet
|
2 baths 3 beds |
show details | |

|
#8
Early Run Ln
Riverview, FL 33578
|
- sq. feet
|
2 baths 4 beds |
show details | |

|
#9
Swenson Ter
Lutz, FL 33549
|
1,816 sq. feet
|
2 baths 3 beds |
show details | |

|
#10
N Mulberry St
Tampa, FL 33612
|
1,708 sq. feet
|
2 baths 5 beds |
show details |
| Photo | Address | Area | Beds / Baths | Price | Details |
|---|---|---|---|---|---|

|
#11
Marsanne Pl
Riverview, FL 33578
|
3,293 sq. feet
|
3 baths 5 beds |
show details | |

|
#12
Cypress Haven Dr
Tampa, FL 33647
|
3,444 sq. feet
|
4 baths 5 beds |
show details | |

|
#13
Freeport Rd
Riverview, FL 33578
|
2,172 sq. feet
|
2 baths 3 beds |
show details | |

|
#14
Chatham Walk Drive
Ruskin, FL 33570
|
1,401 sq. feet
|
2 baths 3 beds |
show details | |

|
#15
Ashbury Palms Dr
Tampa, FL 33647
|
1,764 sq. feet
|
2 baths 3 beds |
show details | |

|
#16
Temple Park Dr
Tampa, FL 33637
|
1,234 sq. feet
|
2 baths 3 beds |
show details | |

|
#17
Tughill Dr
Tampa, FL 33624
|
2,124 sq. feet
|
2 baths 4 beds |
show details | |

|
#18
Colmar Place
Apollo Beach, FL 33572
|
1,976 sq. feet
|
2 baths 4 beds |
show details | |

|
#19
Galewood Cir
Tampa, FL 33615
|
1,445 sq. feet
|
1 baths 2 beds |
show details | |

|
#20
Timberlane West Dr
Tampa, FL 33615
|
1,441 sq. feet
|
2 baths 3 beds |
show details |
| Photo | Address | Area | Beds / Baths | Price | Details |
|---|---|---|---|---|---|

|
#21
King Alfred Dr
Tampa, FL 33610
|
1,043 sq. feet
|
1 baths 3 beds |
show details | |

|
#22
Wave Tressle Pl
Wimauma, FL 33598
|
2,522 sq. feet
|
3 baths 5 beds |
show details | |

|
#23
Lucerne Ave
Tampa, FL 33606
|
5,157 sq. feet
|
4 baths 4 beds |
show details | |

|
#24
Summerton Dr
Riverview, FL 33579
|
1,518 sq. feet
|
2 baths 3 beds |
show details | |

|
#25
Falconridge Rd
Lithia, FL 33547
|
2,578 sq. feet
|
3 baths 4 beds |
show details | |

|
#26
Ware Archway Ct
Brandon, FL 33510
|
2,660 sq. feet
|
3 baths 5 beds |
show details | |

|
#27
Potomac Mark Pl
Ruskin, FL 33570
|
1,704 sq. feet
|
2 baths 3 beds |
show details | |

|
#28
S Valrico Rd
Valrico, FL 33594
|
3,568 sq. feet
|
2 baths 3 beds |
show details | |

|
#29
S Dawnmeadow Ct
Plant City, FL 33566
|
1,425 sq. feet
|
2 baths 3 beds |
show details | |

|
#30
Orange St
Seffner, FL 33584
|
1,208 sq. feet
|
2 baths 3 beds |
show details |
| Photo | Address | Area | Beds / Baths | Price | Details |
|---|---|---|---|---|---|

|
#31
Carriage Pointe Dr
Gibsonton, FL 33534
|
2,086 sq. feet
|
2 baths 4 beds |
show details | |

|
#32
Mercer Loop
Plant City, FL 33567
|
1,440 sq. feet
|
2 baths 3 beds |
show details | |

|
#33
Harbour Blue St
Ruskin, FL 33570
|
- sq. feet
|
3 baths 4 beds |
show details | |

|
#34
Fawn Brindle St
Riverview, FL 33578
|
- sq. feet
|
2 baths 3 beds |
show details | |

|
#35
Truman Dr
Seffner, FL 33584
|
1,243 sq. feet
|
2 baths 3 beds |
show details | |

|
#36
Rockhill Rd
Thonotosassa, FL 33592
|
1,150 sq. feet
|
2 baths 3 beds |
show details | |

|
#37
N 12th St
Tampa, FL 33604
|
1,160 sq. feet
|
1 baths 3 beds |
show details | |

|
#38
E Frierson Ave
Tampa, FL 33610
|
1,175 sq. feet
|
1 baths 2 beds |
show details | |

|
#39
Haddon Mist Dr
Wimauma, FL 33598
|
1,978 sq. feet
|
2 baths 3 beds |
show details | |

|
#40
Deleuil Ave
Tampa, FL 33610
|
848 sq. feet
|
1 baths 2 beds |
show details |
| Photo | Address | Area | Beds / Baths | Price | Details |
|---|---|---|---|---|---|

|
#41
Laraway Dr
Riverview, FL 33579
|
985 sq. feet
|
2 baths 2 beds |
show details | |

|
#42
S Swoope St
Tampa, FL 33616
|
1,036 sq. feet
|
2 baths 4 beds |
show details | |

|
#43
Dew Bloom Rd
Valrico, FL 33594
|
1,318 sq. feet
|
2 baths 3 beds |
show details | |

|
#44
Banyan Wood Way
Riverview, FL 33579
|
1,632 sq. feet
|
2 baths 3 beds |
show details | |

|
#45
W Minnehaha St
Tampa, FL 33614
|
1,968 sq. feet
|
3 baths 4 beds |
show details | |

|
#46
Skipping Stone Ct
Valrico, FL 33596
|
2,433 sq. feet
|
2 baths 4 beds |
show details | |

|
#47
W Minnehaha St
Tampa, FL 33614
|
1,462 sq. feet
|
2 baths 3 beds |
show details | |

|
#48
W Jean St
Tampa, FL 33614
|
864 sq. feet
|
1 baths 3 beds |
show details | |

|
#49
N Hubert Ave
Tampa, FL 33614
|
1,068 sq. feet
|
2 baths 3 beds |
show details | |

|
Check over 1 million property listings on Foreclosure.com!
|
browse all offers | |||


 | 120-150s houses? (43 replies) |
| Miami vs Tampa (which city? opinions please) (69 replies) |
| Where is Tampa Bay still Underwater? (4 replies) |

Median year apartment built: 1994
Household type by relationship:
Households: 26,512- Male householders: 4,585 (1,368 living alone), Female householders: 5,122 (1,436 living alone)
3,294 spouses (3,265 opposite-sex spouses), 1,281 unmarried partners, (1,195 opposite-sex unmarried partners), 8,419 children (7,550 natural, 160 adopted, 708 stepchildren), 1,532 grandchildren, 246 brothers or sisters, 565 parents, 0 foster children, 423 other relatives, 1,000 non-relatives
- In group quarters: 40
Size of family households: 1,951 2-persons, 1,623 3-persons, 1,113 4-persons, 1,055 5-persons, 329 6-persons, 156 7-or-more-persons.
Size of nonfamily households: 2,697 1-person, 876 2-persons, 20 3-persons, 30 4-persons.
2,968 married couples with children.
2,397 single-parent households (1,087 men, 1,310 women).
61.3% of residents of Palm River-Clair Mel speak English at home.
33.6% of residents speak Spanish at home (48% speak English very well, 15% speak English well, 20% speak English not well, 17% don't speak English at all).
3.7% of residents speak other Indo-European language at home (72% speak English very well, 17% speak English well, 5% speak English not well, 6% don't speak English at all).
0.8% of residents speak Asian or Pacific Island language at home (64% speak English very well, 9% speak English well, 17% speak English not well, 11% don't speak English at all).
0.8% of residents speak other language at home (84% speak English very well, 16% speak English well).
Foreign born population: 5,799 (21.9%)
(45.4% of them are naturalized citizens)
| Here: | 5.9 |
| State: | 5.9 |
| Here: | 4.5 |
| State: | 4.2 |

- Bedrooms in owner-occupied houses and condos in Palm River-Clair Mel, Florida
- 25no bedroom
- 911 bedroom
- 9212 bedrooms
- 3,2143 bedrooms
- 1,7944 bedrooms
- 395+ bedrooms

- Bedrooms in renter-occupied apartments in Palm River-Clair Mel, Florida
- 99no bedroom
- 4321 bedroom
- 1,8502 bedrooms
- 8563 bedrooms
- 3914 bedrooms
- 955+ bedrooms

- Cars and other vehicles available in Palm River-Clair Mel in owner-occupied houses/condos
- 96no vehicle
- 1,8911 vehicle
- 3,0082 vehicles
- 8253 vehicles
- 1454 vehicles
- 1195+ vehicles

- Cars and other vehicles available in Palm River-Clair Mel in renter-occupied apartments
- 377no vehicle
- 1,7861 vehicle
- 1,2982 vehicles
- 2573 vehicles
- 44 vehicles
- 05+ vehicles

- Rooms in owner-occupied houses in Palm River-Clair Mel, Florida
- 251 room
- 122 rooms
- 2293 rooms
- 5174 rooms
- 1,5525 rooms
- 1,7606 rooms
- 1,3337 rooms
- 3798 rooms
- 2769+ rooms

- Rooms in renter-occupied apartments in Palm River-Clair Mel, Florida
- 991 room
- 1272 rooms
- 4923 rooms
- 1,0974 rooms
- 8865 rooms
- 4426 rooms
- 4077 rooms
- 1278 rooms
- 459+ rooms


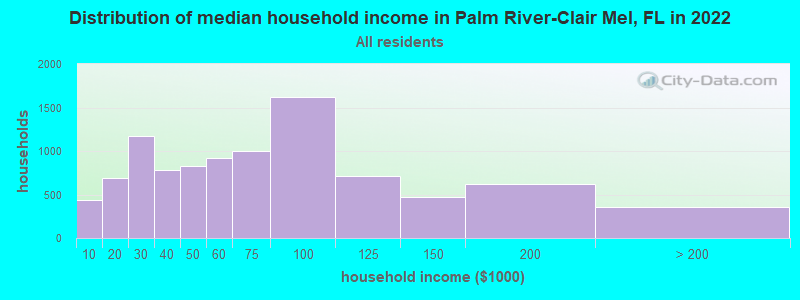
Palm River-Clair Mel, FL household income distribution

- 437Less than $10,000
- 693$10,000 to $19,999
- 1,175$20,000 to $29,999
- 784$30,000 to $39,999
- 831$40,000 to $49,999
- 925$50,000 to $59,999
- 998$60,000 to $74,999
- 1,623$75,000 to $99,999
- 711$100,000 to $124,999
- 475$125,000 to $149,999
- 617$150,000 to $199,999
- 353$200,000 or more
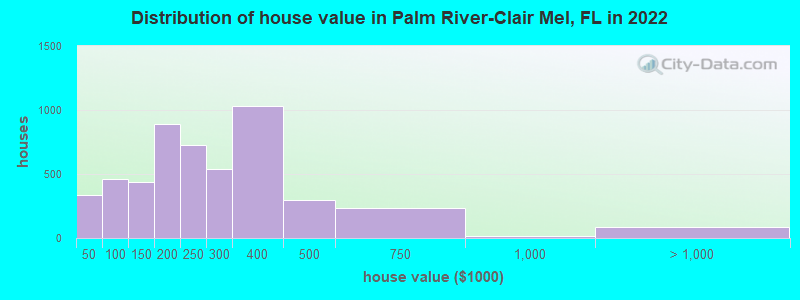
Home value of owner - occupied houses in 2022 in Palm River-Clair Mel, FL
-
- 51Less than $10,000
- 20$10,000 to $14,999
- 8$15,000 to $19,999
- 47$20,000 to $24,999
- 52$25,000 to $29,999
- 63$30,000 to $34,999
- 9$35,000 to $39,999
- 81$40,000 to $49,999
- 8$50,000 to $59,999
- 100$60,000 to $69,999
- 59$70,000 to $79,999
- 146$80,000 to $89,999
- 61$90,000 to $99,999
- 254$100,000 to $124,999
- 182$125,000 to $149,999
- 603$150,000 to $174,999
- 283$175,000 to $199,999
- 725$200,000 to $249,999
- 535$250,000 to $299,999
- 1,031$300,000 to $399,999
- 293$400,000 to $499,999
- 236$500,000 to $749,999
- 17$750,000 to $999,999
- 83$2,000,000 or more
Rent paid by renters in 2022 in Palm River-Clair Mel, FL
-
- 43$150 to $199
- 37$250 to $299
- 14$300 to $349
- 10$400 to $449
- 62$450 to $499
- 20$550 to $599
- 128$600 to $649
- 47$650 to $699
- 63$700 to $749
- 134$750 to $799
- 198$800 to $899
- 307$900 to $999
- 570$1,000 to $1,249
- 513$1,250 to $1,499
- 841$1,500 to $1,999
- 359$2,000 to $2,499
- 36$3,500 or more
- 94No cash rent


Percentage of workers working in this county: 91.2%
Number of people working at home: 2,254 (16.9% of all workers)
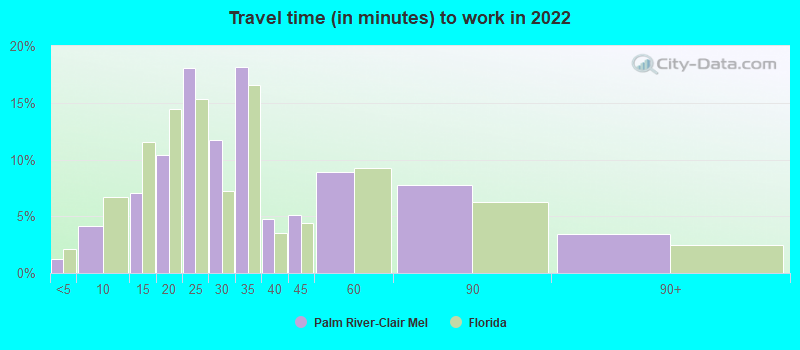
Travel time to work (commute)
- Less than 5 minutes: 154
- 5 to 9 minutes: 571
- 10 to 14 minutes: 1,028
- 15 to 19 minutes: 1,735
- 20 to 24 minutes: 2,247
- 25 to 29 minutes: 701
- 30 to 34 minutes: 1,643
- 35 to 39 minutes: 440
- 40 to 44 minutes: 403
- 45 to 59 minutes: 1,057
- 60 to 89 minutes: 691
- 90 or more minutes: 226
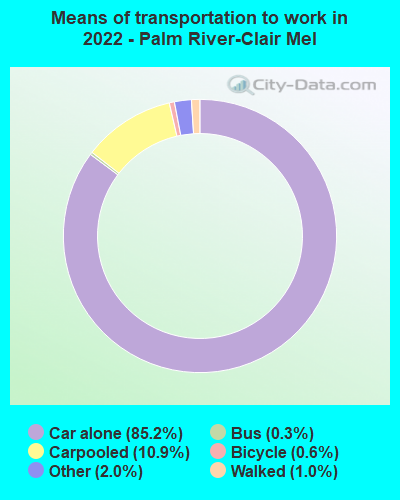
Means of transportation to work:
- Drove a car alone: 7,764 (67.5%)
- Carpooled: 1,134 (9.9%)
- Bus: 20 (0.2%)
- Taxi: 206 (1.8%)
- Bicycle: 59 (0.5%)
- Walked: 88 (0.8%)
- Worked at home: 2,254 (19.6%)

- Unemployment by race in 2022
- Unemployment rate for White non-Hispanic residents
- 3.8%Males
- 2.3%Females
- Unemployment rate for Black residents
- 7.7%Males
- 4.5%Females
- Unemployment rate for American Indian and Alaska Native residents
- 32.9%Females
- Unemployment rate for Asian residents
- 8.2%Males
- Unemployment rate for other race residents
- 4.5%Females
- Unemployment rate for two or more race residents
- 4.5%Males
- 1.0%Females
- Unemployment rate for Hispanic or Latino residents
- 1.9%Males
- 5.7%Females

- Year of entry for the foreign-born population in Palm River-Clair Mel, Florida
- 2,8732010 or later
- 1,2792000 to 2009
- 1,0231990 to 1999
- 6021980 to 1989
- 3361970 to 1979
- 354Before 1970

First ancestries reported:
- American: 1,736 (9.7%)
- Italian: 461 (2.6%)
- Haitian: 398 (2.2%)
- German: 286 (1.6%)
- Jamaican: 246 (1.4%)
- Moroccan: 245 (1.4%)
- English: 193 (1.1%)
- Irish: 151 (0.8%)
- Norwegian: 122 (0.7%)
- Brazilian: 69 (0.4%)
- Cape Verdean: 68 (0.4%)
- African: 52 (0.3%)
- European: 50 (0.3%)
- Hungarian: 43 (0.2%)
- Swedish: 40 (0.2%)
- Lebanese: 31 (0.2%)
- Trinidadian and Tobagonian: 27 (0.2%)
- Ukrainian: 25 (0.1%)
- Scottish: 20 (0.1%)
- Scotch-Irish: 17 (0.10%)
- British: 16 (0.09%)
- French: 14 (0.08%)
- Greek: 14 (0.08%)
- Lithuanian: 9 (0.05%)
- Danish: 5 (0.03%)
Most common places of birth for foreign-born residents (%):
| Palm River-Clair Mel: | 34.7% (1,934) |
| Florida: | 22.0% (1,006,576) |
| Palm River-Clair Mel: | 12.1% (672) |
| Florida: | 3.0% (137,727) |
| Palm River-Clair Mel: | 8.0% (448) |
| Florida: | 5.6% (257,152) |
| Palm River-Clair Mel: | 4.2% (233) |
| Florida: | 5.0% (227,319) |
| Palm River-Clair Mel: | 4.0% (222) |
| Florida: | 7.5% (342,375) |
| Palm River-Clair Mel: | 3.7% (207) |
| Florida: | 5.7% (262,042) |
| Palm River-Clair Mel: | 3.1% (174) |
| Florida: | 6.5% (298,669) |
| Palm River-Clair Mel: | 3.1% (171) |
| Florida: | 2.1% (94,349) |
| Palm River-Clair Mel: | 2.1% (116) |
| Florida: | 0.3% (14,809) |
| Palm River-Clair Mel: | 2.0% (109) |
| Florida: | 0.3% (12,303) |
| Palm River-Clair Mel: | 1.8% (103) |
| Florida: | 1.0% (43,642) |
| Palm River-Clair Mel: | 1.8% (102) |
| Florida: | 1.1% (49,838) |
Place of birth for U.S.-born residents:
- This state: 10,998
- Other state: 7,440
- Northeast: 2,489
- Midwest: 1,785
- South: 2,576
- West: 561
86.4% of Palm River-Clair Mel residents lived in the same house 1 years ago.
Out of people who lived in different houses, 40.3% lived in this county.
Out of people who lived in different counties, 42.6% lived in Florida.
| Palm River-Clair Mel: | 86.4% |
| State average: | 86.3% |
Education attainment for males 25 years and older:
- No schooling: 292
- Nursery to 4th grade: 78
- 5th and 6th grade: 49
- 7th and 8th grade: 160
- 9th grade: 207
- 10th grade: 59
- 11th grade: 293
- 12th grade, no diploma: 195
- High school graduate (or equivalency): 3,100
- Less than 1 year of college: 456
- Some college more than 1 year, no degree: 791
- Associate degree: 921
- Bachelor's degree: 906
- Master's degree: 417
- Professional school degree: 47
- Doctorate degree: 143

Education attainment for females 25 years and older:
- No schooling: 365
- Nursery to 4th grade: 35
- 5th and 6th grade: 183
- 7th and 8th grade: 63
- 9th grade: 32
- 10th grade: 171
- 11th grade: 252
- 12th grade, no diploma: 307
- High school graduate (or equivalency): 2,895
- Less than 1 year of college: 357
- Some college more than 1 year, no degree: 1,101
- Associate degree: 728
- Bachelor's degree: 1,733
- Master's degree: 424
- Professional school degree: 207
- Doctorate degree: 57


Housing units in structures:
- One, detached: 6,576
- One, attached: 868
- Two: 105
- 3 or 4: 420
- 5 to 9: 470
- 10 to 19: 551
- 20 to 49: 492
- 50 or more: 151
- Mobile homes: 811
- Boats, RVs, vans, etc.: 32
Median worth of mobile homes: $73,767
Housing units lacking complete kitchen facilities in 2022: 1.3%
House/condo owner moved in on average 8 years ago
Renter moved in on average 4 years ago

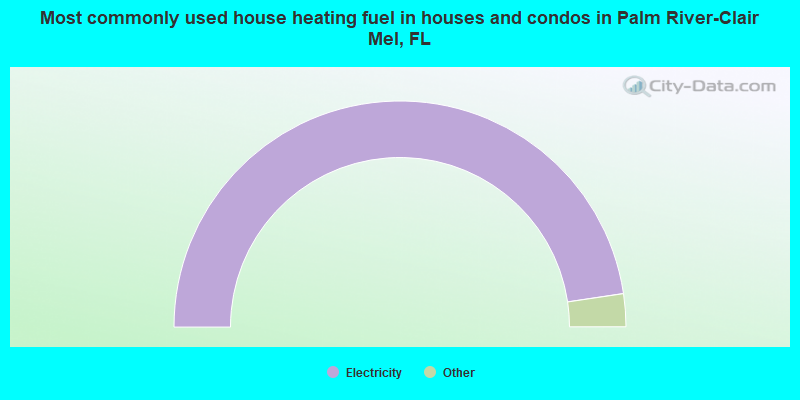
- 95.3%Electricity
- 3.9%Utility gas
- 0.6%No fuel used
- 0.1%Bottled, tank, or LP gas
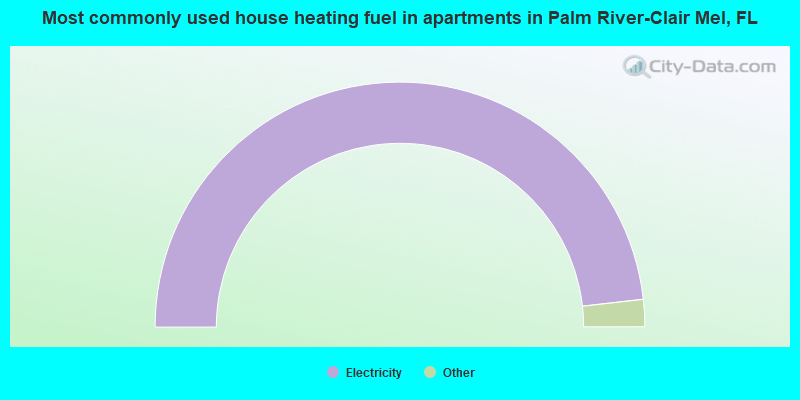
- 96.4%Electricity
- 2.7%Utility gas
- 0.9%No fuel used
Private vs. public school enrollment:
| Here: | 3.4% |
| Florida: | 15.8% |
| Here: | 3.8% |
| Florida: | 12.9% |
| Here: | 11.7% |
| Florida: | 23.6% |


