Oyster Creek, TX (Texas) Houses and Residents
| Oyster Creek: | $179,138 |
| Texas: | $275,400 |
Mean price in 2022:
Detached houses: $170,318
Here: $170,318 State: $369,058 Mobile homes: $181,861
Here: $181,861 State: $124,413
Total population: 1,133 (Urban population: 0, Rural population: 1,200 (7 farm, 1,193 nonfarm))
Houses: 743 (617 occupied: 483 owner occupied, 132 renter occupied)
| % of renters here: | 21% |
| State: | 38% |
Housing density: 392 houses/condos per square mile
Median price asked for vacant for-sale houses and condos in 2022: $143,062.
Median contract rent in 2022: $891 (lower quartile is $714, upper quartile is $1,006)
Median rent asked for vacant for-rent units in 2022: $2,838
Median gross rent in Oyster Creek, TX in 2022: $930
Housing units in Oyster Creek with a mortgage: 287 (5 second mortgage, 0 home equity loan, 8 both second mortgage and home equity loan)
Houses without a mortgage: 150
Median household income for apartments without a mortgage: $33,889
Median monthly housing costs: $911
Compare current foreclosures near Oyster Creek, TX:
| Photo | Address | Area | Beds / Baths | Price | Details |
|---|---|---|---|---|---|

|
#1
W 7th St
Freeport, TX 77541
|
1,046 sq. feet
|
1 baths 3 beds |
$62,400
|
show details |

|
#2
Southern Oaks Dr
Lake Jackson, TX 77566
|
- sq. feet
|
1 baths 2 beds |
show details | |

|
#3
Acacia St
Lake Jackson, TX 77566
|
1,256 sq. feet
|
1 baths 3 beds |
show details | |

|
#4
Gardenia St
Lake Jackson, TX 77566
|
1,257 sq. feet
|
2 baths 4 beds |
show details | |

|
#5
Colony Sq
Angleton, TX 77515
|
3,295 sq. feet
|
3 baths 5 beds |
show details | |

|
#6
Crocus St
Lake Jackson, TX 77566
|
2,102 sq. feet
|
2 baths 4 beds |
show details | |

|
#7
N Oak St
Clute, TX 77531
|
1,192 sq. feet
|
1 baths 3 beds |
show details | |

|
#8
Tangerine Ct
Lake Jackson, TX 77566
|
1,722 sq. feet
|
1 baths 3 beds |
show details | |

|
#9
June Ct
Clute, TX 77531
|
2,091 sq. feet
|
2 baths 4 beds |
show details | |

|
#10
N Ave D
Freeport, TX 77541
|
1,511 sq. feet
|
2 baths 3 beds |
show details |
| Photo | Address | Area | Beds / Baths | Price | Details |
|---|---|---|---|---|---|

|
#11
N Ave N
Freeport, TX 77541
|
1,143 sq. feet
|
2 baths 3 beds |
show details | |

|
#12
County Road 243
Angleton, TX 77515
|
1,064 sq. feet
|
1 baths 3 beds |
show details | |

|
#13
N Avenue O
Freeport, TX 77541
|
1,230 sq. feet
|
5 baths - beds |
show details | |

|
#14
S Avenue D
Freeport, TX 77541
|
1,032 sq. feet
|
5 baths - beds |
show details | |

|
#15
County Road 868d
Brazoria, TX 77422
|
1,634 sq. feet
|
1 baths - beds |
show details | |

|
#16
Pyburn St
Angleton, TX 77515
|
1,248 sq. feet
|
1 baths - beds |
show details | |

|
#17
Cypress St
Lake Jackson, TX 77566
|
- sq. feet
|
5 baths - beds |
show details | |

|
#18
County Road 233
Angleton, TX 77515
|
1,216 sq. feet
|
- baths - beds |
show details | |

|
#19
Vine Dr
Angleton, TX 77515
|
1,463 sq. feet
|
2 baths - beds |
show details | |

|
#20
Crocus St
Lake Jackson, TX 77566
|
2,102 sq. feet
|
2 baths - beds |
show details |
| Photo | Address | Area | Beds / Baths | Price | Details |
|---|---|---|---|---|---|

|
#21
Strawberry Dr
Lake Jackson, TX 77566
|
2,276 sq. feet
|
2 baths - beds |
show details | |

|
#22
Mango St
Lake Jackson, TX 77566
|
1,427 sq. feet
|
2 baths - beds |
show details | |

|
#23
Almond Dr
Lake Jackson, TX 77566
|
1,525 sq. feet
|
2 baths - beds |
show details | |

|
#24
Tulip Trl
Lake Jackson, TX 77566
|
1,717 sq. feet
|
2 baths - beds |
show details | |

|
#25
Edgewater St
Clute, TX 77531
|
1,027 sq. feet
|
1 baths - beds |
show details | |

|
#26
Farrer St
Angleton, TX 77515
|
1,949 sq. feet
|
1 baths - beds |
show details | |

|
#27
Oyster Creek Bnd
Freeport, TX 77541
|
896 sq. feet
|
1 baths - beds |
show details | |

|
#28
County Road 210
Angleton, TX 77515
|
1,344 sq. feet
|
1 baths - beds |
show details | |

|
#29
Sexto St
Brazoria, TX 77422
|
1,580 sq. feet
|
2 baths - beds |
show details | |

|
#30
Branding Iron
Angleton, TX 77515
|
1,660 sq. feet
|
2 baths - beds |
show details |
| Photo | Address | Area | Beds / Baths | Price | Details |
|---|---|---|---|---|---|

|
#31
Avenue D
Danbury, TX 77534
|
1,010 sq. feet
|
1 baths - beds |
show details | |

|
#32
Red Oak Cir
Brazoria, TX 77422
|
1,392 sq. feet
|
2 baths - beds |
show details | |

|
#33
Masonic Oak Dr
Brazoria, TX 77422
|
2,036 sq. feet
|
2 baths - beds |
show details | |

|
#34
N Ranch House Rd
Angleton, TX 77515
|
2,547 sq. feet
|
4 baths - beds |
show details | |

|
#35
S Market St
Brazoria, TX 77422
|
1,750 sq. feet
|
1 baths - beds |
show details | |

|
#36
Avenue G
Brazoria, TX 77422
|
2,060 sq. feet
|
1 baths - beds |
show details | |

|
#37
E Miller St
Angleton, TX 77515
|
1,640 sq. feet
|
1 baths - beds |
show details | |

|
#38
Finch Ln
Angleton, TX 77515
|
1,638 sq. feet
|
2 baths - beds |
show details | |

|
#39
N Kaysie St
Angleton, TX 77515
|
1,355 sq. feet
|
2 baths - beds |
show details | |

|
#40
Lorrain St
Angleton, TX 77515
|
1,352 sq. feet
|
2 baths - beds |
show details |
| Photo | Address | Area | Beds / Baths | Price | Details |
|---|---|---|---|---|---|

|
#41
N Tinsley St
Angleton, TX 77515
|
1,644 sq. feet
|
2 baths - beds |
show details | |

|
#42
Higgins St
Angleton, TX 77515
|
800 sq. feet
|
1 baths - beds |
show details | |

|
#43
County Road 201
Angleton, TX 77515
|
2,150 sq. feet
|
3 baths - beds |
show details | |

|
#44
Akers St
Angleton, TX 77515
|
1,215 sq. feet
|
1 baths - beds |
show details | |

|
#45
Huckleberry Dr
Lake Jackson, TX 77566
|
2,918 sq. feet
|
2 baths - beds |
show details | |

|
#46
Beechwood St
Lake Jackson, TX 77566
|
1,489 sq. feet
|
2 baths - beds |
show details | |

|
#47
Caladium St
Lake Jackson, TX 77566
|
1,694 sq. feet
|
1 baths - beds |
show details | |

|
#48
N Avenue N
Freeport, TX 77541
|
1,694 sq. feet
|
2 baths - beds |
show details | |

|
#49
N Avenue G
Freeport, TX 77541
|
1,464 sq. feet
|
1 baths - beds |
show details | |

|
Check over 1 million property listings on Foreclosure.com!
|
browse all offers | |||


Median year apartment built: 1987
Household type by relationship:
Households: 1,253- Male householders: 381 (235 living alone), Female householders: 225 (35 living alone)
151 spouses (151 opposite-sex spouses), 37 unmarried partners, (37 opposite-sex unmarried partners), 269 children (264 natural, 0 adopted, 5 stepchildren), 75 grandchildren, 53 brothers or sisters, 13 parents, 0 foster children, 7 other relatives, 30 non-relatives
- In group quarters: 8
Size of family households: 192 2-persons, 63 3-persons, 30 4-persons, 21 5-persons, 6 6-persons.
Size of nonfamily households: 279 1-person, 19 2-persons, 5 3-persons, 12 4-persons.
37 married couples with children.
79 single-parent households (0 men, 79 women).
78.3% of residents of Oyster Creek speak English at home.
21.5% of residents speak Spanish at home (66% speak English very well, 17% speak English well, 16% speak English not well).
0.4% of residents speak other Indo-European language at home (100% speak English very well).
Foreign born population: 47 (3.8%)
(78.7% of them are naturalized citizens)
| Here: | 4.5 |
| State: | 6.3 |
| Here: | 3.9 |
| State: | 4.0 |

- Bedrooms in owner-occupied houses and condos in Oyster Creek, Texas
- 0no bedroom
- 161 bedroom
- 942 bedrooms
- 3363 bedrooms
- 394 bedrooms
- 05+ bedrooms

- Bedrooms in renter-occupied apartments in Oyster Creek, Texas
- 32no bedroom
- 171 bedroom
- 392 bedrooms
- 433 bedrooms
- 24 bedrooms
- 05+ bedrooms

- Cars and other vehicles available in Oyster Creek in owner-occupied houses/condos
- 18no vehicle
- 801 vehicle
- 2422 vehicles
- 1063 vehicles
- 174 vehicles
- 215+ vehicles

- Cars and other vehicles available in Oyster Creek in renter-occupied apartments
- 0no vehicle
- 951 vehicle
- 362 vehicles
- 03 vehicles
- 24 vehicles
- 05+ vehicles

- Rooms in owner-occupied houses in Oyster Creek, Texas
- 01 room
- 02 rooms
- 143 rooms
- 2174 rooms
- 1025 rooms
- 936 rooms
- 247 rooms
- 258 rooms
- 99+ rooms

- Rooms in renter-occupied apartments in Oyster Creek, Texas
- 321 room
- 172 rooms
- 43 rooms
- 354 rooms
- 255 rooms
- 76 rooms
- 07 rooms
- 138 rooms
- 09+ rooms


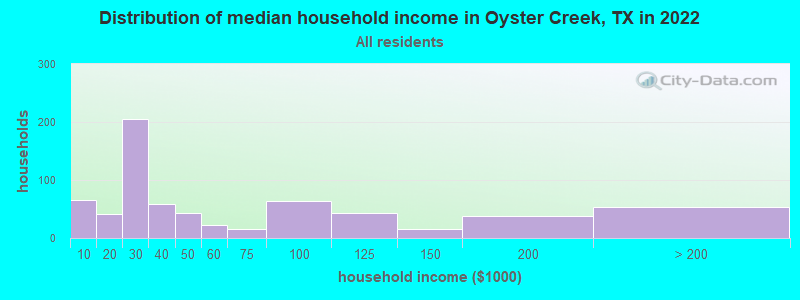
Oyster Creek, TX household income distribution

- 65Less than $10,000
- 41$10,000 to $19,999
- 206$20,000 to $29,999
- 59$30,000 to $39,999
- 43$40,000 to $49,999
- 22$50,000 to $59,999
- 16$60,000 to $74,999
- 63$75,000 to $99,999
- 43$100,000 to $124,999
- 15$125,000 to $149,999
- 38$150,000 to $199,999
- 53$200,000 or more
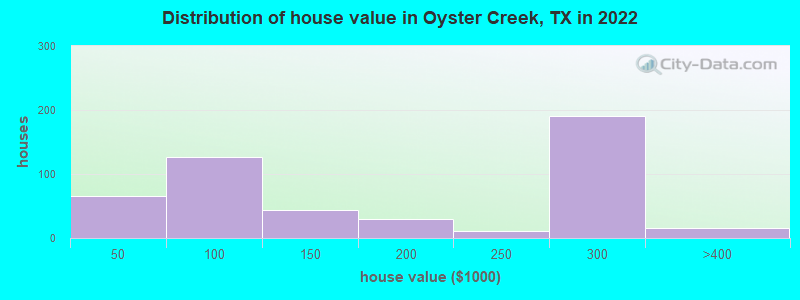
Home value of owner - occupied houses in 2022 in Oyster Creek, TX
-
- 10Less than $10,000
- 2$10,000 to $14,999
- 9$15,000 to $19,999
- 8$25,000 to $29,999
- 28$30,000 to $34,999
- 6$40,000 to $49,999
- 14$50,000 to $59,999
- 68$60,000 to $69,999
- 34$80,000 to $89,999
- 3$90,000 to $99,999
- 33$100,000 to $124,999
- 10$125,000 to $149,999
- 10$150,000 to $174,999
- 20$175,000 to $199,999
- 10$200,000 to $249,999
- 191$250,000 to $299,999
- 16$300,000 to $399,999
Rent paid by renters in 2022 in Oyster Creek, TX
-
- 7$450 to $499
- 2$550 to $599
- 4$650 to $699
- 14$700 to $749
- 14$750 to $799
- 35$900 to $999
- 6$1,000 to $1,249
- 14$1,250 to $1,499
- 22No cash rent


Percentage of workers working in this county: 91.1%
Number of people working at home: 6 (1.1% of all workers)
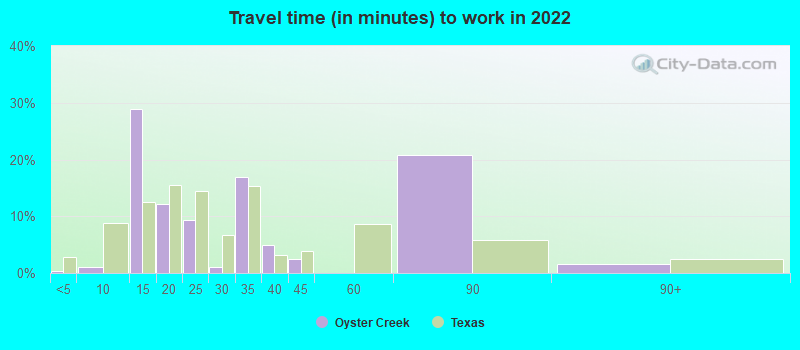
Travel time to work (commute)
- Less than 5 minutes: 3
- 5 to 9 minutes: 6
- 10 to 14 minutes: 139
- 15 to 19 minutes: 201
- 20 to 24 minutes: 67
- 25 to 29 minutes: 12
- 30 to 34 minutes: 46
- 35 to 39 minutes: 0
- 40 to 44 minutes: 0
- 45 to 59 minutes: 30
- 60 to 89 minutes: 10
- 90 or more minutes: 0
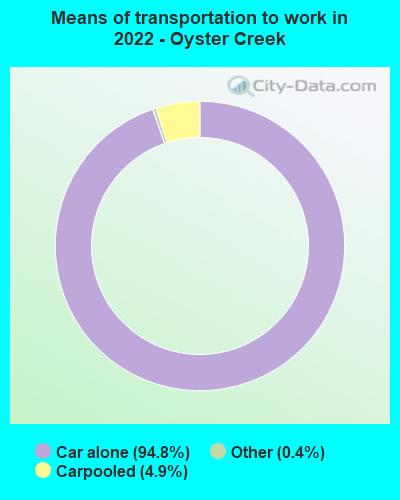
Means of transportation to work:
- Drove a car alone: 1,033 (89.8%)
- Carpooled: 63 (5.5%)
- Taxi: 5 (0.4%)
- Worked at home: 6 (0.5%)

- Unemployment by race in 2022
- Unemployment rate for White non-Hispanic residents
- 17.0%Males
- 3.9%Females
- Unemployment rate for Hispanic or Latino residents
- 17.0%Females

- Year of entry for the foreign-born population in Oyster Creek, Texas
- 02010 or later
- 02000 to 2009
- 151990 to 1999
- 181980 to 1989
- 191970 to 1979
- 14Before 1970

First ancestries reported:
- American: 185 (30.0%)
- English: 66 (10.7%)
- Irish: 16 (2.6%)
- Cajun: 7 (1.1%)
- Scottish: 5 (0.8%)
- Eastern European: 3 (0.5%)
- Scotch-Irish: 3 (0.5%)
- Syrian: 2 (0.3%)
- Czech: 2 (0.3%)
- German: 2 (0.3%)
Most common places of birth for foreign-born residents (%):
| Oyster Creek: | 63.3% (31) |
| Texas: | 0.4% (18,642) |
| Oyster Creek: | 30.6% (15) |
| Texas: | 48.4% (2,411,723) |
| Oyster Creek: | 10.2% (5) |
| Texas: | 0.1% (4,334) |
| Oyster Creek: | 2.0% (1) |
| Texas: | 0.8% (37,989) |
Place of birth for U.S.-born residents:
- This state: 901
- Other state: 311
- Northeast: 10
- Midwest: 121
- South: 91
- West: 109
93.7% of Oyster Creek residents lived in the same house 1 years ago.
Out of people who lived in different houses, 46.1% lived in this county.
Out of people who lived in different counties, 0.0% lived in Texas.
| Oyster Creek: | 93.7% |
| State average: | 85.7% |
Education attainment for males 25 years and older:
- No schooling: 66
- Nursery to 4th grade: 11
- 5th and 6th grade: 0
- 7th and 8th grade: 42
- 9th grade: 0
- 10th grade: 4
- 11th grade: 3
- 12th grade, no diploma: 32
- High school graduate (or equivalency): 164
- Less than 1 year of college: 18
- Some college more than 1 year, no degree: 122
- Associate degree: 35
- Bachelor's degree: 21
- Master's degree: 0
- Professional school degree: 0
- Doctorate degree: 0

Education attainment for females 25 years and older:
- No schooling: 11
- Nursery to 4th grade: 0
- 5th and 6th grade: 0
- 7th and 8th grade: 17
- 9th grade: 0
- 10th grade: 17
- 11th grade: 7
- 12th grade, no diploma: 4
- High school graduate (or equivalency): 166
- Less than 1 year of college: 29
- Some college more than 1 year, no degree: 68
- Associate degree: 24
- Bachelor's degree: 0
- Master's degree: 10
- Professional school degree: 0
- Doctorate degree: 0


Housing units in structures:
- One, detached: 325
- 3 or 4: 16
- 5 to 9: 15
- 10 to 19: 14
- Mobile homes: 370
Housing units lacking complete kitchen facilities in 2022: 7.2%
House/condo owner moved in on average 5 years ago
Renter moved in on average 6 years ago

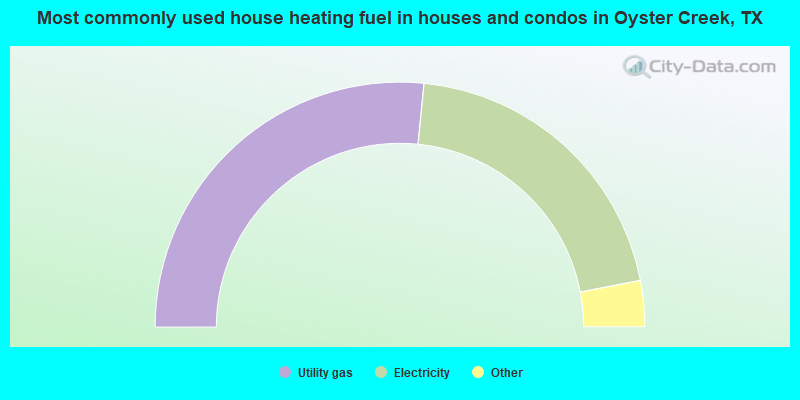
- 53.3%Utility gas
- 40.9%Electricity
- 3.7%No fuel used
- 1.7%Bottled, tank, or LP gas
- 0.4%Wood
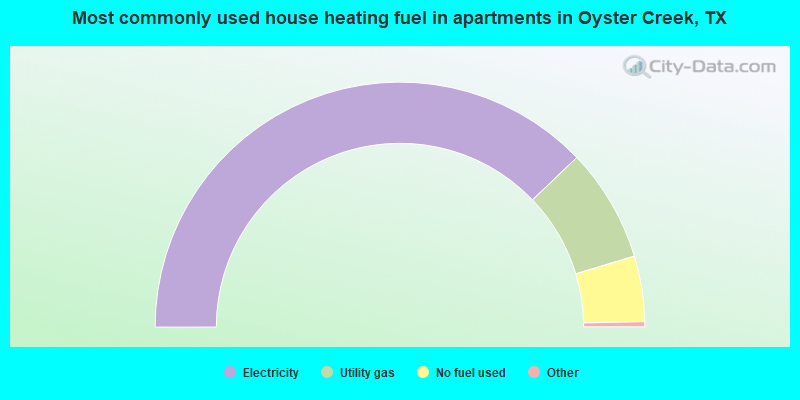
- 76.2%Electricity
- 15.1%Utility gas
- 8.7%No fuel used
Private vs. public school enrollment:
| Here: | 0.0% |
| Texas: | 8.8% |
| Here: | 0.0% |
| Texas: | 8.0% |
| Here: | 15.1% |
| Texas: | 16.2% |


