Ottumwa, IA (Iowa) Houses and Residents
| Ottumwa: | $95,157 |
| Iowa: | $194,600 |
Mean price in 2022:
Detached houses: $140,590
Here: $140,590 State: $245,224 Townhouses or other attached units: $219,986
Here: $219,986 State: $238,767 In 5-or-more-unit structures: $158,758
Here: $158,758 State: $190,519 Mobile homes: $105,153
Here: $105,153 State: $51,271
Total population: 24,682 (Urban population: 24,277 (all inside urban clusters), Rural population: 647 (9 farm, 638 nonfarm))
Houses: 11,541 (10,354 occupied: 6,203 owner occupied, 4,320 renter occupied)
| % of renters here: | 41% |
| State: | 28% |
Housing density: 730 houses/condos per square mile
Median price asked for vacant for-sale houses and condos in 2022: $112,155.
Median contract rent in 2022: $645 (lower quartile is $525, upper quartile is $845)
Median rent asked for vacant for-rent units in 2022: $697
Median gross rent in Ottumwa, IA in 2022: $891
Housing units in Ottumwa with a mortgage: 3,374 (261 second mortgage, 9 home equity loan, 206 both second mortgage and home equity loan)
Houses without a mortgage: 31
Median household income for houses/condos with a mortgage: $82,403
Median household income for apartments without a mortgage: $53,896
Median monthly housing costs: $830
Compare current foreclosures near Ottumwa, IA:
| Photo | Address | Area | Beds / Baths | Price | Details |
|---|---|---|---|---|---|

|
#1
W Park Ave
Ottumwa, IA 52501
|
2,088 sq. feet
|
3 baths 4 beds |
$279,900
|
show details |

|
#2
Angle Rd
Ottumwa, IA 52501
|
1,720 sq. feet
|
1 baths 4 beds |
$309,900
|
show details |

|
#3
N Ransom St
Ottumwa, IA 52501
|
936 sq. feet
|
1 baths 2 beds |
show details | |

|
#4
Lillian St
Ottumwa, IA 52501
|
640 sq. feet
|
1 baths 1 beds |
show details | |

|
#5
Birchwood Dr
Ottumwa, IA 52501
|
2,324 sq. feet
|
6 baths 4 beds |
show details | |

|
#6
Clayton St
Ottumwa, IA 52501
|
975 sq. feet
|
1 baths 3 beds |
show details | |

|
#7
Greenwood Dr
Ottumwa, IA 52501
|
1,080 sq. feet
|
1 baths 2 beds |
show details | |

|
#8
Taft Ave
Ottumwa, IA 52501
|
884 sq. feet
|
2 baths 2 beds |
show details | |

|
#9
Pennsylvania Ave
Ottumwa, IA 52501
|
2,793 sq. feet
|
3 baths 4 beds |
show details | |

|
#10
Bladensburg Rd
Ottumwa, IA 52501
|
1,536 sq. feet
|
1 baths 3 beds |
show details |
| Photo | Address | Area | Beds / Baths | Price | Details |
|---|---|---|---|---|---|

|
#11
S Sheridan Ave
Ottumwa, IA 52501
|
1,316 sq. feet
|
1 baths 3 beds |
show details | |

|
#12
Highland Center Rd
Ottumwa, IA 52501
|
- sq. feet
|
- baths - beds |
show details | |

|
#13
E 2nd St Ste 201
Ottumwa, IA 52501
|
- sq. feet
|
- baths - beds |
show details | |

|
#14
S James St
Ottumwa, IA 52501
|
- sq. feet
|
- baths - beds |
show details | |

|
#15
S Davis St
Ottumwa, IA 52501
|
- sq. feet
|
- baths - beds |
show details | |

|
#16
S Moore St
Ottumwa, IA 52501
|
- sq. feet
|
- baths - beds |
show details | |

|
#17
140th Ave
Ottumwa, IA 52501
|
- sq. feet
|
- baths - beds |
show details | |

|
#18
S Iowa Ave
Ottumwa, IA 52501
|
- sq. feet
|
- baths - beds |
show details | |

|
#19
Queen Anne Ave
Ottumwa, IA 52501
|
- sq. feet
|
- baths - beds |
show details | |

|
#20
E Rochester Rd
Ottumwa, IA 52501
|
- sq. feet
|
- baths - beds |
show details |
| Photo | Address | Area | Beds / Baths | Price | Details |
|---|---|---|---|---|---|

|
#21
91st Ave
Ottumwa, IA 52501
|
- sq. feet
|
- baths - beds |
show details | |

|
#22
Castle St
Ottumwa, IA 52501
|
- sq. feet
|
- baths - beds |
show details | |

|
#23
Grandview Ave
Ottumwa, IA 52501
|
- sq. feet
|
- baths - beds |
show details | |

|
#24
S Ward St
Ottumwa, IA 52501
|
- sq. feet
|
- baths - beds |
show details | |

|
#25
W Williams St
Ottumwa, IA 52501
|
- sq. feet
|
- baths - beds |
show details | |

|
#26
Lupine Trl
Bloomfield, IA 52537
|
1,548 sq. feet
|
4 baths 3 beds |
show details | |

|
#27
K D Ave # 43
Eldon, IA 52554
|
- sq. feet
|
- baths - beds |
show details | |

|
#28
E Main St, Trlr 13
Fremont, IA 52561
|
- sq. feet
|
- baths - beds |
show details | |

|
#29
N Miles St # 9
Fremont, IA 52561
|
- sq. feet
|
- baths - beds |
show details | |

|
#30
734th Ave
Eddyville, IA 52553
|
- sq. feet
|
- baths - beds |
show details |
| Photo | Address | Area | Beds / Baths | Price | Details |
|---|---|---|---|---|---|

|
Check over 1 million property listings on Foreclosure.com!
|
browse all offers | |||
| Photo | Address | Area | Beds / Baths | Price | Details |
|---|

Latest news about housing in Ottumwa, IA collected exclusively by city-data.com from local newspapers, TV, and radio stations

 | Driving I-80 across Iowa question (34 replies) |
| looks like we're moving to Centerville (9 replies) |
| Bettendorf, IA- one of the 10 best towns for families (9 replies) |
| Ames, Cedar Rapids, or Dubuque: Which one is the best city for blue-collar jobs? (3 replies) |
| Moving to Ottumwa (5 replies) |
| Repurposing buildings in Iowa cities & towns.. (6 replies) |

Median year apartment built: 1966
Household type by relationship:
Households: 25,451- Male householders: 4,747 (1,577 living alone), Female householders: 5,491 (1,616 living alone)
3,967 spouses (3,949 opposite-sex spouses), 1,027 unmarried partners, (1,022 opposite-sex unmarried partners), 6,826 children (6,418 natural, 58 adopted, 350 stepchildren), 818 grandchildren, 195 brothers or sisters, 465 parents, 7 foster children, 234 other relatives, 883 non-relatives
- In group quarters: 785
Size of family households: 3,109 2-persons, 1,378 3-persons, 996 4-persons, 618 5-persons, 189 6-persons, 205 7-or-more-persons.
Size of nonfamily households: 3,321 1-person, 586 2-persons, 104 3-persons, 20 5-persons.
2,628 married couples with children.
2,167 single-parent households (460 men, 1,707 women).
84.1% of residents of Ottumwa speak English at home.
10.0% of residents speak Spanish at home (52% speak English very well, 18% speak English well, 22% speak English not well, 8% don't speak English at all).
1.4% of residents speak other Indo-European language at home (59% speak English very well, 41% speak English well).
3.2% of residents speak Asian or Pacific Island language at home (55% speak English very well, 10% speak English well, 31% speak English not well, 4% don't speak English at all).
1.3% of residents speak other language at home (28% speak English very well, 59% speak English well, 13% speak English not well).
Foreign born population: 3,034 (11.9%)
(44.0% of them are naturalized citizens)
| Here: | 6.0 |
| State: | 6.8 |
| Here: | 4.5 |
| State: | 4.2 |

- Bedrooms in owner-occupied houses and condos in Ottumwa, Iowa
- 12no bedroom
- 2711 bedroom
- 2,0822 bedrooms
- 2,7093 bedrooms
- 8474 bedrooms
- 2825+ bedrooms

- Bedrooms in renter-occupied apartments in Ottumwa, Iowa
- 237no bedroom
- 7041 bedroom
- 2,2252 bedrooms
- 8403 bedrooms
- 2524 bedrooms
- 635+ bedrooms

- Cars and other vehicles available in Ottumwa in owner-occupied houses/condos
- 161no vehicle
- 1,5661 vehicle
- 2,6362 vehicles
- 1,0553 vehicles
- 4804 vehicles
- 3055+ vehicles

- Cars and other vehicles available in Ottumwa in renter-occupied apartments
- 706no vehicle
- 2,1881 vehicle
- 1,1272 vehicles
- 1853 vehicles
- 974 vehicles
- 195+ vehicles

- Rooms in owner-occupied houses in Ottumwa, Iowa
- 121 room
- 422 rooms
- 1173 rooms
- 9214 rooms
- 1,4775 rooms
- 1,3606 rooms
- 7557 rooms
- 7028 rooms
- 8179+ rooms

- Rooms in renter-occupied apartments in Ottumwa, Iowa
- 2281 room
- 1942 rooms
- 6093 rooms
- 1,1854 rooms
- 1,0285 rooms
- 5416 rooms
- 1627 rooms
- 1568 rooms
- 2199+ rooms


Ottumwa, IA household income distribution

- 666Less than $10,000
- 1,149$10,000 to $19,999
- 1,120$20,000 to $29,999
- 891$30,000 to $39,999
- 1,160$40,000 to $49,999
- 1,039$50,000 to $59,999
- 1,007$60,000 to $74,999
- 1,246$75,000 to $99,999
- 771$100,000 to $124,999
- 479$125,000 to $149,999
- 776$150,000 to $199,999
- 281$200,000 or more
Home value of owner - occupied houses in 2022 in Ottumwa, IA
-
- 145Less than $10,000
- 148$10,000 to $14,999
- 73$15,000 to $19,999
- 70$20,000 to $24,999
- 84$25,000 to $29,999
- 31$30,000 to $34,999
- 55$35,000 to $39,999
- 350$40,000 to $49,999
- 516$50,000 to $59,999
- 458$60,000 to $69,999
- 561$70,000 to $79,999
- 535$80,000 to $89,999
- 291$90,000 to $99,999
- 512$100,000 to $124,999
- 482$125,000 to $149,999
- 530$150,000 to $174,999
- 218$175,000 to $199,999
- 293$200,000 to $249,999
- 201$250,000 to $299,999
- 135$300,000 to $399,999
- 96$400,000 to $499,999
- 74$500,000 to $749,999
Rent paid by renters in 2022 in Ottumwa, IA
-
- 43Less than $100
- 16$150 to $199
- 96$200 to $249
- 151$250 to $299
- 52$300 to $349
- 103$350 to $399
- 136$400 to $449
- 170$450 to $499
- 365$500 to $549
- 289$550 to $599
- 593$600 to $649
- 351$650 to $699
- 379$700 to $749
- 224$750 to $799
- 298$800 to $899
- 429$900 to $999
- 298$1,000 to $1,249
- 39$1,250 to $1,499
- 4$1,500 to $1,999
- 18$2,000 to $2,499
- 11$2,500 to $2,999
- 39$3,500 or more
- 106No cash rent


Percentage of workers working in this county: 83.3%
Number of people working at home: 473 (3.9% of all workers)
Travel time to work (commute)
- Less than 5 minutes: 917
- 5 to 9 minutes: 2,955
- 10 to 14 minutes: 2,634
- 15 to 19 minutes: 1,861
- 20 to 24 minutes: 619
- 25 to 29 minutes: 485
- 30 to 34 minutes: 776
- 35 to 39 minutes: 198
- 40 to 44 minutes: 161
- 45 to 59 minutes: 239
- 60 to 89 minutes: 250
- 90 or more minutes: 290
Means of transportation to work:
- Drove a car alone: 11,639 (81.2%)
- Carpooled: 1,522 (10.6%)
- Bus: 110 (0.8%)
- Ferryboat: 10 (0.1%)
- Taxi: 212 (1.5%)
- Walked: 181 (1.3%)
- Worked at home: 473 (3.3%)

- Unemployment by race in 2022
- Unemployment rate for White non-Hispanic residents
- 3.2%Males
- 3.0%Females
- Unemployment rate for Black residents
- 10.2%Males
- 27.8%Females
- Unemployment rate for American Indian and Alaska Native residents
- 14.0%Males
- Unemployment rate for Asian residents
- 11.6%Males
- Unemployment rate for other race residents
- 0.8%Males
- 3.1%Females
- Unemployment rate for Hispanic or Latino residents
- 1.0%Males
- 2.0%Females

- Year of entry for the foreign-born population in Ottumwa, Iowa
- 1,4772010 or later
- 7762000 to 2009
- 3771990 to 1999
- 1341980 to 1989
- 781970 to 1979
- 60Before 1970

First ancestries reported:
- English: 2,070 (16.0%)
- American: 1,755 (13.5%)
- German: 1,607 (12.4%)
- Irish: 612 (4.7%)
- African: 322 (2.5%)
- Dutch: 280 (2.2%)
- Swedish: 266 (2.1%)
- Scottish: 186 (1.4%)
- Sudanese: 174 (1.3%)
- Italian: 101 (0.8%)
- European: 87 (0.7%)
- Northern European: 77 (0.6%)
- Norwegian: 75 (0.6%)
- Greek: 71 (0.5%)
- British: 55 (0.4%)
- Macedonian: 55 (0.4%)
- Moroccan: 51 (0.4%)
- Scotch-Irish: 48 (0.4%)
- Haitian: 36 (0.3%)
- French: 29 (0.2%)
- Belgian: 24 (0.2%)
- Czech: 23 (0.2%)
- Jamaican: 20 (0.2%)
- French Canadian: 15 (0.1%)
- Slovak: 9 (0.07%)
- Eastern European: 8 (0.06%)
- Russian: 8 (0.06%)
- Danish: 6 (0.05%)
- Slavic: 4 (0.03%)
- Welsh: 4 (0.03%)
- Pennsylvania German: 3 (0.02%)
- Egyptian: 1 (0.01%)
Most common places of birth for foreign-born residents (%):
| Ottumwa: | 27.6% (801) |
| Iowa: | 23.3% (41,625) |
| Ottumwa: | 8.3% (241) |
| Iowa: | 2.6% (4,675) |
| Ottumwa: | 6.4% (186) |
| Iowa: | 2.8% (4,967) |
| Ottumwa: | 5.6% (163) |
| Iowa: | 0.7% (1,305) |
| Ottumwa: | 5.3% (153) |
| Iowa: | 0.4% (676) |
| Ottumwa: | 4.0% (116) |
| Iowa: | 0.8% (1,342) |
| Ottumwa: | 3.7% (107) |
| Iowa: | 2.3% (4,084) |
| Ottumwa: | 3.2% (93) |
| Iowa: | 1.0% (1,858) |
| Ottumwa: | 3.0% (88) |
| Iowa: | 2.1% (3,735) |
| Ottumwa: | 3.0% (87) |
| Iowa: | 6.2% (11,148) |
| Ottumwa: | 2.7% (78) |
| Iowa: | 0.2% (269) |
| Ottumwa: | 2.7% (77) |
| Iowa: | 0.5% (898) |
| Ottumwa: | 2.2% (65) |
| Iowa: | 0.2% (442) |
| Ottumwa: | 2.2% (63) |
| Iowa: | 2.1% (3,682) |
| Ottumwa: | 1.9% (56) |
| Iowa: | 1.7% (2,949) |
| Ottumwa: | 1.9% (56) |
| Iowa: | 3.2% (5,672) |
| Ottumwa: | 1.9% (56) |
| Iowa: | 0.3% (500) |
| Ottumwa: | 1.8% (52) |
| Iowa: | 0.1% (213) |
| Ottumwa: | 1.7% (48) |
| Iowa: | 2.5% (4,514) |
| Ottumwa: | 1.6% (47) |
| Iowa: | 0.7% (1,204) |
Place of birth for U.S.-born residents:
- This state: 17,994
- Other state: 4,471
- Northeast: 203
- Midwest: 2,164
- South: 800
- West: 1,319
84.9% of Ottumwa residents lived in the same house 1 years ago.
Out of people who lived in different houses, 39.3% lived in this county.
Out of people who lived in different counties, 77.2% lived in Iowa.
| Ottumwa: | 84.9% |
| State average: | 87.2% |
Education attainment for males 25 years and older:
- No schooling: 127
- Nursery to 4th grade: 7
- 5th and 6th grade: 173
- 7th and 8th grade: 131
- 9th grade: 74
- 10th grade: 169
- 11th grade: 190
- 12th grade, no diploma: 395
- High school graduate (or equivalency): 3,082
- Less than 1 year of college: 738
- Some college more than 1 year, no degree: 1,130
- Associate degree: 818
- Bachelor's degree: 728
- Master's degree: 447
- Professional school degree: 142
- Doctorate degree: 55

Education attainment for females 25 years and older:
- No schooling: 243
- Nursery to 4th grade: 18
- 5th and 6th grade: 32
- 7th and 8th grade: 167
- 9th grade: 43
- 10th grade: 136
- 11th grade: 84
- 12th grade, no diploma: 202
- High school graduate (or equivalency): 3,007
- Less than 1 year of college: 595
- Some college more than 1 year, no degree: 834
- Associate degree: 1,048
- Bachelor's degree: 1,347
- Master's degree: 664
- Professional school degree: 107
- Doctorate degree: 69


Housing units in structures:
- One, detached: 8,772
- One, attached: 162
- Two: 334
- 3 or 4: 502
- 5 to 9: 500
- 10 to 19: 422
- 20 to 49: 242
- 50 or more: 307
- Mobile homes: 296
Median worth of mobile homes: $17,021
Housing units lacking complete kitchen facilities in 2022: 3.5%
House/condo owner moved in on average 13 years ago
Renter moved in on average 3 years ago

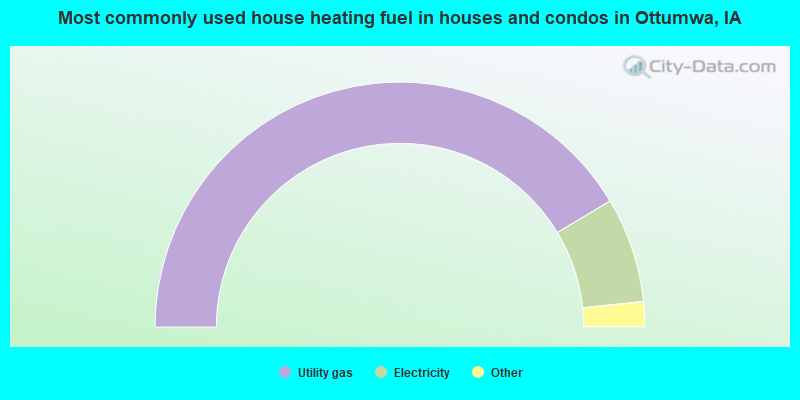
- 82.8%Utility gas
- 13.9%Electricity
- 1.8%Bottled, tank, or LP gas
- 1.1%No fuel used
- 0.2%Wood
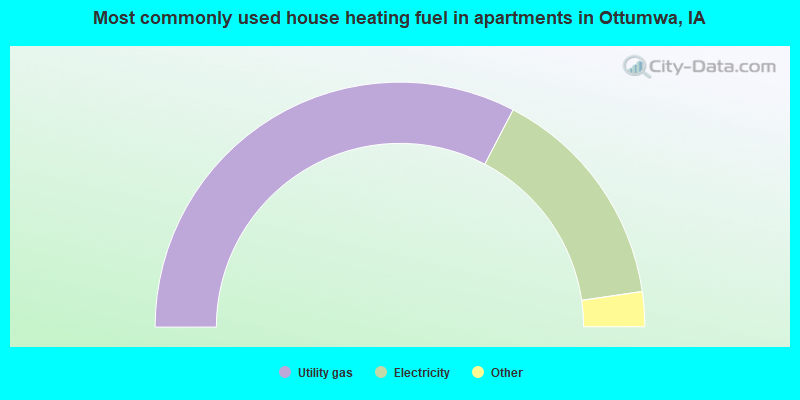
- 65.3%Utility gas
- 30.1%Electricity
- 2.1%No fuel used
- 1.3%Bottled, tank, or LP gas
- 1.2%Other fuel
Private vs. public school enrollment:
| Here: | 6.5% |
| Iowa: | 10.6% |
| Here: | 0.8% |
| Iowa: | 7.9% |
| Here: | 6.8% |
| Iowa: | 23.9% |


