Ortonville, MI (Michigan) Houses and Residents
| Ortonville: | $245,260 |
| Michigan: | $224,400 |
Mean price in 2022:
Detached houses: $240,141
Here: $240,141 State: $280,038 Townhouses or other attached units: $208,545
Here: $208,545 State: $239,520
Total population: 1,467 (All urban)
Houses: 542 (512 occupied: 375 owner occupied, 137 renter occupied)
| % of renters here: | 27% |
| State: | 27% |
Housing density: 546 houses/condos per square mile
Median price asked for vacant for-sale houses and condos in 2022: $340,592.
Median contract rent in 2022: $791 (lower quartile is $764, upper quartile is $897)
Median rent asked for vacant for-rent units in 2022: $1,986
Median gross rent in Ortonville, MI in 2022: $924
Housing units in Ortonville with a mortgage: 253 (40 second mortgage, 0 home equity loan, 39 both second mortgage and home equity loan)
Houses without a mortgage: 5
Median household income for houses/condos with a mortgage: $126,426
Median household income for apartments without a mortgage: $62,098
Median monthly housing costs: $991
Compare current foreclosures near Ortonville, MI:
| Photo | Address | Area | Beds / Baths | Price | Details |
|---|---|---|---|---|---|

|
#1
Autumn Valley Dr
Ortonville, MI 48462
|
1,868 sq. feet
|
2 baths 3 beds |
show details | |

|
#2
Zarieda St
Ortonville, MI 48462
|
975 sq. feet
|
1 baths 3 beds |
show details | |

|
#3
N Hurd Rd
Ortonville, MI 48462
|
1,084 sq. feet
|
1 baths 3 beds |
show details | |

|
#4
Baldwin Rd
Ortonville, MI 48462
|
1,280 sq. feet
|
1 baths 2 beds |
show details | |

|
#5
Mill St
Ortonville, MI 48462
|
1,388 sq. feet
|
2 baths 3 beds |
show details | |

|
#6
Burrus Rd
Ortonville, MI 48462
|
1,954 sq. feet
|
2 baths 3 beds |
show details | |

|
#7
Cedar St
Ortonville, MI 48462
|
2,176 sq. feet
|
2 baths 3 beds |
show details | |

|
#8
Granger Rd
Ortonville, MI 48462
|
1,388 sq. feet
|
1 baths - beds |
show details | |

|
#9
Village Pine Ln
Ortonville, MI 48462
|
1,712 sq. feet
|
2 baths - beds |
show details | |

|
#10
Reese Rd
Ortonville, MI 48462
|
2,613 sq. feet
|
3 baths - beds |
show details |
| Photo | Address | Area | Beds / Baths | Price | Details |
|---|---|---|---|---|---|

|
#11
Autumn Valley Dr
Ortonville, MI 48462
|
- sq. feet
|
- baths - beds |
show details | |

|
#12
Granger Rd
Ortonville, MI 48462
|
- sq. feet
|
- baths - beds |
show details | |

|
#13
Nelson William Dr
Ortonville, MI 48462
|
- sq. feet
|
- baths - beds |
show details | |

|
#14
Cherrylawn Dr
Pontiac, MI 48340
|
1,328 sq. feet
|
2 baths 3 beds |
$243,000
|
show details |

|
#15
Oak Hill Dr # 59
Waterford, MI 48329
|
1,024 sq. feet
|
1 baths 1 beds |
$144,500
|
show details |

|
#16
Thayer Rd
Ortonville, MI 48462
|
- sq. feet
|
- baths - beds |
show details | |

|
#17
Parkcrest Dr
Waterford, MI 48327
|
1,319 sq. feet
|
2 baths 2 beds |
show details | |

|
#18
Harbor Oak Dr
Waterford, MI 48329
|
1,331 sq. feet
|
3 baths 2 beds |
show details | |

|
#19
Whisperwood Trl
Fenton, MI 48430
|
1,185 sq. feet
|
2 baths 2 beds |
show details | |

|
#20
E Buder Ave
Burton, MI 48529
|
520 sq. feet
|
1 baths 2 beds |
show details |
| Photo | Address | Area | Beds / Baths | Price | Details |
|---|---|---|---|---|---|

|
#21
W Sheffield Ave
Pontiac, MI 48340
|
1,706 sq. feet
|
1 baths 2 beds |
show details | |

|
#22
Brady Ave
Burton, MI 48529
|
1,400 sq. feet
|
2 baths 4 beds |
show details | |

|
#23
Beechwood Ave
Flint, MI 48506
|
954 sq. feet
|
1 baths 3 beds |
show details | |

|
#24
Macdonald Ave
Flint, MI 48507
|
941 sq. feet
|
1 baths 3 beds |
show details | |

|
#25
Big Lake Rd
Clarkston, MI 48346
|
1,897 sq. feet
|
2 baths 3 beds |
show details | |

|
#26
W Mclean Ave
Flint, MI 48507
|
1,944 sq. feet
|
2 baths 3 beds |
show details | |

|
#27
Mann Rd
Waterford, MI 48329
|
1,040 sq. feet
|
1 baths 3 beds |
show details | |

|
#28
Pine Tree Ridge Dr Unit 2
Waterford, MI 48327
|
1,034 sq. feet
|
2 baths 2 beds |
show details | |

|
#29
Mcphail St
Flint, MI 48503
|
807 sq. feet
|
1 baths 2 beds |
show details | |

|
#30
Crediton St
Lake Orion, MI 48362
|
1,100 sq. feet
|
1 baths 3 beds |
show details |
| Photo | Address | Area | Beds / Baths | Price | Details |
|---|---|---|---|---|---|

|
#31
Woodstead St
Burton, MI 48509
|
1,656 sq. feet
|
1 baths 3 beds |
show details | |

|
#32
Green Valley Dr
Grand Blanc, MI 48439
|
1,847 sq. feet
|
2 baths 3 beds |
show details | |

|
#33
Gloucester St
Flint, MI 48503
|
1,008 sq. feet
|
1 baths 3 beds |
show details | |

|
#34
Samburu St
Pontiac, MI 48341
|
2,153 sq. feet
|
2 baths 3 beds |
show details | |

|
#35
N Hill Dr
Holly, MI 48442
|
1,409 sq. feet
|
2 baths 3 beds |
show details | |

|
#36
Forest St
Leonard, MI 48367
|
1,584 sq. feet
|
1 baths 3 beds |
show details | |

|
#37
W Williamson Ave
Flint, MI 48507
|
1,083 sq. feet
|
1 baths 3 beds |
show details | |

|
#38
Perry Creek Dr
Grand Blanc, MI 48439
|
1,070 sq. feet
|
2 baths 2 beds |
show details | |

|
#39
Pinecrest Ct
Davison, MI 48423
|
1,413 sq. feet
|
2 baths 2 beds |
show details | |

|
#40
Locust Trl
Grand Blanc, MI 48439
|
1,774 sq. feet
|
2 baths 3 beds |
show details |
| Photo | Address | Area | Beds / Baths | Price | Details |
|---|---|---|---|---|---|

|
#41
E Madison Ave
Pontiac, MI 48340
|
1,022 sq. feet
|
1 baths 3 beds |
show details | |

|
#42
S Baldwin Rd
Lake Orion, MI 48360
|
1,329 sq. feet
|
1 baths 2 beds |
show details | |

|
#43
W Mansfield Ave
Pontiac, MI 48340
|
1,025 sq. feet
|
1 baths 3 beds |
show details | |

|
#44
Westbrooke Dr
Lapeer, MI 48446
|
1,008 sq. feet
|
1 baths 3 beds |
show details | |

|
#45
Lonesome Lake Ct
Lake Orion, MI 48362
|
2,313 sq. feet
|
3 baths 4 beds |
show details | |

|
#46
Layman Creek Cir
Grand Blanc, MI 48439
|
1,760 sq. feet
|
2 baths 3 beds |
show details | |

|
#47
Hidden Ridge Dr
Waterford, MI 48328
|
956 sq. feet
|
1 baths 2 beds |
show details | |

|
#48
Moulton Dr
Flint, MI 48507
|
1,276 sq. feet
|
1 baths 3 beds |
show details | |

|
#49
E Maple Ave
Grand Blanc, MI 48439
|
2,097 sq. feet
|
2 baths 3 beds |
show details | |

|
Check over 1 million property listings on Foreclosure.com!
|
browse all offers | |||

Latest news about housing in Ortonville, MI collected exclusively by city-data.com from local newspapers, TV, and radio stations

 | Forbes just named GR #1 place to invest in house (50 replies) |
| Southern/Appalachian Culture in Metro Detroit (10 replies) |
| Why Michigan to Arizona? (130 replies) |
| What is protecting places like Grosse Pointe and Birmingham from the blight and white Flight that plagued Detroit? (32 replies) |
| Where to move around Flint (6 replies) |
| Where to live? (4 replies) |

Median year apartment built: 1969
Household type by relationship:
Households: 1,268- Male householders: 230 (65 living alone), Female householders: 275 (74 living alone)
252 spouses (252 opposite-sex spouses), 28 unmarried partners, (28 opposite-sex unmarried partners), 404 children (317 natural, 62 adopted, 23 stepchildren), 29 grandchildren, 0 brothers or sisters, 1 parents, 0 foster children, 18 other relatives, 14 non-relatives
- In group quarters: 10
Size of family households: 183 2-persons, 66 3-persons, 60 4-persons, 23 5-persons, 10 6-persons, 4 7-or-more-persons.
Size of nonfamily households: 148 1-person, 12 2-persons, 1 3-persons.
136 married couples with children.
144 single-parent households (29 men, 115 women).
97.5% of residents of Ortonville speak English at home.
1.8% of residents speak Spanish at home (100% speak English very well).
Foreign born population: 6 (0.5%)
(100.0% of them are naturalized citizens)
| Here: | 6.8 |
| State: | 6.5 |
| Here: | 4.3 |
| State: | 4.3 |

- Bedrooms in owner-occupied houses and condos in Ortonville, Michigan
- 0no bedroom
- 01 bedroom
- 602 bedrooms
- 2433 bedrooms
- 504 bedrooms
- 235+ bedrooms

- Bedrooms in renter-occupied apartments in Ortonville, Michigan
- 0no bedroom
- 111 bedroom
- 812 bedrooms
- 203 bedrooms
- 254 bedrooms
- 05+ bedrooms

- Cars and other vehicles available in Ortonville in owner-occupied houses/condos
- 4no vehicle
- 851 vehicle
- 1782 vehicles
- 713 vehicles
- 304 vehicles
- 75+ vehicles

- Cars and other vehicles available in Ortonville in renter-occupied apartments
- 16no vehicle
- 771 vehicle
- 372 vehicles
- 73 vehicles
- 04 vehicles
- 05+ vehicles

- Rooms in owner-occupied houses in Ortonville, Michigan
- 01 room
- 02 rooms
- 123 rooms
- 124 rooms
- 315 rooms
- 1036 rooms
- 1047 rooms
- 508 rooms
- 639+ rooms

- Rooms in renter-occupied apartments in Ortonville, Michigan
- 01 room
- 92 rooms
- 03 rooms
- 664 rooms
- 195 rooms
- 56 rooms
- 07 rooms
- 198 rooms
- 199+ rooms


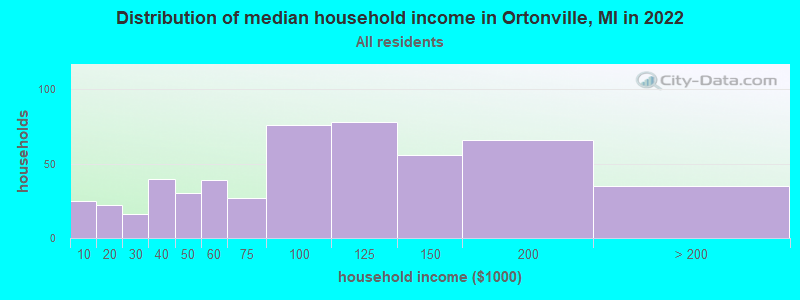
Ortonville, MI household income distribution

- 25Less than $10,000
- 22$10,000 to $19,999
- 16$20,000 to $29,999
- 40$30,000 to $39,999
- 30$40,000 to $49,999
- 39$50,000 to $59,999
- 27$60,000 to $74,999
- 76$75,000 to $99,999
- 78$100,000 to $124,999
- 56$125,000 to $149,999
- 66$150,000 to $199,999
- 35$200,000 or more
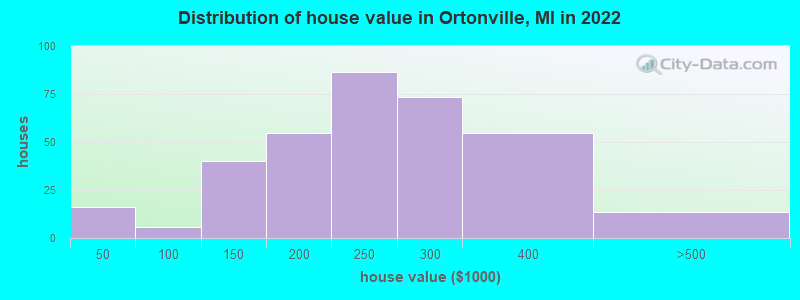
Home value of owner - occupied houses in 2022 in Ortonville, MI
-
- 2Less than $10,000
- 1$15,000 to $19,999
- 4$25,000 to $29,999
- 7$30,000 to $34,999
- 4$60,000 to $69,999
- 1$90,000 to $99,999
- 22$100,000 to $124,999
- 17$125,000 to $149,999
- 37$150,000 to $174,999
- 17$175,000 to $199,999
- 86$200,000 to $249,999
- 73$250,000 to $299,999
- 54$300,000 to $399,999
- 13$400,000 to $499,999
Rent paid by renters in 2022 in Ortonville, MI
-
- 16$550 to $599
- 6$600 to $649
- 4$650 to $699
- 51$750 to $799
- 16$800 to $899
- 5$1,000 to $1,249
- 18$1,250 to $1,499
- 6No cash rent


Percentage of workers working in this county: 80.4%
Number of people working at home: 104 (16.3% of all workers)
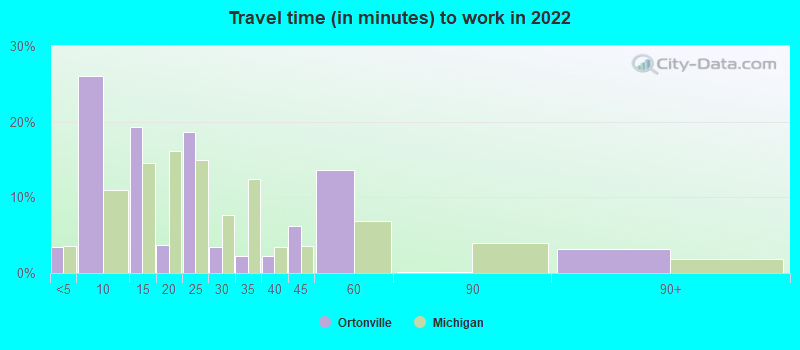
Travel time to work (commute)
- Less than 5 minutes: 24
- 5 to 9 minutes: 53
- 10 to 14 minutes: 18
- 15 to 19 minutes: 10
- 20 to 24 minutes: 73
- 25 to 29 minutes: 27
- 30 to 34 minutes: 50
- 35 to 39 minutes: 41
- 40 to 44 minutes: 33
- 45 to 59 minutes: 97
- 60 to 89 minutes: 62
- 90 or more minutes: 10
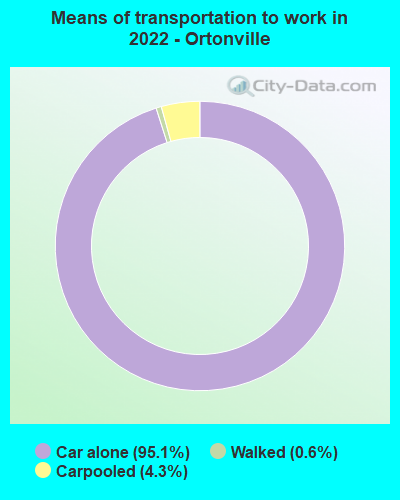
Means of transportation to work:
- Drove a car alone: 748 (81.7%)
- Carpooled: 32 (3.5%)
- Walked: 5 (0.5%)
- Worked at home: 104 (11.4%)

- Unemployment by race in 2022
- Unemployment rate for White non-Hispanic residents
- 5.5%Males
- 3.3%Females

- Year of entry for the foreign-born population in Ortonville, Michigan
- 02010 or later
- 02000 to 2009
- 01990 to 1999
- 31980 to 1989
- 41970 to 1979
- 10Before 1970

First ancestries reported:
- Irish: 75 (16.3%)
- American: 68 (14.7%)
- English: 52 (11.3%)
- German: 38 (8.2%)
- Italian: 15 (3.3%)
- Polish: 11 (2.4%)
- Welsh: 11 (2.4%)
- Scottish: 10 (2.2%)
- Czech: 9 (2.0%)
- European: 9 (2.0%)
- Pennsylvania German: 8 (1.7%)
- Swedish: 7 (1.5%)
- French Canadian: 6 (1.3%)
- Slovak: 5 (1.1%)
- Arab: 4 (0.9%)
- Norwegian: 4 (0.9%)
- Dutch: 3 (0.7%)
- Belgian: 2 (0.4%)
- French: 2 (0.4%)
- Romanian: 2 (0.4%)
- Scotch-Irish: 2 (0.4%)
- British: 1 (0.2%)
- Canadian: 1 (0.2%)
- Portuguese: 1 (0.2%)
Most common places of birth for foreign-born residents (%):
| Ortonville: | 33.3% (2) |
| Michigan: | 0.5% (3,681) |
| Ortonville: | 33.3% (2) |
| Michigan: | 1.2% (8,563) |
Place of birth for U.S.-born residents:
- This state: 1,074
- Other state: 188
- Northeast: 51
- Midwest: 93
- South: 32
- West: 13
86.1% of Ortonville residents lived in the same house 1 years ago.
Out of people who lived in different houses, 38.3% lived in this county.
Out of people who lived in different counties, 100.0% lived in Michigan.
| Ortonville: | 86.1% |
| State average: | 88.4% |
Education attainment for males 25 years and older:
- No schooling: 17
- Nursery to 4th grade: 0
- 5th and 6th grade: 0
- 7th and 8th grade: 0
- 9th grade: 15
- 10th grade: 0
- 11th grade: 6
- 12th grade, no diploma: 9
- High school graduate (or equivalency): 95
- Less than 1 year of college: 26
- Some college more than 1 year, no degree: 106
- Associate degree: 24
- Bachelor's degree: 63
- Master's degree: 34
- Professional school degree: 13
- Doctorate degree: 3

Education attainment for females 25 years and older:
- No schooling: 3
- Nursery to 4th grade: 0
- 5th and 6th grade: 0
- 7th and 8th grade: 0
- 9th grade: 0
- 10th grade: 4
- 11th grade: 0
- 12th grade, no diploma: 4
- High school graduate (or equivalency): 134
- Less than 1 year of college: 37
- Some college more than 1 year, no degree: 104
- Associate degree: 44
- Bachelor's degree: 65
- Master's degree: 33
- Professional school degree: 5
- Doctorate degree: 9


Housing units in structures:
- One, detached: 400
- One, attached: 24
- Two: 36
- 3 or 4: 40
- 5 to 9: 9
- 10 to 19: 8
- 20 to 49: 24
House/condo owner moved in on average 16 years ago
Renter moved in on average 0 years ago

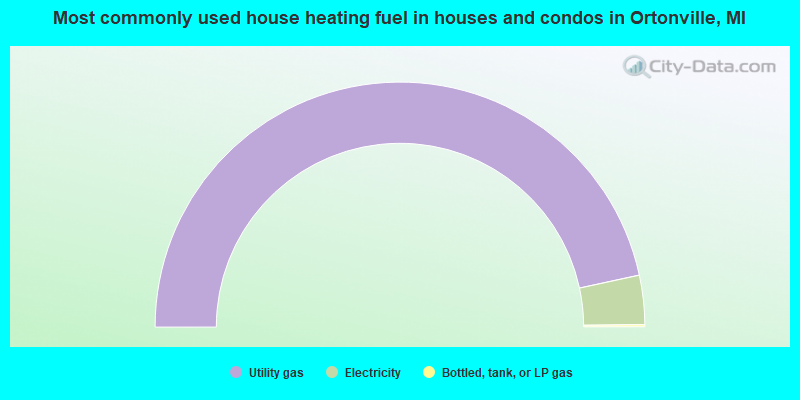
- 93.3%Utility gas
- 6.5%Electricity
- 0.3%Bottled, tank, or LP gas
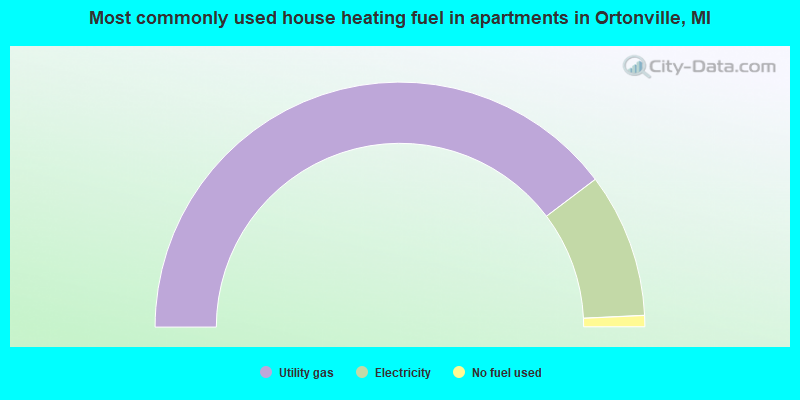
- 79.4%Utility gas
- 19.1%Electricity
- 1.5%No fuel used
Private vs. public school enrollment:
| Here: | 0.8% |
| Michigan: | 12.4% |
| Here: | 4.3% |
| Michigan: | 9.8% |
| Here: | 43.3% |
| Michigan: | 14.9% |


