Ormond Beach, FL (Florida) Houses and Residents
Estimated median house or condo value in 2022: $362,592 (it was $102,700 in 2000 )
Ormond Beach:
$362,592Florida:
$354,100
Lower value quartile - upper value quartile: $242,596 - $479,122Mean price in 2022: Detached houses: $416,769 Here:
$416,769State:
$500,941
Townhouses or other attached units: $268,518 Here:
$268,518State:
$370,869
In 2-unit structures: $191,752 Here:
$191,752State:
$423,188
In 3-to-4-unit structures: $206,827 Here:
$206,827State:
$309,944
In 5-or-more-unit structures: $690,218 Here:
$690,218State:
$447,145
Mobile homes: $73,845 Here:
$73,845State:
$113,202
Total population: 39,075 (Urban population: 34,551, Rural population: 1,797 (80 farm, 1,717 nonfarm ))
Houses: 21,948 (19,450 occupied: 14,918 owner occupied, 4,698 renter occupied )
% of renters here:
24%State:
33%
Housing density: 852 houses/condos per square mile
Median price asked for vacant for-sale houses and condos in 2022: $311,241.
Median contract rent in 2022: $1,265 (lower quartile is $924, upper quartile is $1,646)
Median rent asked for vacant for-rent units in 2022: $1,739
Median gross rent in Ormond Beach, FL in 2022: $1,367
Housing units in Ormond Beach with a mortgage: 7,898 (663 second mortgage, 9 home equity loan, 603 both second mortgage and home equity loan )Houses without a mortgage: 601
Median household income for houses/condos with a mortgage: $96,171
Median household income for apartments without a mortgage: $57,310
Median monthly housing costs: $1,213
Data:
Median house or condo value ($)
Median house or condo value ($ change since 2000)
Median house or condo value ($) - White
Median house or condo value ($) - Black or African American
Median house or condo value ($) - Asian
Median house or condo value ($) - Hispanic or Latino
Median house or condo value ($) - American Indian and Alaska Native
Median house or condo value ($) - Multirace
Median house or condo value ($) - Other Race
Median price asked for mobile homes ($)
Household density (households per square mile)
Mean house or condo value by units in structure - 1, detached ($)
Mean house or condo value by units in structure - 1, attached ($)
Mean house or condo value by units in structure - 2 ($)
Mean house or condo value by units in structure by units in structure - 3 or 4 ($)
Mean house or condo value by units in structure - 5 or more ($)
Mean house or condo value by units in structure - Boat, RV, van, etc. ($)
Mean house or condo value by units in structure - Mobile home ($)
Median contract rent ($)
Median contract rent - Lower quartile ($)
Median contract rent - Upper quartile ($)
Median gross rent ($)
Urban houses (%)
Rural houses (%)
Houses occupied (%)
Houses occupied (% change since 2000)
Houses owner occupied (%)
Houses owner occupied (% change since 2000)
Houses renter occupied (%)
Houses renter occupied (% change since 2000)
Vacant housing units - For rent (%)
Vacant housing units - For rent (% change since 2000)
Vacant housing units - For sale only (%)
Vacant housing units - For sale only (% change since 2000)
Vacant housing units - Rented or sold, not occupied (%)
Vacant housing units - Rented or sold, not occupied (% change since 2000)
Vacant housing units - For seasonal, recreational, or occasional use (%)
Vacant housing units - For seasonal, recreational, or occasional use (% change since 2000)
Vacant housing units - For migrant workers (%)
Vacant housing units - For migrant workers (% change since 2000)
Vacant housing units - Other vacant (%)
Vacant housing units - Other vacant (% change since 2000)
Median monthly housing costs ($)
Median household income for houses/condos with a mortgage ($)
Median household income for houses/condos without a mortgage ($)
Median household income ($)
Median household income ($) - White
Median household income ($) - Black or African American
Median household income ($) - Asian
Median household income ($) - Hispanic or Latino
Median household income ($) - American Indian and Alaska Native
Median household income ($) - Multirace
Median household income ($) - Other Race
Mortgage status - with mortgage (%)
Mortgage status - with second mortgage (%)
Mortgage status - with home equity loan (%)
Mortgage status - with both second mortgage and home equity loan (%)
Mortgage status - without a mortgage (%)
Median year house/condo built
Median year apartment built
Household type by relationship - Male householder living alone (%)
Household type by relationship - Male householder not living alone (%)
Household type by relationship - Female householder living alone (%)
Household type by relationship - Female householder not living alone (%)
Household type by relationship - Opposite-Sex spouse (%)
Household type by relationship - Same-Sex spouse (%)
Household type by relationship - Opposite-Sex unmarried partner (%)
Household type by relationship - Same-Sex unmarried partner (%)
Household type by relationship - In group quarters (%)
Size of family households - 2-person household (%)
Size of family households - 3-person household (%)
Size of family households - 4-person household (%)
Size of family households - 5-person household (%)
Size of family households - 6-person household (%)
Size of family households - 7-or-more-person household (%)
Size of nonfamily households - 1-person household (%)
Size of nonfamily households - 2-person household (%)
Size of nonfamily households - 3-person household (%)
Size of nonfamily households - 4-person household (%)
Size of nonfamily households - 5-person household (%)
Size of nonfamily households - 6-person household (%)
Size of nonfamily households - 7-or-moreperson household (%)
Year house built - Built 2010 or later (%)
Year house built - Built 2000 to 2009 (%)
Year house built - Built 1990 to 1999 (%)
Year house built - Built 1980 to 1989 (%)
Year house built - Built 1970 to 1979 (%)
Year house built - Built 1960 to 1969 (%)
Year house built - Built 1950 to 1959 (%)
Year house built - Built 1940 to 1949 (%)
Year house built - Built 1939 or earlier (%)
Median number of rooms in houses and condos
Median number of rooms in apartments
Median number of bedrooms in owner occupied houses
Mean number of bedrooms in owner occupied houses
Median number of bedrooms in renter occupied houses
Mean number of bedrooms in renter occupied houses
Median number of vehichles in owner occupied houses
Mean number of vehichles in owner occupied houses
Median number of vehichles in renter occupied houses
Mean number of vehichles in renter occupied houses
Rooms in owner-occupied houses - 1 room (%)
Rooms in owner-occupied houses - 2 rooms (%)
Rooms in owner-occupied houses - 3 rooms (%)
Rooms in owner-occupied houses - 4 rooms (%)
Rooms in owner-occupied houses - 5 rooms (%)
Rooms in owner-occupied houses - 6 rooms (%)
Rooms in owner-occupied houses - 7 rooms (%)
Rooms in owner-occupied houses - 8 rooms (%)
Rooms in owner-occupied houses - 9+ rooms (%)
Rooms in renter-occupied houses - 1 room (%)
Rooms in renter-occupied houses - 2 rooms (%)
Rooms in renter-occupied houses - 3 rooms (%)
Rooms in renter-occupied houses - 4 rooms (%)
Rooms in renter-occupied houses - 5 rooms (%)
Rooms in renter-occupied houses - 6 rooms (%)
Rooms in renter-occupied houses - 7 rooms (%)
Rooms in renter-occupied houses - 8 rooms (%)
Rooms in renter-occupied houses - 9+ rooms (%)
Bedrooms in owner-occupied houses - no bedrooms (%)
Bedrooms in owner-occupied houses - 1 bedroom (%)
Bedrooms in owner-occupied houses - 2 bedrooms (%)
Bedrooms in owner-occupied houses - 3 bedrooms (%)
Bedrooms in owner-occupied houses - 4 bedrooms (%)
Bedrooms in owner-occupied houses - 5+ bedrooms (%)
Bedrooms in renter-occupied houses - no bedrooms (%)
Bedrooms in renter-occupied houses - 1 bedroom (%)
Bedrooms in renter-occupied houses - 2 bedrooms (%)
Bedrooms in renter-occupied houses - 3 bedrooms (%)
Bedrooms in renter-occupied houses - 4 bedrooms (%)
Bedrooms in renter-occupied houses - 5+ bedrooms (%)
Vehicles available in owner-occupied houses - no vehicle available (%)
Vehicles available in owner-occupied houses - 1 vehicle available(%)
Vehicles available in owner-occupied houses - 2 Vehicles available (%)
Vehicles available in owner-occupied houses - 3 Vehicles available (%)
Vehicles available in owner-occupied houses - 4 Vehicles available (%)
Vehicles available in owner-occupied houses - 5+ Vehicles available (%)
Vehicles available in renter-occupied houses - no vehicle available (%)
Vehicles available in renter-occupied houses - 1 vehicle available (%)
Vehicles available in renter-occupied houses - 2 Vehicles available (%)
Vehicles available in renter-occupied houses - 3 Vehicles available (%)
Vehicles available in renter-occupied houses - 4 Vehicles available (%)
Vehicles available in renter-occupied houses - 5+ Vehicles available (%)
Housing units in structures - 1, detached (%)
Housing units in structures - 1, attached (%)
Housing units in structures - 2 (%)
Housing units in structures - 3 or 4 (%)
Housing units in structures - 5 to 9 (%)
Housing units in structures - 10 to 19 (%)
Housing units in structures - 20 to 49 (%)
Housing units in structures - 50 or more (%)
Housing units in structures - Mobile home (%)
Housing units in structures - Boat, RV, van, etc. (%)
Housing units in structures - Owners - 1, detached (%)
Housing units in structures - Owners - 1, attached (%)
Housing units in structures - Owners - 2 (%)
Housing units in structures - Owners - 3 or 4 (%)
Housing units in structures - Owners - 5 to 9 (%)
Housing units in structures - Owners - 10 to 19 (%)
Housing units in structures - Owners - 20 to 49 (%)
Housing units in structures - Owners - 50 or more (%)
Housing units in structures - Owners - Mobile home (%)
Housing units in structures - Owners - Boat, RV, van, etc. (%)
Housing units in structures - Renters - 1, detached (%)
Housing units in structures - Renters - 1, attached (%)
Housing units in structures - Renters - 2 (%)
Housing units in structures - Renters - 3 or 4 (%)
Housing units in structures - Renters - 5 to 9 (%)
Housing units in structures - Renters - 10 to 19 (%)
Housing units in structures - Renters - 20 to 49 (%)
Housing units in structures - Renters - 50 or more (%)
Housing units in structures - Renters - Mobile home (%)
Housing units in structures - Renters - Boat, RV, van, etc. (%)
House/condo owner moved in on average (years ago)
Renter moved in on average (years ago)
Year householder moved into unit - Moved in 1999 to March 2000 (%)
Year householder moved into unit - Moved in 1999 to March 2000 (%) - White
Year householder moved into unit - Moved in 1999 to March 2000 (%) - Black or African American
Year householder moved into unit - Moved in 1999 to March 2000 (%) - Asian
Year householder moved into unit - Moved in 1999 to March 2000 (%) - Hispanic or Latino
Year householder moved into unit - Moved in 1999 to March 2000 (%) - American Indian and Alaska Native
Year householder moved into unit - Moved in 1999 to March 2000 (%) - Multirace
Year householder moved into unit - Moved in 1999 to March 2000 (%) - Other Race
Year householder moved into unit - Moved in 1995 to 1998 (%)
Year householder moved into unit - Moved in 1995 to 1998 (%) - White
Year householder moved into unit - Moved in 1995 to 1998 (%) - Black or African American
Year householder moved into unit - Moved in 1995 to 1998 (%) - Asian
Year householder moved into unit - Moved in 1995 to 1998 (%) - Hispanic or Latino
Year householder moved into unit - Moved in 1995 to 1998 (%) - American Indian and Alaska Native
Year householder moved into unit - Moved in 1995 to 1998 (%) - Multirace
Year householder moved into unit - Moved in 1995 to 1998 (%) - Other Race
Year householder moved into unit - Moved in 1990 to 1994 (%)
Year householder moved into unit - Moved in 1990 to 1994 (%) - White
Year householder moved into unit - Moved in 1990 to 1994 (%) - Black or African American
Year householder moved into unit - Moved in 1990 to 1994 (%) - Asian
Year householder moved into unit - Moved in 1990 to 1994 (%) - Hispanic or Latino
Year householder moved into unit - Moved in 1990 to 1994 (%) - American Indian and Alaska Native
Year householder moved into unit - Moved in 1990 to 1994 (%) - Multirace
Year householder moved into unit - Moved in 1990 to 1994 (%) - Other Race
Year householder moved into unit - Moved in 1980 to 1989 (%)
Year householder moved into unit - Moved in 1980 to 1989 (%) - White
Year householder moved into unit - Moved in 1980 to 1989 (%) - Black or African American
Year householder moved into unit - Moved in 1980 to 1989 (%) - Asian
Year householder moved into unit - Moved in 1980 to 1989 (%) - Hispanic or Latino
Year householder moved into unit - Moved in 1980 to 1989 (%) - American Indian and Alaska Native
Year householder moved into unit - Moved in 1980 to 1989 (%) - Multirace
Year householder moved into unit - Moved in 1980 to 1989 (%) - Other Race
Year householder moved into unit - Moved in 1970 to 1979 (%)
Year householder moved into unit - Moved in 1970 to 1979 (%) - White
Year householder moved into unit - Moved in 1970 to 1979 (%) - Black or African American
Year householder moved into unit - Moved in 1970 to 1979 (%) - Asian
Year householder moved into unit - Moved in 1970 to 1979 (%) - Hispanic or Latino
Year householder moved into unit - Moved in 1970 to 1979 (%) - American Indian and Alaska Native
Year householder moved into unit - Moved in 1970 to 1979 (%) - Multirace
Year householder moved into unit - Moved in 1970 to 1979 (%) - Other Race
Year householder moved into unit - Moved in 1969 or earlier (%)
Year householder moved into unit - Moved in 1969 or earlier (%) - White
Year householder moved into unit - Moved in 1969 or earlier (%) - Black or African American
Year householder moved into unit - Moved in 1969 or earlier (%) - Asian
Year householder moved into unit - Moved in 1969 or earlier (%) - Hispanic or Latino
Year householder moved into unit - Moved in 1969 or earlier (%) - American Indian and Alaska Native
Year householder moved into unit - Moved in 1969 or earlier (%) - Multirace
Year householder moved into unit - Moved in 1969 or earlier (%) - Other Race
Housing units lacking complete plumbing facilities (%)
Housing units lacking complete kitchen facilities (%)
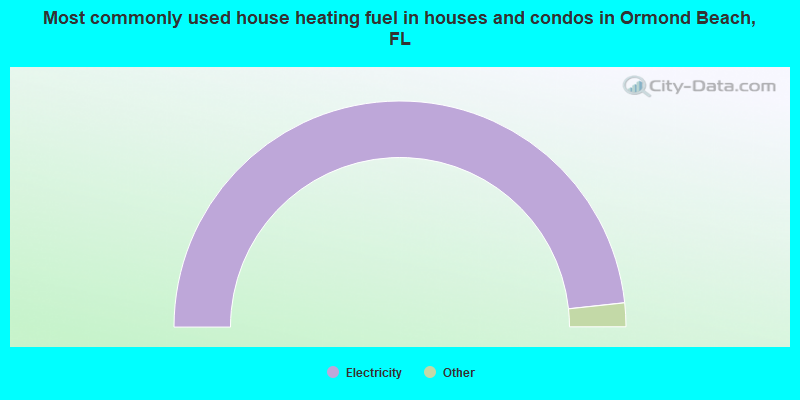
House heating fuel used in houses and condos - Utility gas (%)
House heating fuel used in houses and condos - Bottled, tank, or LP gas (%)
House heating fuel used in houses and condos - Electricity (%)
House heating fuel used in houses and condos - Fuel oil, kerosene, etc. (%)
House heating fuel used in houses and condos - Coal or coke (%)
House heating fuel used in houses and condos - Wood (%)
House heating fuel used in houses and condos - Solar energy (%)
House heating fuel used in houses and condos - Other fuel (%)
House heating fuel used in houses and condos - No fuel used (%)
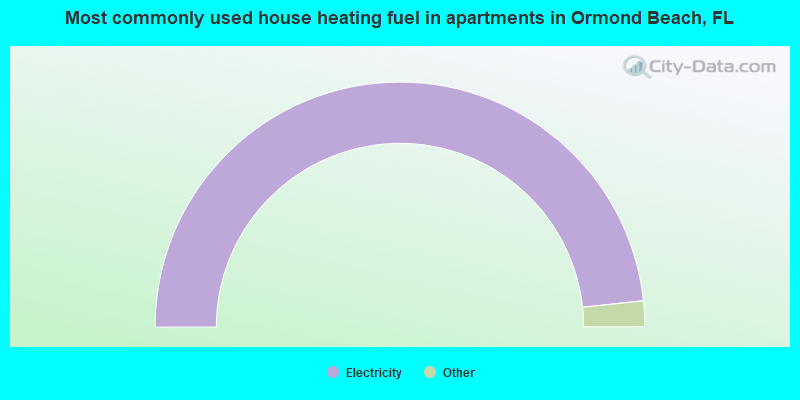
House heating fuel used in apartments - Utility gas (%)
House heating fuel used in apartments - Bottled, tank, or LP gas (%)
House heating fuel used in apartments - Electricity (%)
House heating fuel used in apartments - Fuel oil, kerosene, etc. (%)
House heating fuel used in apartments - Coal or coke (%)
House heating fuel used in apartments - Wood (%)
House heating fuel used in apartments - Solar energy (%)
House heating fuel used in apartments - Other fuel (%)
House heating fuel used in apartments - No fuel used (%)
Median year house/condo built: 1986Median year apartment built: 1987Household type by relationship:
Households: 44,723
Male householders: 8,832 (2,076 living alone ), Female householders: 10,737 (4,065 living alone )9,117 spouses (8,971 opposite-sex spouses ), 1,603 unmarried partners , (1,593 opposite-sex unmarried partners ), 9,941 children (9,387 natural , 310 adopted , 244 stepchildren ), 1,068 grandchildren , 210 brothers or sisters , 718 parents , 0 foster children , 569 other relatives , 1,212 non-relatives In group quarters: 712
Size of family households: 6,566 2-persons , 2,437 3-persons , 1,914 4-persons , 821 5-persons , 90 6-persons , 128 7-or-more-persons .
Size of nonfamily households: 6,247 1-person , 1,349 2-persons , 48 3-persons , 19 4-persons , 16 5-persons .
4,503 married couples with children. single-parent households (682 men , 1,478 women ).
91.6% of residents of Ormond Beach speak English at home. of residents speak Spanish at home (66% speak English very well , 28% speak English well , 3% speak English not well , 3% don't speak English at all ).of residents speak other Indo-European language at home (87% speak English very well , 10% speak English well , 3% speak English not well ).of residents speak Asian or Pacific Island language at home (65% speak English very well , 24% speak English well , 4% speak English not well , 7% don't speak English at all ).of residents speak other language at home (62% speak English very well , 38% speak English well ).
Foreign born population: 3,011 (6.7%)of them are naturalized citizens )
Median number of rooms in houses and condos:
Median number of rooms in apartments
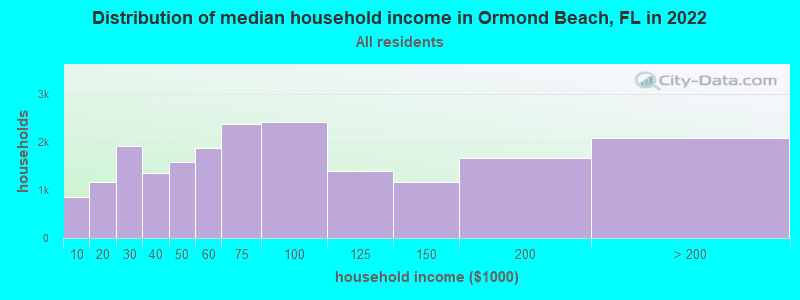
Ormond Beach, FL household income distribution 850 Less than $10,0001,166 $10,000 to $19,9991,911 $20,000 to $29,9991,349 $30,000 to $39,9991,570 $40,000 to $49,9991,876 $50,000 to $59,9992,366 $60,000 to $74,9992,412 $75,000 to $99,9991,391 $100,000 to $124,9991,159 $125,000 to $149,9991,670 $150,000 to $199,9992,071 $200,000 or more
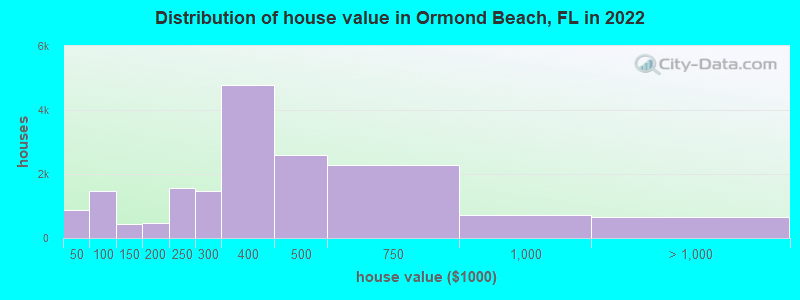
Home value of owner - occupied houses in 2022 in Ormond Beach, FL 175 Less than $10,000126 $10,000 to $14,99995 $15,000 to $19,99980 $20,000 to $24,99984 $25,000 to $29,999131 $30,000 to $34,99988 $35,000 to $39,999107 $40,000 to $49,999437 $50,000 to $59,999314 $60,000 to $69,999348 $70,000 to $79,999160 $80,000 to $89,99985 $90,000 to $99,999273 $100,000 to $124,999156 $125,000 to $149,999302 $150,000 to $174,999180 $175,000 to $199,9991,547 $200,000 to $249,9991,454 $250,000 to $299,9994,765 $300,000 to $399,9992,603 $400,000 to $499,9992,274 $500,000 to $749,999707 $750,000 to $999,999272 $1,000,000 to $1,499,999192 $1,500,000 to $1,999,999202 $2,000,000 or moreRent paid by renters in 2022 in Ormond Beach, FL 13 $200 to $24924 $250 to $29937 $400 to $44939 $450 to $499172 $500 to $549111 $550 to $59997 $600 to $649168 $650 to $69959 $700 to $74965 $750 to $799128 $800 to $899246 $900 to $999943 $1,000 to $1,249772 $1,250 to $1,499914 $1,500 to $1,999221 $2,000 to $2,49945 $2,500 to $2,99949 $3,500 or more259 No cash rent
Percentage of workers working in this county: 92.5%Number of people working at home: 3,239 (16.4% of all workers )
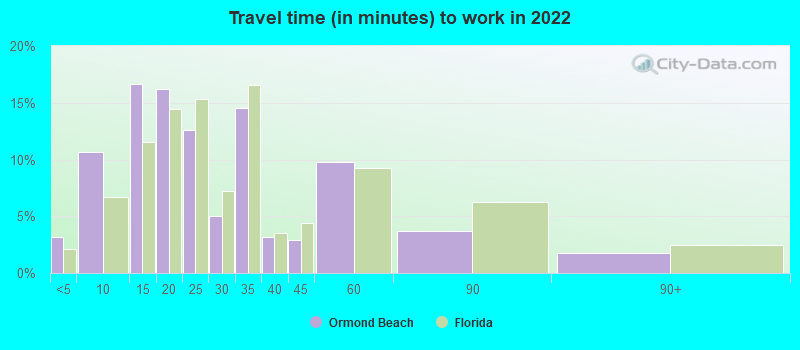
Travel time to work (commute)
Less than 5 minutes: 6055 to 9 minutes: 1,59510 to 14 minutes: 3,22715 to 19 minutes: 4,01720 to 24 minutes: 2,18825 to 29 minutes: 1,41630 to 34 minutes: 1,24035 to 39 minutes: 19740 to 44 minutes: 22745 to 59 minutes: 69160 to 89 minutes: 55190 or more minutes: 386
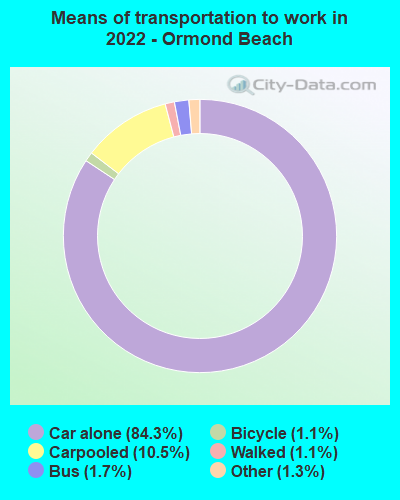
Means of transportation to work:
Drove a car alone: 16,418 (71.2%)Carpooled: 2,257 (9.8%)Bus : 257 (1.1%)Ferryboat: 9 (0.0%)Taxi: 237 (1.0%)Bicycle: 209 (0.9%)Walked: 192 (0.8%)Worked at home: 3,239 (14.0%)
Unemployment by race in 2022
Unemployment rate for White non-Hispanic residents 2.2% Males2.6% FemalesUnemployment rate for Asian residents 1.5% FemalesUnemployment rate for other race residents 15.7% Males4.5% FemalesUnemployment rate for Hispanic or Latino residents 2.8% Males1.3% Females
Year of entry for the foreign-born population in Ormond Beach, Florida
761 2010 or later 464 2000 to 2009 431 1990 to 1999 456 1980 to 1989 415 1970 to 1979 1,218 Before 1970
First ancestries reported:
English: 3,565 (16.9%)
Italian: 2,963 (14.0%)
Irish: 2,364 (11.2%)
American: 2,287 (10.8%)
German: 1,790 (8.5%)
European: 347 (1.6%)
Polish: 325 (1.5%)
Scottish: 319 (1.5%)
Scandinavian: 299 (1.4%)
French: 202 (1.0%)
Norwegian: 161 (0.8%)
Scotch-Irish: 160 (0.8%)
Czech: 148 (0.7%)
French Canadian: 126 (0.6%)
Greek: 112 (0.5%)
Hungarian: 97 (0.5%)
Portuguese: 92 (0.4%)
British: 89 (0.4%)
Canadian: 88 (0.4%)
Ukrainian: 80 (0.4%)
Brazilian: 70 (0.3%)
Jamaican: 69 (0.3%)
Lithuanian: 65 (0.3%)
Iranian: 61 (0.3%)
Dutch: 57 (0.3%)
Welsh: 53 (0.3%)
Czechoslovakian: 47 (0.2%)
Slovak: 45 (0.2%)
Egyptian: 39 (0.2%)
Haitian: 31 (0.1%)
Austrian: 28 (0.1%)
Slavic: 28 (0.1%)
Lebanese: 27 (0.1%)
Russian: 27 (0.1%)
Danish: 26 (0.1%)
Eastern European: 23 (0.1%)
Northern European: 22 (0.1%)
African: 22 (0.1%)
Yugoslavian: 20 (0.09%)
Arab: 19 (0.09%)
Swiss: 19 (0.09%)
South African: 16 (0.08%)
Syrian: 16 (0.08%)
Swedish: 16 (0.08%)
Palestinian: 16 (0.08%)
Moroccan: 15 (0.07%)
Turkish: 12 (0.06%)
Belgian: 9 (0.04%)
Armenian: 7 (0.03%)
Slovene: 7 (0.03%)
Croatian: 7 (0.03%)
Finnish: 6 (0.03%)
Guyanese: 4 (0.02%)
Most common places of birth for foreign-born residents (%): Canada Ormond Beach:
10.0% (325)Florida:
2.4% (109,132)
Philippines Ormond Beach:
9.3% (301)Florida:
1.8% (84,403)
Cuba Ormond Beach:
4.8% (155)Florida:
22.0% (1,006,576)
Nigeria Ormond Beach:
4.4% (143)Florida:
0.2% (10,443)
Germany Ormond Beach:
3.8% (123)Florida:
1.2% (54,272)
Scotland Ormond Beach:
3.6% (118)Florida:
0.1% (5,920)
Chile Ormond Beach:
2.9% (95)Florida:
0.5% (22,715)
Vietnam Ormond Beach:
2.8% (92)Florida:
1.3% (60,604)
China, excluding Hong Kong and Taiwan Ormond Beach:
2.8% (90)Florida:
1.2% (56,071)
Brazil Ormond Beach:
2.7% (88)Florida:
2.7% (122,906)
Jamaica Ormond Beach:
2.7% (88)Florida:
5.0% (227,319)
Colombia Ormond Beach:
2.7% (87)Florida:
6.5% (298,669)
Italy Ormond Beach:
2.6% (86)Florida:
0.7% (30,755)
Korea Ormond Beach:
2.3% (76)Florida:
0.4% (19,445)
Ecuador Ormond Beach:
2.1% (69)Florida:
1.2% (54,585)
Venezuela Ormond Beach:
2.1% (67)Florida:
5.7% (262,042)
United Kingdom, excluding England and Scotland Ormond Beach:
1.8% (60)Florida:
0.7% (34,227)
Mexico Ormond Beach:
1.8% (58)Florida:
5.6% (257,152)
Australia Ormond Beach:
1.7% (55)Florida:
0.1% (5,190)
Laos Ormond Beach:
1.6% (51)Florida:
0.1% (4,073)
Russia Ormond Beach:
1.5% (49)Florida:
0.7% (31,076)
Place of birth for U.S.-born residents:
This state: 14,472Other state: 26,329Northeast: 12,086Midwest: 6,938South: 5,691West: 1,616 90.3% of Ormond Beach residents lived in the same house 1 years ago.
Out of people who lived in different houses, 30.8% lived in this county.
Out of people who lived in different counties, 40.0% lived in Florida.
Ormond Beach:
90.3%State average:
86.3%
Education attainment for males 25 years and older:
No schooling: 133Nursery to 4th grade: 285th and 6th grade: 1297th and 8th grade: 1899th grade: 13210th grade: 14711th grade: 22712th grade, no diploma: 110High school graduate (or equivalency): 3,879Less than 1 year of college: 1,442Some college more than 1 year, no degree: 2,586Associate degree: 1,234Bachelor's degree: 3,489Master's degree: 1,123Professional school degree: 528Doctorate degree: 288
Education attainment for females 25 years and older:
No schooling: 119Nursery to 4th grade: 05th and 6th grade: 87th and 8th grade: 1319th grade: 20010th grade: 13311th grade: 21212th grade, no diploma: 157High school graduate (or equivalency): 4,650Less than 1 year of college: 1,350Some college more than 1 year, no degree: 2,328Associate degree: 2,138Bachelor's degree: 4,894Master's degree: 1,608Professional school degree: 527Doctorate degree: 354
Housing units in structures:
One, detached: 14,288One, attached: 1,233Two: 3513 or 4: 3325 to 9: 91710 to 19: 85420 to 49: 84850 or more: 913Mobile homes: 2,208Median worth of mobile homes: $68,270
Housing units lacking complete plumbing facilities in 2022: 0.8%Housing units lacking complete kitchen facilities in 2022: 1.3%House/condo owner moved in on average 9 years ago
Renter moved in on average 5 years ago
Private vs. public school enrollment:
Students in private schools in grades 1 to 8 (elementary and middle school): 575 Students in private schools in grades 9 to 12 (high school): 417 Students in private undergraduate colleges: 389