Orleans, IN (Indiana) Houses and Residents
| Orleans: | $122,310 |
| Indiana: | $208,700 |
Mean price in 2022:
Detached houses: $143,667
Here: $143,667 State: $257,916 Mobile homes: $38,137
Here: $38,137 State: $67,116
Total population: 2,132 (Urban population: 0, Rural population: 2,265 (all nonfarm))
Houses: 1,064 (894 occupied: 533 owner occupied, 371 renter occupied)
| % of renters here: | 41% |
| State: | 29% |
Housing density: 678 houses/condos per square mile
Median price asked for vacant for-sale houses and condos in 2022 in this county: $46,339.
Median contract rent in 2022: $526 (lower quartile is $375, upper quartile is $692)
Median rent asked for vacant for-rent units in 2022: $469
Median gross rent in Orleans, IN in 2022: $737
Housing units in Orleans with a mortgage: 248 (39 second mortgage, 0 home equity loan, 26 both second mortgage and home equity loan)
Houses without a mortgage: 19
Median household income for houses/condos with a mortgage: $67,725
Median household income for apartments without a mortgage: $60,726
Median monthly housing costs: $680
Compare current foreclosures near Orleans, IN:
| Photo | Address | Area | Beds / Baths | Price | Details |
|---|---|---|---|---|---|

|
#1
N County Road 200 E
Orleans, IN 47452
|
1,344 sq. feet
|
1 baths 3 beds |
show details | |

|
#2
W Hawthorne Dr
Orleans, IN 47452
|
1,225 sq. feet
|
1 baths 3 beds |
show details | |

|
#3
S Karen St
Orleans, IN 47452
|
1,782 sq. feet
|
2 baths 3 beds |
show details | |

|
#4
E Liberty Rd
Orleans, IN 47452
|
1,161 sq. feet
|
1 baths 2 beds |
show details | |

|
#5
State Road 60 E
Orleans, IN 47452
|
1,680 sq. feet
|
2 baths - beds |
show details | |

|
#6
N County Road 100 W
Orleans, IN 47452
|
- sq. feet
|
- baths - beds |
show details | |

|
#7
E County Road 500 N
Orleans, IN 47452
|
- sq. feet
|
- baths - beds |
show details | |

|
#8
N County Road 200 W
Orleans, IN 47452
|
- sq. feet
|
- baths - beds |
show details | |

|
#9
N State Road 337, Lot 39
Orleans, IN 47452
|
- sq. feet
|
- baths - beds |
show details | |

|
#10
W County Road 775 N
Orleans, IN 47452
|
- sq. feet
|
- baths - beds |
show details |
| Photo | Address | Area | Beds / Baths | Price | Details |
|---|---|---|---|---|---|

|
#11
S 2nd St
Orleans, IN 47452
|
- sq. feet
|
- baths - beds |
show details | |

|
#12
24th St
Bedford, IN 47421
|
1,008 sq. feet
|
1 baths 3 beds |
$175,000
|
show details |

|
#13
14th St
Bedford, IN 47421
|
2,016 sq. feet
|
2 baths 3 beds |
$260,000
|
show details |

|
#14
W Quarry Rd
Orleans, IN 47452
|
- sq. feet
|
- baths - beds |
show details | |

|
#15
Washington Ave
Bedford, IN 47421
|
1,504 sq. feet
|
1 baths 3 beds |
show details | |

|
#16
22nd St
Bedford, IN 47421
|
1,596 sq. feet
|
1 baths 5 beds |
show details | |

|
#17
Leatherwood Cir
Bedford, IN 47421
|
1,008 sq. feet
|
1 baths 3 beds |
show details | |

|
#18
W Longest St
Paoli, IN 47454
|
1,276 sq. feet
|
1 baths 3 beds |
show details | |

|
#19
Ikerd Ln
Bedford, IN 47421
|
1,792 sq. feet
|
2 baths 3 beds |
show details | |

|
#20
8th St
Bedford, IN 47421
|
- sq. feet
|
1 baths 2 beds |
show details |
| Photo | Address | Area | Beds / Baths | Price | Details |
|---|---|---|---|---|---|

|
#21
N 6th St
Mitchell, IN 47446
|
1,360 sq. feet
|
2 baths 3 beds |
show details | |

|
#22
Leatherwood Cir
Bedford, IN 47421
|
1,352 sq. feet
|
2 baths 3 beds |
show details | |

|
#23
Odea Ct
Mitchell, IN 47446
|
892 sq. feet
|
1 baths 1 beds |
show details | |

|
#24
V St
Bedford, IN 47421
|
826 sq. feet
|
1 baths 2 beds |
show details | |

|
#25
E Vine St
Campbellsburg, IN 47108
|
1,860 sq. feet
|
2 baths 3 beds |
show details | |

|
#26
Heltonville Rd E
Bedford, IN 47421
|
1,512 sq. feet
|
1 baths 3 beds |
show details | |

|
#27
30th St
Bedford, IN 47421
|
864 sq. feet
|
1 baths 2 beds |
show details | |

|
#28
19th St
Bedford, IN 47421
|
944 sq. feet
|
1 baths 3 beds |
show details | |

|
#29
22nd St
Bedford, IN 47421
|
1,676 sq. feet
|
2 baths 4 beds |
show details | |

|
#30
W Posey Chapel Rd
Salem, IN 47167
|
1,008 sq. feet
|
1 baths 3 beds |
show details |
| Photo | Address | Area | Beds / Baths | Price | Details |
|---|---|---|---|---|---|

|
#31
Lafayette Ave
Oolitic, IN 47451
|
1,120 sq. feet
|
1 baths 2 beds |
show details | |

|
#32
F St
Bedford, IN 47421
|
972 sq. feet
|
1 baths 3 beds |
show details | |

|
#33
W State Road 56
Campbellsburg, IN 47108
|
2,524 sq. feet
|
2 baths 5 beds |
show details | |

|
#34
Illinois St
Bedford, IN 47421
|
4,216 sq. feet
|
3 baths 4 beds |
show details | |

|
#35
Hillside Dr
Bedford, IN 47421
|
960 sq. feet
|
1 baths 3 beds |
show details | |

|
#36
V St
Bedford, IN 47421
|
2,304 sq. feet
|
2 baths 3 beds |
show details | |

|
#37
S Possum Hollow Rd
Campbellsburg, IN 47108
|
1,384 sq. feet
|
2 baths 3 beds |
show details | |

|
#38
S Clay St
French Lick, IN 47432
|
1,636 sq. feet
|
1 baths 3 beds |
show details | |

|
#39
O St
Bedford, IN 47421
|
2,320 sq. feet
|
1 baths 3 beds |
show details | |

|
#40
Goosetown Rd
Bedford, IN 47421
|
1,008 sq. feet
|
1 baths 3 beds |
show details |
| Photo | Address | Area | Beds / Baths | Price | Details |
|---|---|---|---|---|---|

|
#41
S West Washington School Rd
Salem, IN 47167
|
1,860 sq. feet
|
1 baths 3 beds |
show details | |

|
#42
W County Road 375 S
French Lick, IN 47432
|
1,566 sq. feet
|
2 baths 3 beds |
show details | |

|
#43
S Hancock St
French Lick, IN 47432
|
1,215 sq. feet
|
2 baths 3 beds |
show details | |

|
#44
6th St
Oolitic, IN 47451
|
780 sq. feet
|
1 baths 3 beds |
show details | |

|
#45
Sorrells Rd
Williams, IN 47470
|
1,479 sq. feet
|
2 baths 2 beds |
show details | |

|
#46
Trinton Cir
Bedford, IN 47421
|
1,873 sq. feet
|
2 baths 3 beds |
show details | |

|
#47
Indian Trails Ln
Bedford, IN 47421
|
2,026 sq. feet
|
1 baths 3 beds |
show details | |

|
#48
Rolling Rock
Bedford, IN 47421
|
1,120 sq. feet
|
1 baths 3 beds |
show details | |

|
#49
Dixie Hwy
Bedford, IN 47421
|
1,566 sq. feet
|
2 baths 2 beds |
show details | |

|
Check over 1 million property listings on Foreclosure.com!
|
browse all offers | |||

Latest news about housing in Orleans, IN collected exclusively by city-data.com from local newspapers, TV, and radio stations

 | Commuting from Louisville to Indy (227 replies) |
| thinking about moving from Denver to Indianapolis (46 replies) |
| NEEDED 5/27/11 - 2-4 Horse BP Trailer to RENT.... ORANGE COUNTY (0 replies) |
| Unhappy in Indiana (190 replies) |
| Why does Indianapolis get a bad rap as a boring city? (662 replies) |
| Indianapolis more like Minneapolis or Louisville (362 replies) |

Median year apartment built: 1974
Household type by relationship:
Households: 2,243- Male householders: 390 (79 living alone), Female householders: 496 (156 living alone)
474 spouses (456 opposite-sex spouses), 57 unmarried partners, (57 opposite-sex unmarried partners), 578 children (548 natural, 15 adopted, 14 stepchildren), 42 grandchildren, 24 brothers or sisters, 31 parents, 0 foster children, 117 other relatives, 31 non-relatives
Size of family households: 283 2-persons, 175 3-persons, 71 4-persons, 74 5-persons, 7 6-persons, 6 7-or-more-persons.
Size of nonfamily households: 241 1-person, 46 2-persons.
150 married couples with children.
161 single-parent households (42 men, 119 women).
96.8% of residents of Orleans speak English at home.
2.6% of residents speak Spanish at home (11% speak English very well, 89% speak English well).
Foreign born population: 6 (0.3%)
(0.0% of them are naturalized citizens)
| Here: | 6.0 |
| State: | 6.6 |
| Here: | 4.7 |
| State: | 4.3 |

- Bedrooms in owner-occupied houses and condos in Orleans, Indiana
- 0no bedroom
- 201 bedroom
- 702 bedrooms
- 3793 bedrooms
- 654 bedrooms
- 05+ bedrooms

- Bedrooms in renter-occupied apartments in Orleans, Indiana
- 25no bedroom
- 551 bedroom
- 1232 bedrooms
- 1233 bedrooms
- 384 bedrooms
- 75+ bedrooms

- Cars and other vehicles available in Orleans in owner-occupied houses/condos
- 0no vehicle
- 1471 vehicle
- 1602 vehicles
- 1433 vehicles
- 754 vehicles
- 85+ vehicles

- Cars and other vehicles available in Orleans in renter-occupied apartments
- 65no vehicle
- 1321 vehicle
- 1092 vehicles
- 673 vehicles
- 04 vehicles
- 05+ vehicles

- Rooms in owner-occupied houses in Orleans, Indiana
- 01 room
- 02 rooms
- 53 rooms
- 294 rooms
- 1745 rooms
- 1256 rooms
- 1167 rooms
- 358 rooms
- 499+ rooms

- Rooms in renter-occupied apartments in Orleans, Indiana
- 251 room
- 172 rooms
- 213 rooms
- 894 rooms
- 1185 rooms
- 746 rooms
- 137 rooms
- 68 rooms
- 89+ rooms


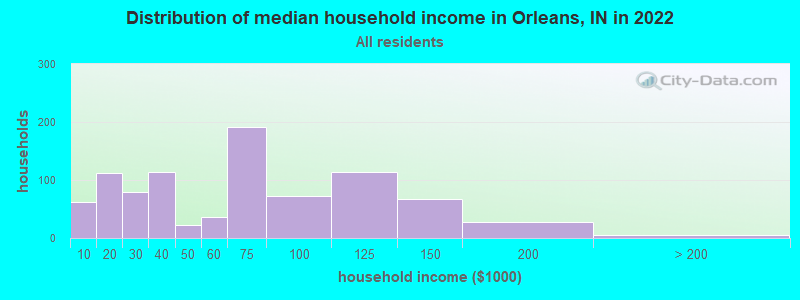
Orleans, IN household income distribution

- 62Less than $10,000
- 112$10,000 to $19,999
- 79$20,000 to $29,999
- 113$30,000 to $39,999
- 23$40,000 to $49,999
- 37$50,000 to $59,999
- 192$60,000 to $74,999
- 72$75,000 to $99,999
- 113$100,000 to $124,999
- 67$125,000 to $149,999
- 28$150,000 to $199,999
- 5$200,000 or more
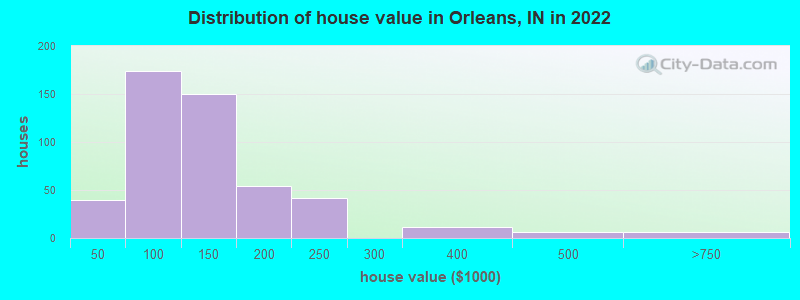
Home value of owner - occupied houses in 2022 in Orleans, IN
-
- 4$15,000 to $19,999
- 5$20,000 to $24,999
- 12$25,000 to $29,999
- 18$40,000 to $49,999
- 14$50,000 to $59,999
- 55$60,000 to $69,999
- 11$70,000 to $79,999
- 37$80,000 to $89,999
- 36$90,000 to $99,999
- 91$100,000 to $124,999
- 59$125,000 to $149,999
- 44$150,000 to $174,999
- 8$175,000 to $199,999
- 41$200,000 to $249,999
- 10$300,000 to $399,999
- 6$400,000 to $499,999
- 5$500,000 to $749,999
Rent paid by renters in 2022 in Orleans, IN
-
- 28$150 to $199
- 26$200 to $249
- 8$250 to $299
- 7$300 to $349
- 47$350 to $399
- 26$400 to $449
- 16$450 to $499
- 31$500 to $549
- 46$550 to $599
- 6$600 to $649
- 66$650 to $699
- 41$700 to $749


Percentage of workers working in this county: 67.2%
Number of people working at home: 92 (9.1% of all workers)
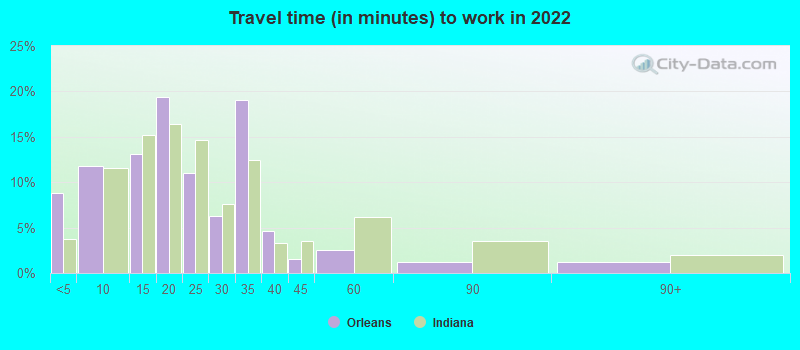
Travel time to work (commute)
- Less than 5 minutes: 89
- 5 to 9 minutes: 51
- 10 to 14 minutes: 242
- 15 to 19 minutes: 87
- 20 to 24 minutes: 80
- 25 to 29 minutes: 59
- 30 to 34 minutes: 73
- 35 to 39 minutes: 52
- 40 to 44 minutes: 19
- 45 to 59 minutes: 94
- 60 to 89 minutes: 57
- 90 or more minutes: 12
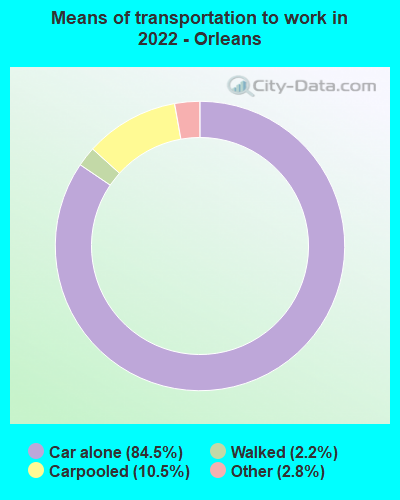
Means of transportation to work:
- Drove a car alone: 719 (75.1%)
- Carpooled: 98 (10.2%)
- Taxi: 28 (2.9%)
- Walked: 18 (1.9%)
- Worked at home: 92 (9.6%)

- Unemployment by race in 2022
- Unemployment rate for White non-Hispanic residents
- 1.9%Males
- 4.3%Females

- Year of entry for the foreign-born population in Orleans, Indiana
- 02010 or later
- 02000 to 2009
- 61990 to 1999
- 01980 to 1989
- 01970 to 1979
- 4Before 1970

First ancestries reported:
- English: 224 (25.8%)
- American: 170 (19.5%)
- Irish: 77 (8.9%)
- German: 72 (8.3%)
- European: 69 (7.9%)
- Scottish: 32 (3.7%)
- French: 6 (0.7%)
- Norwegian: 3 (0.3%)
Most common places of birth for foreign-born residents (%):
| Orleans: | 100.0% (6) |
| Indiana: | 27.0% (101,996) |
Place of birth for U.S.-born residents:
- This state: 1,764
- Other state: 458
- Northeast: 27
- Midwest: 233
- South: 155
- West: 41
92.2% of Orleans residents lived in the same house 1 years ago.
Out of people who lived in different houses, 30.8% lived in this county.
Out of people who lived in different counties, 100.0% lived in Indiana.
| Orleans: | 92.2% |
| State average: | 87.1% |
Education attainment for males 25 years and older:
- No schooling: 0
- Nursery to 4th grade: 0
- 5th and 6th grade: 0
- 7th and 8th grade: 5
- 9th grade: 9
- 10th grade: 9
- 11th grade: 127
- 12th grade, no diploma: 14
- High school graduate (or equivalency): 388
- Less than 1 year of college: 34
- Some college more than 1 year, no degree: 58
- Associate degree: 22
- Bachelor's degree: 56
- Master's degree: 8
- Professional school degree: 0
- Doctorate degree: 12

Education attainment for females 25 years and older:
- No schooling: 0
- Nursery to 4th grade: 0
- 5th and 6th grade: 0
- 7th and 8th grade: 27
- 9th grade: 3
- 10th grade: 41
- 11th grade: 0
- 12th grade, no diploma: 8
- High school graduate (or equivalency): 447
- Less than 1 year of college: 65
- Some college more than 1 year, no degree: 84
- Associate degree: 105
- Bachelor's degree: 62
- Master's degree: 48
- Professional school degree: 0
- Doctorate degree: 0


Housing units in structures:
- One, detached: 779
- One, attached: 6
- Two: 66
- 3 or 4: 51
- 5 to 9: 66
- 20 to 49: 18
- Mobile homes: 76
House/condo owner moved in on average 21 years ago
Renter moved in on average 5 years ago

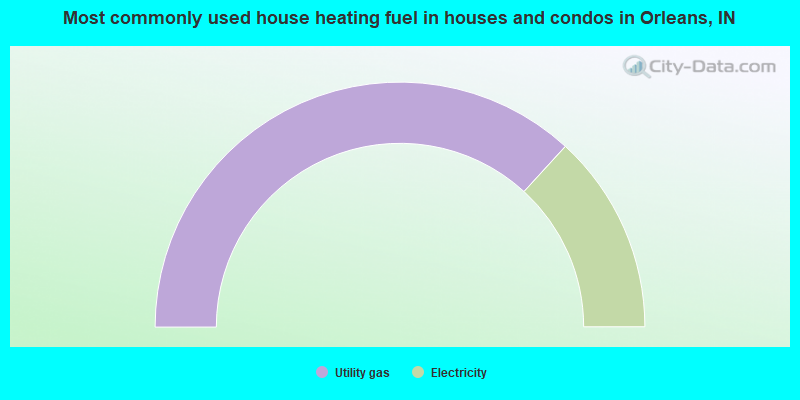
- 73.6%Utility gas
- 26.4%Electricity
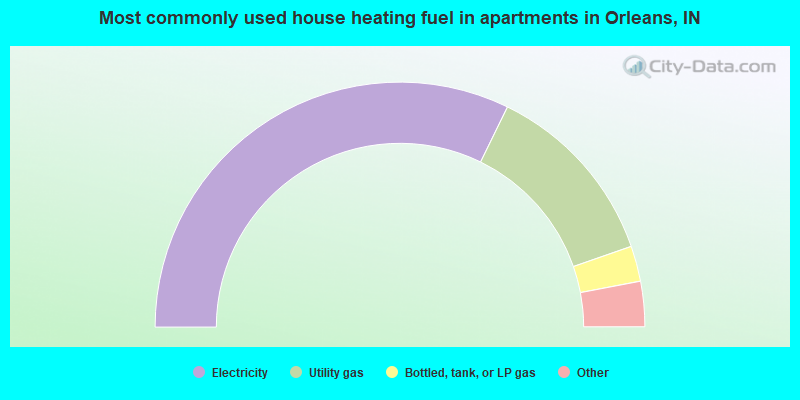
- 64.6%Electricity
- 24.9%Utility gas
- 4.7%Bottled, tank, or LP gas
- 2.8%No fuel used
- 1.9%Other fuel
- 1.1%Wood
Private vs. public school enrollment:
| Here: | 16.7% |
| Indiana: | 14.9% |
| Here: | 7.4% |
| Indiana: | 11.4% |
| Here: | 52.0% |
| Indiana: | 22.3% |


