Olmsted Falls, OH (Ohio) Houses and Residents
| Olmsted Falls: | $218,885 |
| Ohio: | $204,100 |
Mean price in 2022:
Detached houses: $254,337
Here: $254,337 State: $254,366 Townhouses or other attached units: $163,062
Here: $163,062 State: $225,733 In 3-to-4-unit structures: $152,347
Here: $152,347 State: $203,002 In 5-or-more-unit structures: $100,408
Here: $100,408 State: $211,593
Total population: 8,883 (Urban population: 7,739, Rural population: 97 (all nonfarm))
Houses: 3,899 (3,707 occupied: 3,164 owner occupied, 564 renter occupied)
| % of renters here: | 15% |
| State: | 33% |
Housing density: 944 houses/condos per square mile
Median price asked for vacant for-sale houses and condos in 2022 in this county: $148,610.
Median contract rent in 2022: $980 (lower quartile is $907, upper quartile is $1,221)
Median rent asked for vacant for-rent units in 2022: $874
Median gross rent in Olmsted Falls, OH in 2022: $1,167
Housing units in Olmsted Falls with a mortgage: 1,987 (283 second mortgage, 0 home equity loan, 262 both second mortgage and home equity loan)
Houses without a mortgage: 60
Median household income for houses/condos with a mortgage: $98,082
Median household income for apartments without a mortgage: $76,321
Median monthly housing costs: $1,220
Compare current foreclosures in Olmsted Falls, OH:
| Photo | Address | Area | Beds / Baths | Price | Details |
|---|---|---|---|---|---|

|
#1
Redwood Dr
Olmsted Falls, OH 44138
|
1,846 sq. feet
|
2 baths 4 beds |
show details | |

|
#2
Schady Rd
Olmsted Falls, OH 44138
|
2,264 sq. feet
|
3 baths 4 beds |
show details | |

|
#3
Garfield Ave
Olmsted Falls, OH 44138
|
988 sq. feet
|
1 baths 3 beds |
show details | |

|
#4
Pineway Dr
Olmsted Falls, OH 44138
|
1,416 sq. feet
|
1 baths 4 beds |
show details | |

|
#5
Nobottom Rd
Olmsted Falls, OH 44138
|
1,260 sq. feet
|
1 baths 3 beds |
show details | |

|
#6
Lindbergh Blvd
Olmsted Falls, OH 44138
|
2,427 sq. feet
|
2 baths 3 beds |
show details | |

|
#7
Grist Mill Run
Olmsted Falls, OH 44138
|
2,122 sq. feet
|
2 baths 3 beds |
show details | |

|
#8
Mckenzie Rd
Olmsted Falls, OH 44138
|
1,730 sq. feet
|
2 baths 3 beds |
show details | |

|
#9
Lindbergh Blvd
Olmsted Falls, OH 44138
|
3,191 sq. feet
|
3 baths 4 beds |
show details | |

|
#10
Cook Rd
Olmsted Falls, OH 44138
|
1,277 sq. feet
|
1 baths 3 beds |
show details |
| Photo | Address | Area | Beds / Baths | Price | Details |
|---|---|---|---|---|---|

|
#11
Wainwright Ter
Olmsted Falls, OH 44138
|
1,918 sq. feet
|
3 baths 4 beds |
show details | |

|
#12
Raintree Blvd # 131
Olmsted Falls, OH 44138
|
1,752 sq. feet
|
2 baths 3 beds |
show details | |

|
#13
Pembrooke Blvd
Olmsted Falls, OH 44138
|
1,636 sq. feet
|
3 baths 3 beds |
show details | |

|
#14
Hawthorne Ct
Olmsted Falls, OH 44138
|
1,655 sq. feet
|
2 baths 3 beds |
show details | |

|
#15
King Ct
Olmsted Falls, OH 44138
|
2,352 sq. feet
|
2 baths 4 beds |
show details | |

|
#16
Fairlane Dr
Olmsted Falls, OH 44138
|
1,676 sq. feet
|
1 baths 3 beds |
show details | |

|
#17
Tall Oaks Trl
Olmsted Falls, OH 44138
|
2,905 sq. feet
|
2 baths 4 beds |
show details | |

|
#18
Driftwood Dr
Olmsted Falls, OH 44138
|
1,488 sq. feet
|
1 baths 4 beds |
show details | |

|
#19
Usher Rd
Olmsted Falls, OH 44138
|
3,972 sq. feet
|
2 baths 4 beds |
show details | |

|
#20
Cyprus Ln
Olmsted Falls, OH 44138
|
1,726 sq. feet
|
2 baths 3 beds |
show details |
| Photo | Address | Area | Beds / Baths | Price | Details |
|---|---|---|---|---|---|

|
#21
Bradfords Gate
Olmsted Falls, OH 44138
|
2,490 sq. feet
|
2 baths 4 beds |
show details | |

|
#22
Fernwood Dr
Olmsted Falls, OH 44138
|
1,320 sq. feet
|
1 baths 3 beds |
show details | |

|
#23
Heatherwood Cir
Olmsted Falls, OH 44138
|
2,562 sq. feet
|
2 baths 4 beds |
show details | |

|
#24
Fern Cv E
Olmsted Falls, OH 44138
|
1,644 sq. feet
|
2 baths 2 beds |
show details | |

|
#25
Cook Rd
Olmsted Falls, OH 44138
|
960 sq. feet
|
1 baths 3 beds |
show details | |

|
#26
Hawthorne Ct
Olmsted Falls, OH 44138
|
1,468 sq. feet
|
2 baths 3 beds |
show details | |

|
#27
Sunray Dr
Olmsted Falls, OH 44138
|
2,200 sq. feet
|
2 baths 4 beds |
show details | |

|
#28
King Ct
Olmsted Falls, OH 44138
|
- sq. feet
|
2 baths 4 beds |
show details | |

|
#29
Chandlers Ln
Olmsted Falls, OH 44138
|
- sq. feet
|
1 baths 1 beds |
show details | |

|
#30
Grove Pond Way
Olmsted Falls, OH 44138
|
- sq. feet
|
1 baths 2 beds |
show details |
| Photo | Address | Area | Beds / Baths | Price | Details |
|---|---|---|---|---|---|

|
#31
Elgin Oval
Olmsted Falls, OH 44138
|
- sq. feet
|
- baths - beds |
show details | |

|
#32
Douglas Ln Apt 202
Olmsted Falls, OH 44138
|
- sq. feet
|
- baths - beds |
show details | |

|
#33
Parade St
Olmsted Falls, OH 44138
|
- sq. feet
|
- baths - beds |
show details | |

|
#34
Irma Ln
Olmsted Falls, OH 44138
|
- sq. feet
|
- baths - beds |
show details | |

|
#35
Fernwood Dr # K259
Olmsted Falls, OH 44138
|
- sq. feet
|
- baths - beds |
show details | |

|
#36
Ethan Cir
Olmsted Falls, OH 44138
|
- sq. feet
|
- baths - beds |
show details | |

|
#37
Oakwood Cir Apt 211m
Olmsted Falls, OH 44138
|
- sq. feet
|
- baths - beds |
show details | |

|
#38
Cook Rd Apt 9
Olmsted Falls, OH 44138
|
- sq. feet
|
- baths - beds |
show details | |

|
#39
Bradfords Gate
Olmsted Falls, OH 44138
|
- sq. feet
|
- baths - beds |
show details | |

|
#40
Cook Rd Apt 76
Olmsted Falls, OH 44138
|
- sq. feet
|
- baths - beds |
show details |
| Photo | Address | Area | Beds / Baths | Price | Details |
|---|---|---|---|---|---|

|
#41
Lees Ln
Olmsted Falls, OH 44138
|
- sq. feet
|
- baths - beds |
show details | |

|
#42
Carl Ln
Olmsted Falls, OH 44138
|
- sq. feet
|
- baths - beds |
show details | |

|
Check over 1 million property listings on Foreclosure.com!
|
browse all offers | |||


 | Moving to Cleveland from NYC. Buy or rent? Neighborhoods? (21 replies) |
| Safe apartments near NASA Glenn Research Center? (20 replies) |
| Charming “Main Street” Places in or near Cleveland (133 replies) |
| where are the liberal, family friendly suburbs? (83 replies) |
| What is it really like in burbs of Cleveland? (45 replies) |
| Toledo or Cleveland (80 replies) |

Median year apartment built: 1978
Household type by relationship:
Households: 8,528- Male householders: 1,657 (373 living alone), Female householders: 1,993 (825 living alone)
1,858 spouses (1,817 opposite-sex spouses), 321 unmarried partners, (310 opposite-sex unmarried partners), 2,261 children (2,087 natural, 0 adopted, 174 stepchildren), 53 grandchildren, 25 brothers or sisters, 24 parents, 0 foster children, 98 other relatives, 134 non-relatives
- In group quarters: 99
Size of family households: 1,333 2-persons, 292 3-persons, 369 4-persons, 180 5-persons, 39 6-persons, 49 7-or-more-persons.
Size of nonfamily households: 1,207 1-person, 229 2-persons, 23 3-persons, 16 4-persons.
1,339 married couples with children.
454 single-parent households (339 men, 115 women).
92.4% of residents of Olmsted Falls speak English at home.
4.3% of residents speak Spanish at home (65% speak English very well, 19% speak English well, 1% speak English not well, 15% don't speak English at all).
0.9% of residents speak other Indo-European language at home (28% speak English very well, 57% speak English well, 15% speak English not well).
1.0% of residents speak Asian or Pacific Island language at home (100% speak English very well).
1.3% of residents speak other language at home (100% speak English very well).
Foreign born population: 358 (4.2%)
(46.6% of them are naturalized citizens)
| Here: | 6.7 |
| State: | 6.7 |
| Here: | 4.3 |
| State: | 4.4 |

- Bedrooms in owner-occupied houses and condos in Olmsted Falls, Ohio
- 0no bedroom
- 341 bedroom
- 8602 bedrooms
- 1,3223 bedrooms
- 8344 bedrooms
- 1155+ bedrooms

- Bedrooms in renter-occupied apartments in Olmsted Falls, Ohio
- 26no bedroom
- 1891 bedroom
- 1652 bedrooms
- 1773 bedrooms
- 04 bedrooms
- 85+ bedrooms

- Cars and other vehicles available in Olmsted Falls in owner-occupied houses/condos
- 50no vehicle
- 1,0941 vehicle
- 1,3862 vehicles
- 5043 vehicles
- 874 vehicles
- 425+ vehicles

- Cars and other vehicles available in Olmsted Falls in renter-occupied apartments
- 32no vehicle
- 2441 vehicle
- 2342 vehicles
- 393 vehicles
- 154 vehicles
- 05+ vehicles

- Rooms in owner-occupied houses in Olmsted Falls, Ohio
- 01 room
- 72 rooms
- 1773 rooms
- 1594 rooms
- 4865 rooms
- 6316 rooms
- 6957 rooms
- 4428 rooms
- 5689+ rooms

- Rooms in renter-occupied apartments in Olmsted Falls, Ohio
- 261 room
- 62 rooms
- 833 rooms
- 1794 rooms
- 775 rooms
- 906 rooms
- 897 rooms
- 08 rooms
- 139+ rooms


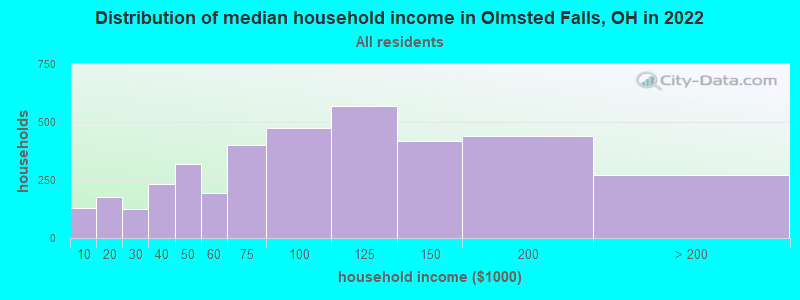
Olmsted Falls, OH household income distribution

- 130Less than $10,000
- 178$10,000 to $19,999
- 124$20,000 to $29,999
- 233$30,000 to $39,999
- 318$40,000 to $49,999
- 194$50,000 to $59,999
- 401$60,000 to $74,999
- 475$75,000 to $99,999
- 568$100,000 to $124,999
- 416$125,000 to $149,999
- 440$150,000 to $199,999
- 270$200,000 or more
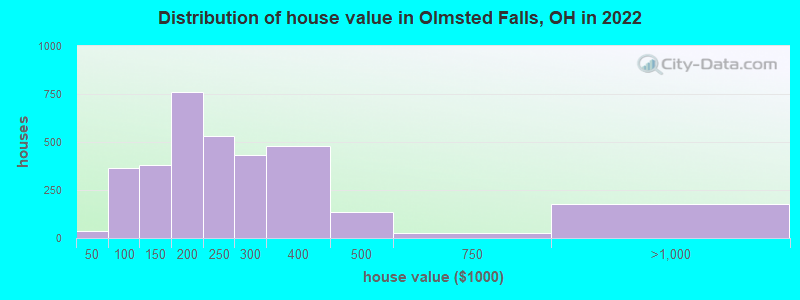
Home value of owner - occupied houses in 2022 in Olmsted Falls, OH
-
- 4$10,000 to $14,999
- 4$20,000 to $24,999
- 29$40,000 to $49,999
- 5$50,000 to $59,999
- 51$60,000 to $69,999
- 39$70,000 to $79,999
- 86$80,000 to $89,999
- 149$90,000 to $99,999
- 173$100,000 to $124,999
- 207$125,000 to $149,999
- 373$150,000 to $174,999
- 387$175,000 to $199,999
- 532$200,000 to $249,999
- 432$250,000 to $299,999
- 478$300,000 to $399,999
- 132$400,000 to $499,999
- 27$500,000 to $749,999
- 174$750,000 to $999,999
- 3$1,500,000 to $1,999,999
Rent paid by renters in 2022 in Olmsted Falls, OH
-
- 4$100 to $149
- 134$800 to $899
- 137$900 to $999
- 153$1,000 to $1,249
- 52$1,250 to $1,499
- 15$1,500 to $1,999
- 9$2,000 to $2,499
- 20$2,500 to $2,999
- 15No cash rent


Percentage of workers working in this county: 87.1%
Number of people working at home: 1,031 (23.3% of all workers)
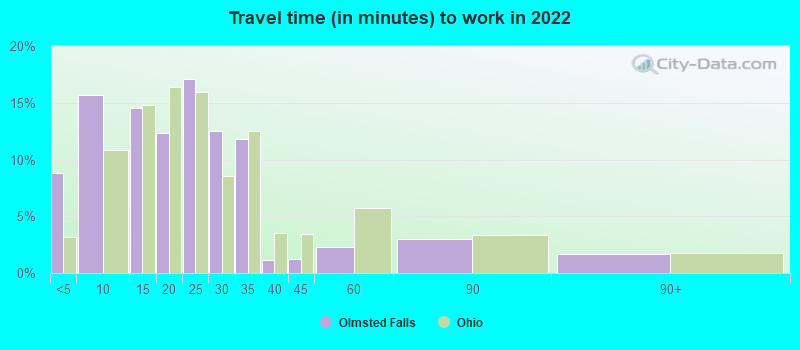
Travel time to work (commute)
- Less than 5 minutes: 76
- 5 to 9 minutes: 230
- 10 to 14 minutes: 380
- 15 to 19 minutes: 498
- 20 to 24 minutes: 414
- 25 to 29 minutes: 558
- 30 to 34 minutes: 471
- 35 to 39 minutes: 196
- 40 to 44 minutes: 209
- 45 to 59 minutes: 256
- 60 to 89 minutes: 78
- 90 or more minutes: 49
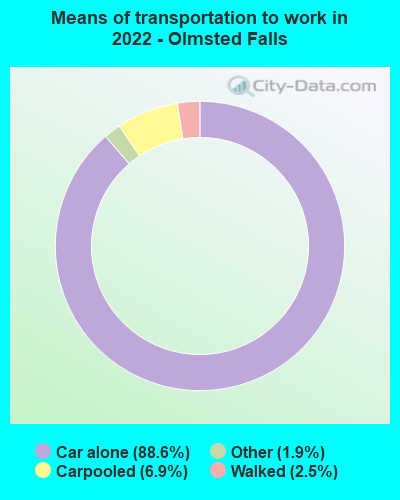
Means of transportation to work:
- Drove a car alone: 1,502 (59.9%)
- Carpooled: 118 (4.7%)
- Taxi: 33 (1.3%)
- Walked: 50 (2.0%)
- Worked at home: 1,031 (41.1%)

- Unemployment by race in 2022
- Unemployment rate for White non-Hispanic residents
- 1.9%Males
- 1.9%Females

- Year of entry for the foreign-born population in Olmsted Falls, Ohio
- 1582010 or later
- 1102000 to 2009
- 511990 to 1999
- 531980 to 1989
- 261970 to 1979
- 77Before 1970
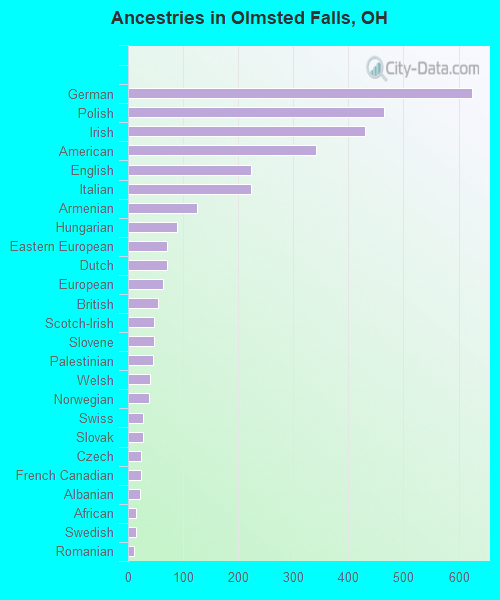
First ancestries reported:
- German: 624 (15.7%)
- Polish: 465 (11.7%)
- Irish: 430 (10.8%)
- American: 341 (8.6%)
- English: 223 (5.6%)
- Italian: 223 (5.6%)
- Armenian: 126 (3.2%)
- Hungarian: 89 (2.2%)
- Eastern European: 71 (1.8%)
- Dutch: 70 (1.8%)
- European: 64 (1.6%)
- British: 54 (1.4%)
- Scotch-Irish: 48 (1.2%)
- Slovene: 47 (1.2%)
- Palestinian: 45 (1.1%)
- Welsh: 40 (1.0%)
- Norwegian: 39 (1.0%)
- Swiss: 28 (0.7%)
- Slovak: 27 (0.7%)
- Czech: 24 (0.6%)
- French Canadian: 23 (0.6%)
- Albanian: 22 (0.6%)
- African: 15 (0.4%)
- Swedish: 14 (0.4%)
- Romanian: 11 (0.3%)
- Scandinavian: 11 (0.3%)
- French: 10 (0.3%)
- Ukrainian: 10 (0.3%)
- Croatian: 6 (0.2%)
- Czechoslovakian: 6 (0.2%)
- Scottish: 4 (0.1%)
- Pennsylvania German: 3 (0.08%)
- Maltese: 2 (0.05%)
Most common places of birth for foreign-born residents (%):
| Olmsted Falls: | 22.9% (85) |
| Ohio: | 0.8% (4,309) |
| Olmsted Falls: | 15.1% (56) |
| Ohio: | 6.2% (35,703) |
| Olmsted Falls: | 12.7% (47) |
| Ohio: | 7.8% (44,796) |
| Olmsted Falls: | 7.5% (28) |
| Ohio: | 0.3% (1,875) |
| Olmsted Falls: | 6.2% (23) |
| Ohio: | 0.4% (2,186) |
| Olmsted Falls: | 4.0% (15) |
| Ohio: | 11.6% (66,525) |
| Olmsted Falls: | 3.8% (14) |
| Ohio: | 1.1% (6,346) |
| Olmsted Falls: | 3.8% (14) |
| Ohio: | 2.2% (12,846) |
| Olmsted Falls: | 3.5% (13) |
| Ohio: | 1.0% (5,979) |
| Olmsted Falls: | 3.0% (11) |
| Ohio: | 3.1% (17,818) |
| Olmsted Falls: | 1.9% (7) |
| Ohio: | 2.6% (14,988) |
Place of birth for U.S.-born residents:
- This state: 6,696
- Other state: 1,299
- Northeast: 372
- Midwest: 394
- South: 299
- West: 231
78.7% of Olmsted Falls residents lived in the same house 1 years ago.
Out of people who lived in different houses, 34.4% lived in this county.
Out of people who lived in different counties, 86.6% lived in Ohio.
| Olmsted Falls: | 78.7% |
| State average: | 87.8% |
Education attainment for males 25 years and older:
- No schooling: 0
- Nursery to 4th grade: 0
- 5th and 6th grade: 0
- 7th and 8th grade: 0
- 9th grade: 0
- 10th grade: 37
- 11th grade: 6
- 12th grade, no diploma: 59
- High school graduate (or equivalency): 692
- Less than 1 year of college: 208
- Some college more than 1 year, no degree: 421
- Associate degree: 219
- Bachelor's degree: 829
- Master's degree: 270
- Professional school degree: 62
- Doctorate degree: 50

Education attainment for females 25 years and older:
- No schooling: 10
- Nursery to 4th grade: 0
- 5th and 6th grade: 0
- 7th and 8th grade: 0
- 9th grade: 0
- 10th grade: 36
- 11th grade: 0
- 12th grade, no diploma: 3
- High school graduate (or equivalency): 902
- Less than 1 year of college: 173
- Some college more than 1 year, no degree: 446
- Associate degree: 307
- Bachelor's degree: 759
- Master's degree: 607
- Professional school degree: 108
- Doctorate degree: 20


Housing units in structures:
- One, detached: 2,559
- One, attached: 623
- Two: 29
- 3 or 4: 62
- 5 to 9: 74
- 10 to 19: 244
- 20 to 49: 246
- 50 or more: 56
House/condo owner moved in on average 11 years ago
Renter moved in on average 2 years ago

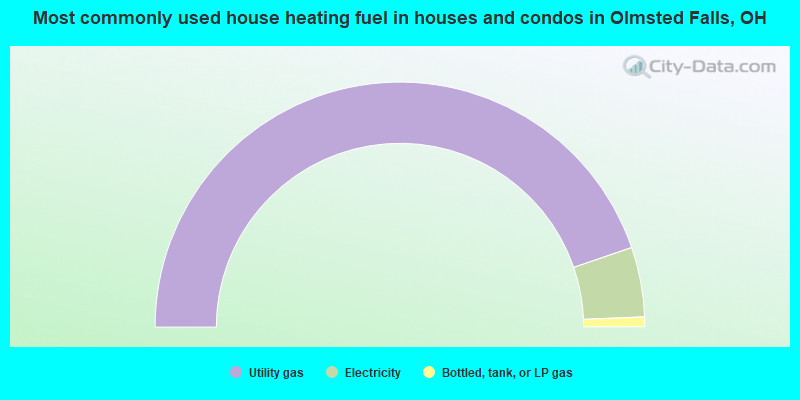
- 89.5%Utility gas
- 9.2%Electricity
- 1.3%Bottled, tank, or LP gas
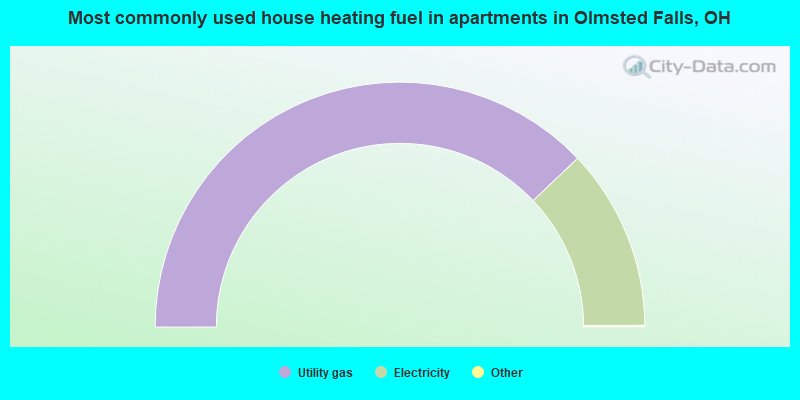
- 76.0%Utility gas
- 24.0%Electricity
Private vs. public school enrollment:
| Here: | 5.8% |
| Ohio: | 16.0% |
| Here: | 9.5% |
| Ohio: | 13.1% |
| Here: | 26.5% |
| Ohio: | 22.3% |


