Oakland, MD (Maryland) Houses and Residents
| Oakland: | $263,656 |
| Maryland: | $398,100 |
Mean price in 2022:
Detached houses: $258,957
Here: $258,957 State: $526,819 Mobile homes: $25,770
Here: $25,770 State: $89,353
Total population: 1,905 (Urban population: 1,735 (all inside urban clusters), Rural population: 224 (all nonfarm))
Houses: 1,131 (911 occupied: 487 owner occupied, 436 renter occupied)
| % of renters here: | 47% |
| State: | 32% |
Housing density: 537 houses/condos per square mile
Median price asked for vacant for-sale houses and condos in 2022: $427,079.
Median contract rent in 2022: $540
Median rent asked for vacant for-rent units in 2022: $415
Median gross rent in Oakland, MD in 2022: $618
Housing units in Oakland with a mortgage: 367 (43 second mortgage, 0 home equity loan, 45 both second mortgage and home equity loan)
Houses without a mortgage: 20
Median household income for houses/condos with a mortgage: $85,739
Median household income for apartments without a mortgage: $46,491
Median monthly housing costs: $893
Compare current foreclosures near Oakland, MD:
| Photo | Address | Area | Beds / Baths | Price | Details |
|---|---|---|---|---|---|

|
#1
Sunnyside Rd
Oakland, MD 21550
|
2,184 sq. feet
|
2 baths 3 beds |
show details | |

|
#2
K St
Oakland, MD 21550
|
- sq. feet
|
1 baths 4 beds |
show details | |

|
#3
Kelly Dr
Oakland, MD 21550
|
1,904 sq. feet
|
2 baths - beds |
show details | |

|
#4
Bray School Rd
Oakland, MD 21550
|
2,334 sq. feet
|
1 baths - beds |
show details | |

|
#5
Foster Rd
Oakland, MD 21550
|
1,677 sq. feet
|
1 baths - beds |
show details | |

|
#6
King Wildesen Rd
Oakland, MD 21550
|
1,736 sq. feet
|
2 baths - beds |
show details | |

|
#7
Underwood Rd
Oakland, MD 21550
|
1,152 sq. feet
|
1 baths - beds |
show details | |

|
#8
Obrien St
Oakland, MD 21550
|
1,104 sq. feet
|
1 baths - beds |
show details | |

|
#9
N St
Oakland, MD 21550
|
- sq. feet
|
- baths - beds |
show details | |

|
#10
L St
Oakland, MD 21550
|
- sq. feet
|
- baths - beds |
show details |
| Photo | Address | Area | Beds / Baths | Price | Details |
|---|---|---|---|---|---|

|
#11
W Beverly St
Kingwood, WV 26537
|
1,246 sq. feet
|
1 baths 2 beds |
$54,900
|
show details |

|
#12
K St
Oakland, MD 21550
|
- sq. feet
|
- baths - beds |
show details | |

|
#13
Pine Street
Elk Garden, WV 26717
|
1,310 sq. feet
|
1 baths 3 beds |
show details | |

|
#14
N Ridge Rd
Mc Henry, MD 21541
|
1,248 sq. feet
|
2 baths - beds |
show details | |

|
#15
Brandonville Pike
Terra Alta, WV 26764
|
- sq. feet
|
- baths - beds |
show details | |

|
#16
Highland Ave
Terra Alta, WV 26764
|
- sq. feet
|
- baths - beds |
show details | |

|
#17
N Shore Dr
Swanton, MD 21561
|
- sq. feet
|
- baths - beds |
show details | |

|
#18
Feather Rd
Terra Alta, WV 26764
|
- sq. feet
|
- baths - beds |
show details | |

|
#19
Main St
Albright, WV 26519
|
- sq. feet
|
- baths - beds |
show details | |

|
#20
Union Hwy
Mount Storm, WV 26739
|
- sq. feet
|
- baths - beds |
show details |
| Photo | Address | Area | Beds / Baths | Price | Details |
|---|---|---|---|---|---|

|
#21
Rock Lodge Road
Accident, MD 21520
|
- sq. feet
|
- baths - beds |
show details | |

|
Check over 1 million property listings on Foreclosure.com!
|
browse all offers | |||

Latest news about housing in Oakland, MD collected exclusively by city-data.com from local newspapers, TV, and radio stations

 | Is Oakland, MD a nice area or challenging to live? (8 replies) |
| Apartments Columbia MD (11 replies) |
| Cumberland MD house hunt for weekends and vacation (17 replies) |
| Ted Leonsis has talked to Gov. Wes Moore about arena plans (33 replies) |
| Western Md Looking to Secede to WV (84 replies) |
| 25 years old living in poverty in the Bay Area, looking for a place to buy and rent (14 replies) |

Median year apartment built: 1991
Household type by relationship:
Households: 1,995- Male householders: 427 (193 living alone), Female householders: 475 (198 living alone)
421 spouses (405 opposite-sex spouses), 5 unmarried partners, (5 opposite-sex unmarried partners), 444 children (431 natural, 1 adopted, 12 stepchildren), 23 grandchildren, 7 brothers or sisters, 0 parents, 0 foster children, 22 other relatives, 17 non-relatives
- In group quarters: 154
Size of family households: 227 2-persons, 97 3-persons, 128 4-persons, 16 5-persons, 8 6-persons.
Size of nonfamily households: 408 1-person, 41 2-persons.
204 married couples with children.
80 single-parent households (0 men, 80 women).
97.9% of residents of Oakland speak English at home.
1.0% of residents speak Spanish at home (39% speak English very well, 61% speak English well).
0.6% of residents speak other Indo-European language at home (100% speak English very well).
0.2% of residents speak Asian or Pacific Island language at home (100% speak English not well).
Foreign born population: 27 (1.4%)
(88.9% of them are naturalized citizens)
| Here: | 7.2 |
| State: | 7.3 |
| Here: | 3.9 |
| State: | 4.2 |

- Bedrooms in owner-occupied houses and condos in Oakland, Maryland
- 0no bedroom
- 41 bedroom
- 912 bedrooms
- 2873 bedrooms
- 444 bedrooms
- 615+ bedrooms

- Bedrooms in renter-occupied apartments in Oakland, Maryland
- 0no bedroom
- 1891 bedroom
- 1352 bedrooms
- 1043 bedrooms
- 04 bedrooms
- 95+ bedrooms

- Cars and other vehicles available in Oakland in owner-occupied houses/condos
- 7no vehicle
- 1481 vehicle
- 2442 vehicles
- 663 vehicles
- 244 vehicles
- 05+ vehicles

- Cars and other vehicles available in Oakland in renter-occupied apartments
- 125no vehicle
- 1661 vehicle
- 842 vehicles
- 613 vehicles
- 04 vehicles
- 05+ vehicles

- Rooms in owner-occupied houses in Oakland, Maryland
- 01 room
- 02 rooms
- 03 rooms
- 404 rooms
- 225 rooms
- 1606 rooms
- 337 rooms
- 938 rooms
- 1409+ rooms

- Rooms in renter-occupied apartments in Oakland, Maryland
- 01 room
- 82 rooms
- 1533 rooms
- 1174 rooms
- 915 rooms
- 336 rooms
- 237 rooms
- 38 rooms
- 99+ rooms


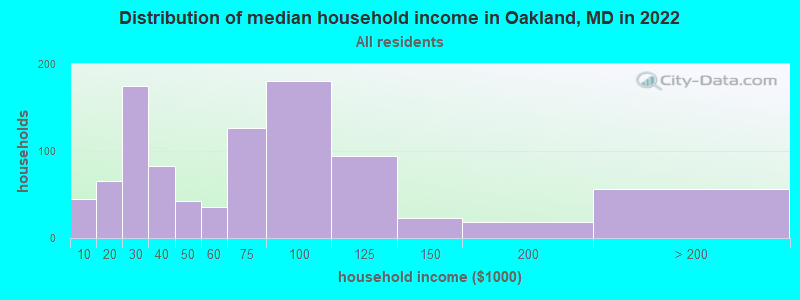
Oakland, MD household income distribution

- 45Less than $10,000
- 65$10,000 to $19,999
- 175$20,000 to $29,999
- 83$30,000 to $39,999
- 42$40,000 to $49,999
- 36$50,000 to $59,999
- 127$60,000 to $74,999
- 180$75,000 to $99,999
- 94$100,000 to $124,999
- 23$125,000 to $149,999
- 18$150,000 to $199,999
- 56$200,000 or more
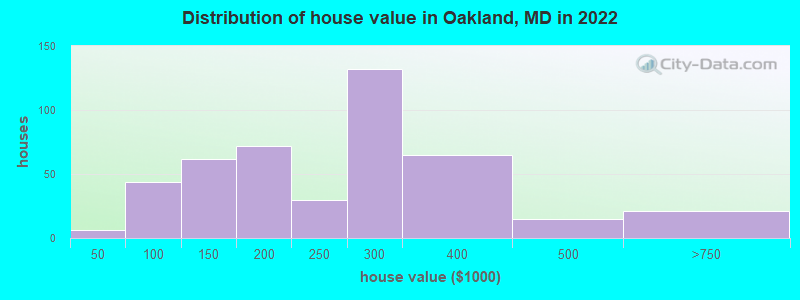
Home value of owner - occupied houses in 2022 in Oakland, MD
-
- 5$40,000 to $49,999
- 6$50,000 to $59,999
- 11$60,000 to $69,999
- 11$80,000 to $89,999
- 8$90,000 to $99,999
- 33$100,000 to $124,999
- 28$125,000 to $149,999
- 27$150,000 to $174,999
- 44$175,000 to $199,999
- 30$200,000 to $249,999
- 131$250,000 to $299,999
- 64$300,000 to $399,999
- 14$400,000 to $499,999
- 20$500,000 to $749,999
Rent paid by renters in 2022 in Oakland, MD
-
- 17$100 to $149
- 78$150 to $199
- 30$200 to $249
- 18$250 to $299
- 5$300 to $349
- 8$350 to $399
- 12$400 to $449
- 8$450 to $499
- 9$500 to $549
- 39$550 to $599
- 31$600 to $649
- 11$650 to $699
- 7$700 to $749
- 5$800 to $899
- 11$900 to $999
- 16$1,000 to $1,249
- 68$1,500 to $1,999
- 29No cash rent


Percentage of workers working in this county: 100.5%
Number of people working at home: 118 (13.7% of all workers)
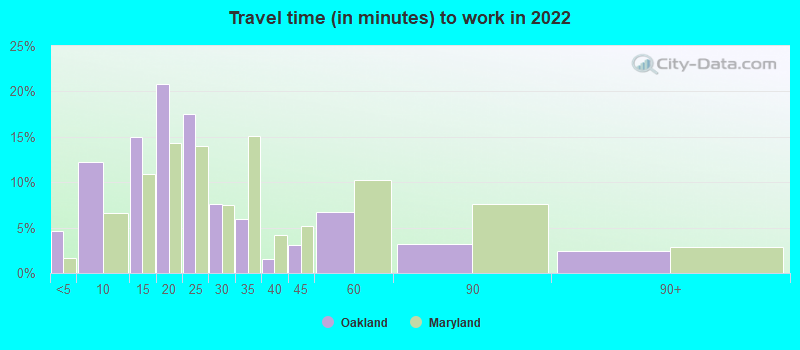
Travel time to work (commute)
- Less than 5 minutes: 129
- 5 to 9 minutes: 221
- 10 to 14 minutes: 119
- 15 to 19 minutes: 80
- 20 to 24 minutes: 101
- 25 to 29 minutes: 13
- 30 to 34 minutes: 39
- 35 to 39 minutes: 0
- 40 to 44 minutes: 0
- 45 to 59 minutes: 27
- 60 to 89 minutes: 0
- 90 or more minutes: 4
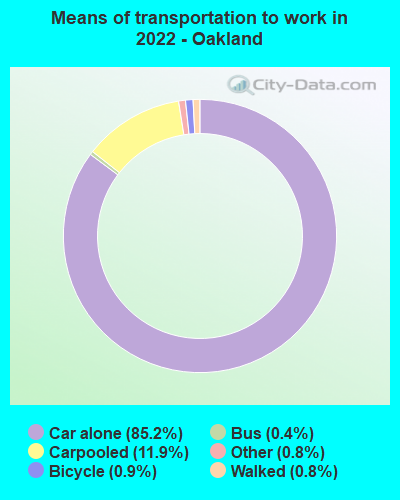
Means of transportation to work:
- Drove a car alone: 2,799 (78.5%)
- Carpooled: 415 (11.6%)
- Bus: 11 (0.3%)
- Taxi: 28 (0.8%)
- Bicycle: 33 (0.9%)
- Walked: 25 (0.7%)
- Worked at home: 118 (3.3%)

- Unemployment by race in 2022
- Unemployment rate for White non-Hispanic residents
- 2.3%Males
- 0.7%Females

- Year of entry for the foreign-born population in Oakland, Maryland
- 42010 or later
- 62000 to 2009
- 51990 to 1999
- 01980 to 1989
- 01970 to 1979
- 8Before 1970

First ancestries reported:
- German: 306 (37.5%)
- English: 183 (22.4%)
- Irish: 105 (12.9%)
- American: 79 (9.7%)
- French Canadian: 26 (3.2%)
- Italian: 21 (2.6%)
- European: 16 (2.0%)
- Scottish: 10 (1.2%)
- Carpatho Rusyn: 7 (0.9%)
- Pennsylvania German: 5 (0.6%)
- Swedish: 5 (0.6%)
- Swiss: 5 (0.6%)
- Canadian: 4 (0.5%)
- Polish: 4 (0.5%)
- British: 2 (0.2%)
- Russian: 1 (0.1%)
Most common places of birth for foreign-born residents (%):
| Oakland: | 44.4% (12) |
| Maryland: | 1.2% (11,265) |
| Oakland: | 14.8% (4) |
| Maryland: | 0.2% (1,463) |
| Oakland: | 7.4% (2) |
| Maryland: | 3.4% (32,635) |
| Oakland: | 7.4% (2) |
| Maryland: | 1.0% (9,481) |
| Oakland: | 7.4% (2) |
| Maryland: | 1.8% (17,161) |
Place of birth for U.S.-born residents:
- This state: 1,323
- Other state: 620
- Northeast: 194
- Midwest: 60
- South: 342
- West: 20
82.0% of Oakland residents lived in the same house 1 years ago.
Out of people who lived in different houses, 24.4% lived in this county.
Out of people who lived in different counties, 88.1% lived in Maryland.
| Oakland: | 82.0% |
| State average: | 88.5% |
Education attainment for males 25 years and older:
- No schooling: 14
- Nursery to 4th grade: 0
- 5th and 6th grade: 0
- 7th and 8th grade: 15
- 9th grade: 0
- 10th grade: 2
- 11th grade: 24
- 12th grade, no diploma: 15
- High school graduate (or equivalency): 245
- Less than 1 year of college: 55
- Some college more than 1 year, no degree: 23
- Associate degree: 46
- Bachelor's degree: 99
- Master's degree: 57
- Professional school degree: 115
- Doctorate degree: 0

Education attainment for females 25 years and older:
- No schooling: 7
- Nursery to 4th grade: 0
- 5th and 6th grade: 0
- 7th and 8th grade: 11
- 9th grade: 0
- 10th grade: 2
- 11th grade: 35
- 12th grade, no diploma: 22
- High school graduate (or equivalency): 392
- Less than 1 year of college: 77
- Some college more than 1 year, no degree: 93
- Associate degree: 64
- Bachelor's degree: 81
- Master's degree: 50
- Professional school degree: 7
- Doctorate degree: 7


Housing units in structures:
- One, detached: 701
- One, attached: 56
- Two: 38
- 3 or 4: 23
- 5 to 9: 118
- 10 to 19: 24
- 20 to 49: 143
- 50 or more: 16
- Mobile homes: 9
Housing units lacking complete kitchen facilities in 2022: 2.1%
House/condo owner moved in on average 16 years ago
Renter moved in on average 7 years ago

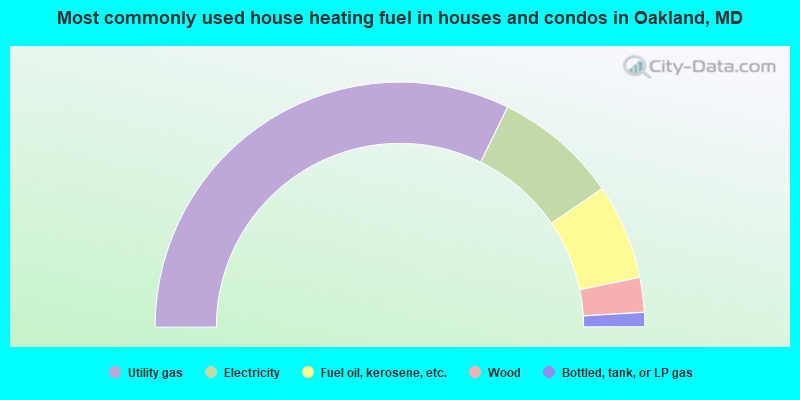
- 64.5%Utility gas
- 16.4%Electricity
- 12.6%Fuel oil, kerosene, etc.
- 4.6%Wood
- 1.9%Bottled, tank, or LP gas
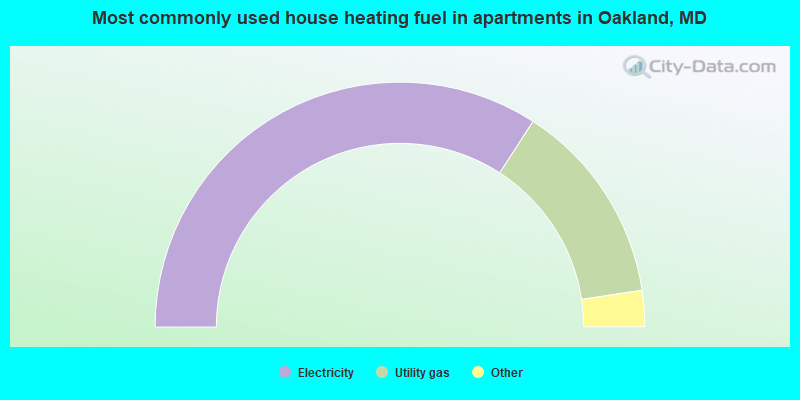
- 68.5%Electricity
- 27.0%Utility gas
- 3.8%Wood
- 0.7%Fuel oil, kerosene, etc.
Private vs. public school enrollment:
| Here: | 0.0% |
| Maryland: | 15.2% |
| Here: | 4.8% |
| Maryland: | 14.4% |
| Here: | 0.0% |
| Maryland: | 20.2% |


