Northport, ME (Maine) Houses and Residents
| Northport: | $315,130 |
| Maine: | $290,600 |
Total population: 1,520 (Urban population: 0, Rural population: 1,324 (4 farm, 1,320 nonfarm))
Houses: 940 (564 occupied: 478 owner occupied, 86 renter occupied)
| % of renters here: | 15% |
| State: | 26% |
Housing density: 40 houses/condos per square mile
Median price asked for vacant for-sale houses and condos in 2022 in this county: $454,579.
Median contract rent in 2022: $901 (lower quartile is $683, upper quartile is $1,261)
Median rent asked for vacant for-rent units in 2022: $1,201
Median gross rent in Northport, ME in 2022: $1,002
Housing units in Northport with a mortgage: 163 (20 second mortgage, 22 home equity loan, 0 both second mortgage and home equity loan)
Houses without a mortgage: 123
Compare current foreclosures near Northport, ME:
| Photo | Address | Area | Beds / Baths | Price | Details |
|---|---|---|---|---|---|

|
#1
Mount Ephraim Rd
Searsport, ME 04974
|
1,972 sq. feet
|
2 baths 4 beds |
$134,500
|
show details |

|
#2
Lawn Ave
Rockland, ME 04841
|
1,809 sq. feet
|
1 baths 3 beds |
show details | |

|
#3
Rolerson Rd
Belfast, ME 04915
|
1,064 sq. feet
|
1 baths 3 beds |
show details | |

|
#4
Beech Hill Rd
Rockport, ME 04856
|
2,491 sq. feet
|
3 baths 5 beds |
show details | |

|
#5
Rockville St
Rockport, ME 04856
|
1,000 sq. feet
|
1 baths 3 beds |
show details | |

|
#6
Meadow St
Rockport, ME 04856
|
1,191 sq. feet
|
1 baths 3 beds |
show details | |

|
#7
Chris Rd
Rockport, ME 04856
|
2,470 sq. feet
|
2 baths 3 beds |
show details | |

|
#8
City Point Rd
Belfast, ME 04915
|
576 sq. feet
|
1 baths 2 beds |
show details | |

|
#9
Lexington Ln
Rockport, ME 04856
|
2,568 sq. feet
|
4 baths 4 beds |
show details | |

|
#10
Old County Rd
Rockland, ME 04841
|
1,353 sq. feet
|
1 baths 3 beds |
show details |
| Photo | Address | Area | Beds / Baths | Price | Details |
|---|---|---|---|---|---|

|
#11
Augusta Rd
Morrill, ME 04952
|
2,060 sq. feet
|
1 baths - beds |
show details | |

|
#12
Augusta Rd
Morrill, ME 04952
|
1,554 sq. feet
|
1 baths - beds |
show details | |

|
#13
Damon Rd
Stockton Springs, ME 04981
|
1,107 sq. feet
|
- baths - beds |
show details | |

|
#14
Loop Rd
Searsport, ME 04974
|
- sq. feet
|
- baths - beds |
show details | |

|
#15
Cooper Rd
Morrill, ME 04952
|
- sq. feet
|
- baths - beds |
show details | |

|
#16
Alder Ln
Deer Isle, ME 04627
|
- sq. feet
|
- baths - beds |
show details | |

|
#17
Muskrat Farm Rd
Stockton Springs, ME 04981
|
- sq. feet
|
- baths - beds |
show details | |

|
#18
Purple Heart Hwy
Brooks, ME 04921
|
- sq. feet
|
- baths - beds |
show details | |

|
#19
Coastal Rd
Brooksville, ME 04617
|
- sq. feet
|
- baths - beds |
show details | |

|
#20
Rocky Rd
Lincolnville, ME 04849
|
- sq. feet
|
- baths - beds |
show details |
| Photo | Address | Area | Beds / Baths | Price | Details |
|---|---|---|---|---|---|

|
#21
Swan Lake Ave
Belfast, ME 04915
|
- sq. feet
|
- baths - beds |
show details | |

|
#22
Peabody Rd
Union, ME 04862
|
- sq. feet
|
- baths - beds |
show details | |

|
#23
Belfast Rd
Thorndike, ME 04986
|
- sq. feet
|
- baths - beds |
show details | |

|
#24
Prescott Hill Rd
Lincolnville, ME 04849
|
- sq. feet
|
- baths - beds |
show details | |

|
#25
Oak Hill Rd
Belfast, ME 04915
|
- sq. feet
|
- baths - beds |
show details | |

|
#26
Goose Falls Rd
Harborside, ME 04642
|
- sq. feet
|
- baths - beds |
show details | |

|
#27
Harborside Rd
Harborside, ME 04642
|
- sq. feet
|
- baths - beds |
show details | |

|
#28
Jesse Robbins Rd
Belfast, ME 04915
|
- sq. feet
|
- baths - beds |
show details | |

|
#29
Beach Rd
Lincolnville, ME 04849
|
- sq. feet
|
- baths - beds |
show details | |

|
#30
Whitney Rd
Lincolnville, ME 04849
|
- sq. feet
|
- baths - beds |
show details |
| Photo | Address | Area | Beds / Baths | Price | Details |
|---|---|---|---|---|---|

|
#31
Belfast Rd
Lincolnville, ME 04849
|
- sq. feet
|
- baths - beds |
show details | |

|
#32
Jones Hill Rd
Union, ME 04862
|
- sq. feet
|
- baths - beds |
show details | |

|
Check over 1 million property listings on Foreclosure.com!
|
browse all offers | |||
Latest news about housing in Northport, ME collected exclusively by city-data.com from local newspapers, TV, and radio stations

 | Weighing risks of giving up current situation and moving to Maine (41 replies) |
| Well, here goes. The start to our trek North to Maine, our new home-state. (395 replies) |
| Knox County....Apartments (1 reply) |
| Looking for info on 179 Northport Avenue in Belfast, Maine (6 replies) |
| Bargain -Unappreciated Maine towns - houses (59 replies) |
| Can I afford to live in Maine? (34 replies) |

Household type by relationship:
Households: 38,285- In family households: 30,972 (7,278 male householders, 3,349 female householders)
8,223 spouses, 9,535 children (8,658 natural, 319 adopted, 558 stepchildren), 613 grandchildren, 192 brothers or sisters, 260 parents, foster children, 242 other relatives, 1,089 non-relatives
- In nonfamily households: 7,313 (2,660 male householders (1,986 living alone)), 3,144 female householders (2,568 living alone)), 1,509 nonrelatives
- In group quarters: 501 (128 institutionalized population)
5,931 married couples with children.
2,178 single-parent households (647 men, 1,531 women).
95.7% of residents of Northport speak English at home.
1.4% of residents speak Spanish at home (100% speak English very well).
2.4% of residents speak other Indo-European language at home (90% speak English very well, 7% speak English well, 3% speak English not well).
0.5% of residents speak Asian or Pacific Island language at home (50% speak English very well, 50% speak English well).
Foreign born population: 63 (4.3%)
(57.1% of them are naturalized citizens)
| Here: | 6.1 |
| State: | 6.1 |
| Here: | 4.2 |
| State: | 4.0 |

- Bedrooms in owner-occupied houses and condos in Northport, Maine
- 0no bedroom
- 261 bedroom
- 1742 bedrooms
- 1883 bedrooms
- 694 bedrooms
- 215+ bedrooms

- Bedrooms in renter-occupied apartments in Northport, Maine
- 3no bedroom
- 141 bedroom
- 312 bedrooms
- 283 bedrooms
- 104 bedrooms
- 05+ bedrooms

- Cars and other vehicles available in Northport in owner-occupied houses/condos
- 8no vehicle
- 1491 vehicle
- 2112 vehicles
- 653 vehicles
- 394 vehicles
- 65+ vehicles

- Cars and other vehicles available in Northport in renter-occupied apartments
- 5no vehicle
- 451 vehicle
- 322 vehicles
- 23 vehicles
- 24 vehicles
- 05+ vehicles

- Rooms in owner-occupied houses in Northport, Maine
- 01 room
- 22 rooms
- 273 rooms
- 924 rooms
- 1165 rooms
- 866 rooms
- 527 rooms
- 498 rooms
- 549+ rooms

- Rooms in renter-occupied apartments in Northport, Maine
- 01 room
- 52 rooms
- 103 rooms
- 274 rooms
- 155 rooms
- 186 rooms
- 57 rooms
- 48 rooms
- 29+ rooms


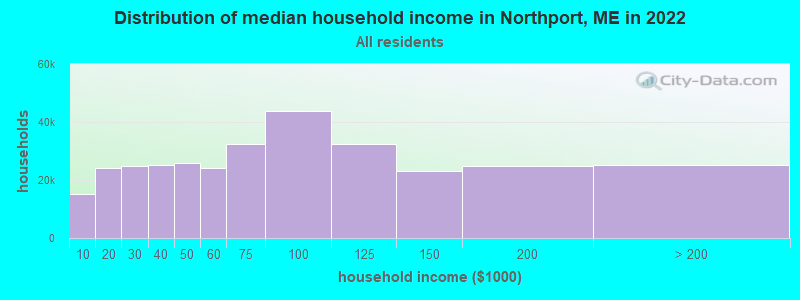
Northport, ME household income distribution

- 14,748Less than $10,000
- 27,451$10,000 to $19,999
- 28,438$20,000 to $29,999
- 28,283$30,000 to $39,999
- 28,356$40,000 to $49,999
- 28,379$50,000 to $59,999
- 35,809$60,000 to $74,999
- 54,046$75,000 to $99,999
- 39,041$100,000 to $124,999
- 26,043$125,000 to $149,999
- 28,769$150,000 to $199,999
- 29,744$200,000 or more
Percentage of workers working in this county: 75.7%
Number of people working at home: 98 (14.3% of all workers)
Travel time to work (commute)
- Less than 5 minutes: 26
- 5 to 9 minutes: 103
- 10 to 14 minutes: 167
- 15 to 19 minutes: 81
- 20 to 24 minutes: 61
- 25 to 29 minutes: 16
- 30 to 34 minutes: 47
- 35 to 39 minutes: 14
- 40 to 44 minutes: 14
- 45 to 59 minutes: 17
- 60 to 89 minutes: 27
- 90 or more minutes: 8
Means of transportation to work:
- Drove a car alone: 477 (77.6%)
- Carpooled: 73 (11.9%)
- Subway or elevated: 3 (0.5%)
- Ferryboat: 4 (0.7%)
- Walked: 19 (3.1%)
- Other means: 5 (0.8%)
- Worked at home: 34 (5.5%)


- Year of entry for the foreign-born population in Northport, Maine
- 101995 to March 2000
- 31990 to 1994
- 21985 to 1989
- 61980 to 1984
- 01975 to 1979
- 21970 to 1974
- 71965 to 1969
- 21Before 1965

First ancestries reported:
- English: 325 (23.7%)
- Irish: 284 (20.7%)
- Other: 146 (10.7%)
- French: 117 (8.5%)
- German: 100 (7.3%)
- United States: 99 (7.2%)
- Scottish: 53 (3.9%)
- Italian: 51 (3.7%)
- Scotch-Irish: 34 (2.5%)
- Swedish: 28 (2.0%)
- Dutch: 23 (1.7%)
- French Canadian: 21 (1.5%)
- Polish: 19 (1.4%)
- Russian: 11 (0.8%)
- Welsh: 10 (0.7%)
- Norwegian: 9 (0.7%)
- Danish: 7 (0.5%)
- Czech: 6 (0.4%)
- Swiss: 6 (0.4%)
- Arab: 4 (0.3%)
- Greek: 4 (0.3%)
- Lithuanian: 4 (0.3%)
- Portuguese: 3 (0.2%)
- West Indian: 3 (0.2%)
- Subsaharan African: 2 (0.1%)
Most common places of birth for foreign-born residents (%):
| Northport: | 35.3% (18) |
| Maine: | 41.4% (15,199) |
| Northport: | 23.5% (12) |
| Maine: | 7.8% (2,856) |
| Northport: | 9.8% (5) |
| Maine: | 1.5% (551) |
| Northport: | 5.9% (3) |
| Maine: | 2.5% (900) |
| Northport: | 5.9% (3) |
| Maine: | 1.5% (565) |
| Northport: | 5.9% (3) |
| Maine: | 0.4% (160) |
| Northport: | 5.9% (3) |
| Maine: | 0.7% (257) |
| Northport: | 3.9% (2) |
| Maine: | 0.6% (234) |
| Northport: | 3.9% (2) |
| Maine: | 0.5% (178) |
Place of birth for U.S.-born residents:
- This state: 730
- Other state: 536
- Northeast: 357
- Midwest: 94
- South: 67
- West: 18
62% of Northport residents lived in the same house 5 years ago.
Out of people who lived in different houses, 48% lived in this county.
Out of people who lived in different counties, 36% lived in Maine.
Education attainment for males 25 years and older:
- No schooling: 3
- Nursery to 4th grade: 0
- 5th and 6th grade: 2
- 7th and 8th grade: 25
- 9th grade: 4
- 10th grade: 11
- 11th grade: 9
- 12th grade, no diploma: 15
- High school graduate (or equivalency): 179
- Less than 1 year of college: 18
- Some college more than 1 year, no degree: 62
- Associate degree: 19
- Bachelor's degree: 100
- Master's degree: 18
- Professional school degree: 20
- Doctorate degree: 0

Education attainment for females 25 years and older:
- No schooling: 0
- Nursery to 4th grade: 0
- 5th and 6th grade: 0
- 7th and 8th grade: 16
- 9th grade: 4
- 10th grade: 14
- 11th grade: 5
- 12th grade, no diploma: 17
- High school graduate (or equivalency): 165
- Less than 1 year of college: 14
- Some college more than 1 year, no degree: 62
- Associate degree: 46
- Bachelor's degree: 96
- Master's degree: 34
- Professional school degree: 18
- Doctorate degree: 6


Housing units in structures:
- One, detached: 792
- One, attached: 7
- Two: 14
- 3 or 4: 9
- 5 to 9: 6
- Mobile homes: 110
- Boats, RVs, vans, etc.: 2
Median worth of mobile homes: $70,416
Housing units lacking complete kitchen facilities: 1.8%

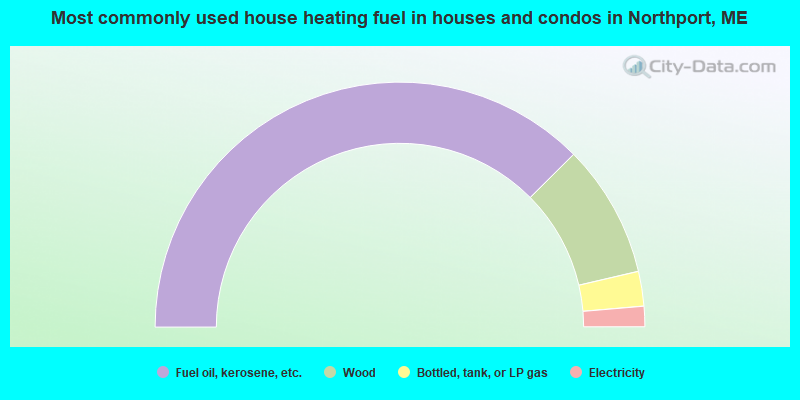
- 75.1%Fuel oil, kerosene, etc.
- 17.6%Wood
- 4.6%Bottled, tank, or LP gas
- 2.7%Electricity
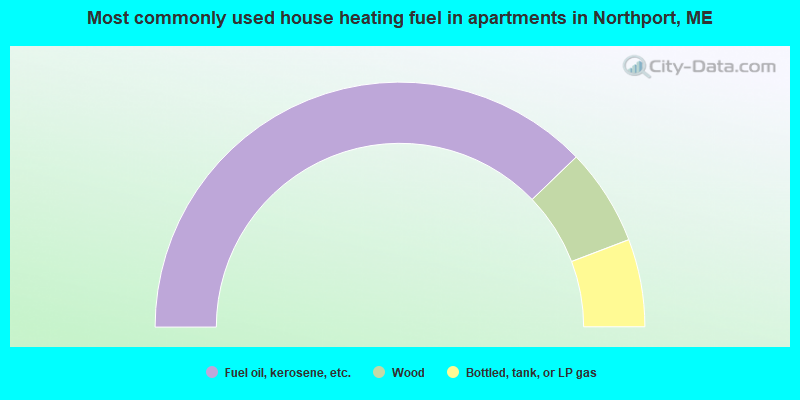
- 75.6%Fuel oil, kerosene, etc.
- 12.8%Wood
- 11.6%Bottled, tank, or LP gas
Private vs. public school enrollment:
| Here: | 5.1% |
| Maine: | 6.9% |
| Here: | 11.3% |
| Maine: | 8.9% |
| Here: | 46.7% |
| Maine: | 28.3% |


