North Lauderdale, FL (Florida) Houses and Residents
Estimated median house or condo value in 2022: $264,747 (it was $87,400 in 2000 )
North Lauderdale:
$264,747Florida:
$354,100
Lower value quartile - upper value quartile: $196,016 - $374,275Mean price in 2022: Detached houses: $353,538 Here:
$353,538State:
$500,941
Townhouses or other attached units: $262,487 Here:
$262,487State:
$370,869
In 2-unit structures: $348,361 Here:
$348,361State:
$423,188
In 3-to-4-unit structures: $218,762 Here:
$218,762State:
$309,944
In 5-or-more-unit structures: $219,158 Here:
$219,158State:
$447,145
Mobile homes: $131,814 Here:
$131,814State:
$113,202
Total population: 43,214 (Urban population: 32,323, Rural population: 0)
Houses: 16,468 (15,529 occupied: 9,050 owner occupied, 6,573 renter occupied )
% of renters here:
42%State:
33%
Housing density: 4,246 houses/condos per square mile
Median price asked for vacant for-sale houses and condos in 2022: $213,937.
Median contract rent in 2022: $1,743 (lower quartile is $1,427, upper quartile is $1,984)
Median rent asked for vacant for-rent units in 2022: $1,556
Median gross rent in North Lauderdale, FL in 2022: $1,929
Housing units in North Lauderdale with a mortgage: 5,973 (249 second mortgage, 0 home equity loan, 120 both second mortgage and home equity loan )Houses without a mortgage: 74
Median household income for houses/condos with a mortgage: $74,973
Median household income for apartments without a mortgage: $43,818
Median monthly housing costs: $1,670
Data:
Median house or condo value ($)
Median house or condo value ($ change since 2000)
Median house or condo value ($) - White
Median house or condo value ($) - Black or African American
Median house or condo value ($) - Asian
Median house or condo value ($) - Hispanic or Latino
Median house or condo value ($) - American Indian and Alaska Native
Median house or condo value ($) - Multirace
Median house or condo value ($) - Other Race
Median price asked for mobile homes ($)
Household density (households per square mile)
Mean house or condo value by units in structure - 1, detached ($)
Mean house or condo value by units in structure - 1, attached ($)
Mean house or condo value by units in structure - 2 ($)
Mean house or condo value by units in structure by units in structure - 3 or 4 ($)
Mean house or condo value by units in structure - 5 or more ($)
Mean house or condo value by units in structure - Boat, RV, van, etc. ($)
Mean house or condo value by units in structure - Mobile home ($)
Median contract rent ($)
Median contract rent - Lower quartile ($)
Median contract rent - Upper quartile ($)
Median gross rent ($)
Urban houses (%)
Rural houses (%)
Houses occupied (%)
Houses occupied (% change since 2000)
Houses owner occupied (%)
Houses owner occupied (% change since 2000)
Houses renter occupied (%)
Houses renter occupied (% change since 2000)
Vacant housing units - For rent (%)
Vacant housing units - For rent (% change since 2000)
Vacant housing units - For sale only (%)
Vacant housing units - For sale only (% change since 2000)
Vacant housing units - Rented or sold, not occupied (%)
Vacant housing units - Rented or sold, not occupied (% change since 2000)
Vacant housing units - For seasonal, recreational, or occasional use (%)
Vacant housing units - For seasonal, recreational, or occasional use (% change since 2000)
Vacant housing units - For migrant workers (%)
Vacant housing units - For migrant workers (% change since 2000)
Vacant housing units - Other vacant (%)
Vacant housing units - Other vacant (% change since 2000)
Median monthly housing costs ($)
Median household income for houses/condos with a mortgage ($)
Median household income for houses/condos without a mortgage ($)
Median household income ($)
Median household income ($) - White
Median household income ($) - Black or African American
Median household income ($) - Asian
Median household income ($) - Hispanic or Latino
Median household income ($) - American Indian and Alaska Native
Median household income ($) - Multirace
Median household income ($) - Other Race
Mortgage status - with mortgage (%)
Mortgage status - with second mortgage (%)
Mortgage status - with home equity loan (%)
Mortgage status - with both second mortgage and home equity loan (%)
Mortgage status - without a mortgage (%)
Median year house/condo built
Median year apartment built
Household type by relationship - Male householder living alone (%)
Household type by relationship - Male householder not living alone (%)
Household type by relationship - Female householder living alone (%)
Household type by relationship - Female householder not living alone (%)
Household type by relationship - Opposite-Sex spouse (%)
Household type by relationship - Same-Sex spouse (%)
Household type by relationship - Opposite-Sex unmarried partner (%)
Household type by relationship - Same-Sex unmarried partner (%)
Household type by relationship - In group quarters (%)
Size of family households - 2-person household (%)
Size of family households - 3-person household (%)
Size of family households - 4-person household (%)
Size of family households - 5-person household (%)
Size of family households - 6-person household (%)
Size of family households - 7-or-more-person household (%)
Size of nonfamily households - 1-person household (%)
Size of nonfamily households - 2-person household (%)
Size of nonfamily households - 3-person household (%)
Size of nonfamily households - 4-person household (%)
Size of nonfamily households - 5-person household (%)
Size of nonfamily households - 6-person household (%)
Size of nonfamily households - 7-or-moreperson household (%)
Year house built - Built 2010 or later (%)
Year house built - Built 2000 to 2009 (%)
Year house built - Built 1990 to 1999 (%)
Year house built - Built 1980 to 1989 (%)
Year house built - Built 1970 to 1979 (%)
Year house built - Built 1960 to 1969 (%)
Year house built - Built 1950 to 1959 (%)
Year house built - Built 1940 to 1949 (%)
Year house built - Built 1939 or earlier (%)
Median number of rooms in houses and condos
Median number of rooms in apartments
Median number of bedrooms in owner occupied houses
Mean number of bedrooms in owner occupied houses
Median number of bedrooms in renter occupied houses
Mean number of bedrooms in renter occupied houses
Median number of vehichles in owner occupied houses
Mean number of vehichles in owner occupied houses
Median number of vehichles in renter occupied houses
Mean number of vehichles in renter occupied houses
Rooms in owner-occupied houses - 1 room (%)
Rooms in owner-occupied houses - 2 rooms (%)
Rooms in owner-occupied houses - 3 rooms (%)
Rooms in owner-occupied houses - 4 rooms (%)
Rooms in owner-occupied houses - 5 rooms (%)
Rooms in owner-occupied houses - 6 rooms (%)
Rooms in owner-occupied houses - 7 rooms (%)
Rooms in owner-occupied houses - 8 rooms (%)
Rooms in owner-occupied houses - 9+ rooms (%)
Rooms in renter-occupied houses - 1 room (%)
Rooms in renter-occupied houses - 2 rooms (%)
Rooms in renter-occupied houses - 3 rooms (%)
Rooms in renter-occupied houses - 4 rooms (%)
Rooms in renter-occupied houses - 5 rooms (%)
Rooms in renter-occupied houses - 6 rooms (%)
Rooms in renter-occupied houses - 7 rooms (%)
Rooms in renter-occupied houses - 8 rooms (%)
Rooms in renter-occupied houses - 9+ rooms (%)
Bedrooms in owner-occupied houses - no bedrooms (%)
Bedrooms in owner-occupied houses - 1 bedroom (%)
Bedrooms in owner-occupied houses - 2 bedrooms (%)
Bedrooms in owner-occupied houses - 3 bedrooms (%)
Bedrooms in owner-occupied houses - 4 bedrooms (%)
Bedrooms in owner-occupied houses - 5+ bedrooms (%)
Bedrooms in renter-occupied houses - no bedrooms (%)
Bedrooms in renter-occupied houses - 1 bedroom (%)
Bedrooms in renter-occupied houses - 2 bedrooms (%)
Bedrooms in renter-occupied houses - 3 bedrooms (%)
Bedrooms in renter-occupied houses - 4 bedrooms (%)
Bedrooms in renter-occupied houses - 5+ bedrooms (%)
Vehicles available in owner-occupied houses - no vehicle available (%)
Vehicles available in owner-occupied houses - 1 vehicle available(%)
Vehicles available in owner-occupied houses - 2 Vehicles available (%)
Vehicles available in owner-occupied houses - 3 Vehicles available (%)
Vehicles available in owner-occupied houses - 4 Vehicles available (%)
Vehicles available in owner-occupied houses - 5+ Vehicles available (%)
Vehicles available in renter-occupied houses - no vehicle available (%)
Vehicles available in renter-occupied houses - 1 vehicle available (%)
Vehicles available in renter-occupied houses - 2 Vehicles available (%)
Vehicles available in renter-occupied houses - 3 Vehicles available (%)
Vehicles available in renter-occupied houses - 4 Vehicles available (%)
Vehicles available in renter-occupied houses - 5+ Vehicles available (%)
Housing units in structures - 1, detached (%)
Housing units in structures - 1, attached (%)
Housing units in structures - 2 (%)
Housing units in structures - 3 or 4 (%)
Housing units in structures - 5 to 9 (%)
Housing units in structures - 10 to 19 (%)
Housing units in structures - 20 to 49 (%)
Housing units in structures - 50 or more (%)
Housing units in structures - Mobile home (%)
Housing units in structures - Boat, RV, van, etc. (%)
Housing units in structures - Owners - 1, detached (%)
Housing units in structures - Owners - 1, attached (%)
Housing units in structures - Owners - 2 (%)
Housing units in structures - Owners - 3 or 4 (%)
Housing units in structures - Owners - 5 to 9 (%)
Housing units in structures - Owners - 10 to 19 (%)
Housing units in structures - Owners - 20 to 49 (%)
Housing units in structures - Owners - 50 or more (%)
Housing units in structures - Owners - Mobile home (%)
Housing units in structures - Owners - Boat, RV, van, etc. (%)
Housing units in structures - Renters - 1, detached (%)
Housing units in structures - Renters - 1, attached (%)
Housing units in structures - Renters - 2 (%)
Housing units in structures - Renters - 3 or 4 (%)
Housing units in structures - Renters - 5 to 9 (%)
Housing units in structures - Renters - 10 to 19 (%)
Housing units in structures - Renters - 20 to 49 (%)
Housing units in structures - Renters - 50 or more (%)
Housing units in structures - Renters - Mobile home (%)
Housing units in structures - Renters - Boat, RV, van, etc. (%)
House/condo owner moved in on average (years ago)
Renter moved in on average (years ago)
Year householder moved into unit - Moved in 1999 to March 2000 (%)
Year householder moved into unit - Moved in 1999 to March 2000 (%) - White
Year householder moved into unit - Moved in 1999 to March 2000 (%) - Black or African American
Year householder moved into unit - Moved in 1999 to March 2000 (%) - Asian
Year householder moved into unit - Moved in 1999 to March 2000 (%) - Hispanic or Latino
Year householder moved into unit - Moved in 1999 to March 2000 (%) - American Indian and Alaska Native
Year householder moved into unit - Moved in 1999 to March 2000 (%) - Multirace
Year householder moved into unit - Moved in 1999 to March 2000 (%) - Other Race
Year householder moved into unit - Moved in 1995 to 1998 (%)
Year householder moved into unit - Moved in 1995 to 1998 (%) - White
Year householder moved into unit - Moved in 1995 to 1998 (%) - Black or African American
Year householder moved into unit - Moved in 1995 to 1998 (%) - Asian
Year householder moved into unit - Moved in 1995 to 1998 (%) - Hispanic or Latino
Year householder moved into unit - Moved in 1995 to 1998 (%) - American Indian and Alaska Native
Year householder moved into unit - Moved in 1995 to 1998 (%) - Multirace
Year householder moved into unit - Moved in 1995 to 1998 (%) - Other Race
Year householder moved into unit - Moved in 1990 to 1994 (%)
Year householder moved into unit - Moved in 1990 to 1994 (%) - White
Year householder moved into unit - Moved in 1990 to 1994 (%) - Black or African American
Year householder moved into unit - Moved in 1990 to 1994 (%) - Asian
Year householder moved into unit - Moved in 1990 to 1994 (%) - Hispanic or Latino
Year householder moved into unit - Moved in 1990 to 1994 (%) - American Indian and Alaska Native
Year householder moved into unit - Moved in 1990 to 1994 (%) - Multirace
Year householder moved into unit - Moved in 1990 to 1994 (%) - Other Race
Year householder moved into unit - Moved in 1980 to 1989 (%)
Year householder moved into unit - Moved in 1980 to 1989 (%) - White
Year householder moved into unit - Moved in 1980 to 1989 (%) - Black or African American
Year householder moved into unit - Moved in 1980 to 1989 (%) - Asian
Year householder moved into unit - Moved in 1980 to 1989 (%) - Hispanic or Latino
Year householder moved into unit - Moved in 1980 to 1989 (%) - American Indian and Alaska Native
Year householder moved into unit - Moved in 1980 to 1989 (%) - Multirace
Year householder moved into unit - Moved in 1980 to 1989 (%) - Other Race
Year householder moved into unit - Moved in 1970 to 1979 (%)
Year householder moved into unit - Moved in 1970 to 1979 (%) - White
Year householder moved into unit - Moved in 1970 to 1979 (%) - Black or African American
Year householder moved into unit - Moved in 1970 to 1979 (%) - Asian
Year householder moved into unit - Moved in 1970 to 1979 (%) - Hispanic or Latino
Year householder moved into unit - Moved in 1970 to 1979 (%) - American Indian and Alaska Native
Year householder moved into unit - Moved in 1970 to 1979 (%) - Multirace
Year householder moved into unit - Moved in 1970 to 1979 (%) - Other Race
Year householder moved into unit - Moved in 1969 or earlier (%)
Year householder moved into unit - Moved in 1969 or earlier (%) - White
Year householder moved into unit - Moved in 1969 or earlier (%) - Black or African American
Year householder moved into unit - Moved in 1969 or earlier (%) - Asian
Year householder moved into unit - Moved in 1969 or earlier (%) - Hispanic or Latino
Year householder moved into unit - Moved in 1969 or earlier (%) - American Indian and Alaska Native
Year householder moved into unit - Moved in 1969 or earlier (%) - Multirace
Year householder moved into unit - Moved in 1969 or earlier (%) - Other Race
Housing units lacking complete plumbing facilities (%)
Housing units lacking complete kitchen facilities (%)
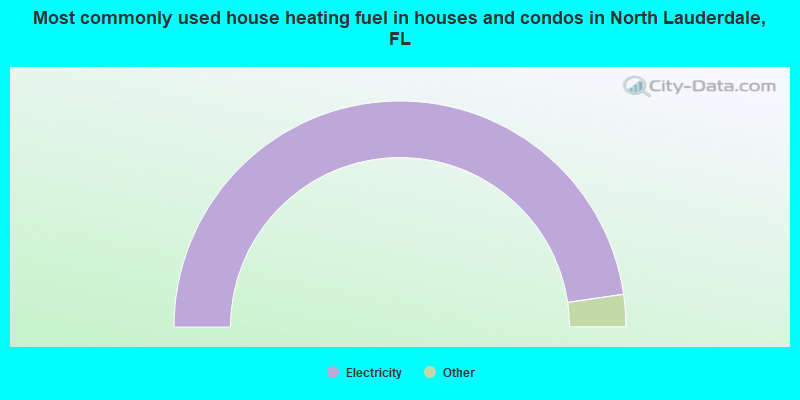
House heating fuel used in houses and condos - Utility gas (%)
House heating fuel used in houses and condos - Bottled, tank, or LP gas (%)
House heating fuel used in houses and condos - Electricity (%)
House heating fuel used in houses and condos - Fuel oil, kerosene, etc. (%)
House heating fuel used in houses and condos - Coal or coke (%)
House heating fuel used in houses and condos - Wood (%)
House heating fuel used in houses and condos - Solar energy (%)
House heating fuel used in houses and condos - Other fuel (%)
House heating fuel used in houses and condos - No fuel used (%)
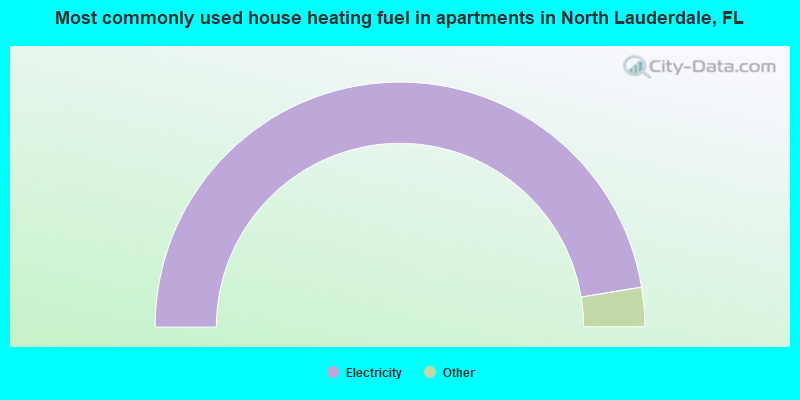
House heating fuel used in apartments - Utility gas (%)
House heating fuel used in apartments - Bottled, tank, or LP gas (%)
House heating fuel used in apartments - Electricity (%)
House heating fuel used in apartments - Fuel oil, kerosene, etc. (%)
House heating fuel used in apartments - Coal or coke (%)
House heating fuel used in apartments - Wood (%)
House heating fuel used in apartments - Solar energy (%)
House heating fuel used in apartments - Other fuel (%)
House heating fuel used in apartments - No fuel used (%)
Median year house/condo built: 1977Median year apartment built: 1979Household type by relationship:
Households: 44,775
Male householders: 6,006 (1,650 living alone ), Female householders: 9,435 (2,597 living alone )6,117 spouses (6,113 opposite-sex spouses ), 1,384 unmarried partners , (1,256 opposite-sex unmarried partners ), 15,314 children (14,107 natural , 481 adopted , 725 stepchildren ), 903 grandchildren , 1,094 brothers or sisters , 1,404 parents , 0 foster children , 1,555 other relatives , 1,500 non-relatives In group quarters: 58
Size of family households: 3,415 2-persons , 3,338 3-persons , 2,141 4-persons , 1,125 5-persons , 390 6-persons , 418 7-or-more-persons .
Size of nonfamily households: 4,204 1-person , 549 2-persons , 63 3-persons .
4,052 married couples with children. single-parent households (621 men , 4,445 women ).
54.9% of residents of North Lauderdale speak English at home. of residents speak Spanish at home (53% speak English very well , 20% speak English well , 17% speak English not well , 10% don't speak English at all ).of residents speak other Indo-European language at home (52% speak English very well , 23% speak English well , 14% speak English not well , 10% don't speak English at all ).of residents speak Asian or Pacific Island language at home (55% speak English very well , 28% speak English well , 17% speak English not well ).of residents speak other language at home (99% speak English very well , 1% speak English well ).
Foreign born population: 22,665 (50.6%)of them are naturalized citizens )
Median number of rooms in houses and condos:
Median number of rooms in apartments
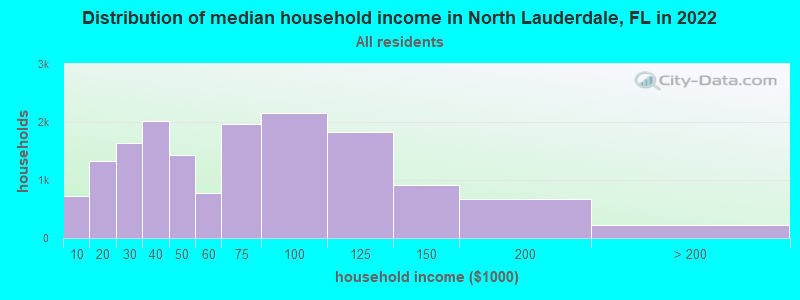
North Lauderdale, FL household income distribution 717 Less than $10,0001,327 $10,000 to $19,9991,634 $20,000 to $29,9992,023 $30,000 to $39,9991,436 $40,000 to $49,999769 $50,000 to $59,9991,967 $60,000 to $74,9992,163 $75,000 to $99,9991,836 $100,000 to $124,999913 $125,000 to $149,999667 $150,000 to $199,999225 $200,000 or more
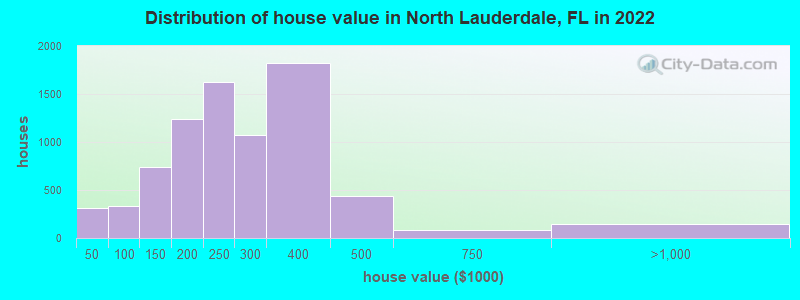
Home value of owner - occupied houses in 2022 in North Lauderdale, FL 82 Less than $10,00031 $10,000 to $14,99943 $15,000 to $19,99935 $20,000 to $24,99946 $25,000 to $29,99921 $30,000 to $34,99917 $35,000 to $39,99929 $40,000 to $49,99934 $50,000 to $59,99913 $60,000 to $69,999115 $70,000 to $79,999124 $80,000 to $89,99915 $90,000 to $99,999334 $100,000 to $124,999409 $125,000 to $149,999604 $150,000 to $174,999638 $175,000 to $199,9991,621 $200,000 to $249,9991,067 $250,000 to $299,9991,821 $300,000 to $399,999440 $400,000 to $499,99978 $500,000 to $749,999140 $750,000 to $999,999Rent paid by renters in 2022 in North Lauderdale, FL 39 $100 to $14910 $500 to $54924 $550 to $5999 $600 to $649128 $700 to $74949 $750 to $79919 $800 to $89982 $900 to $999476 $1,000 to $1,2491,237 $1,250 to $1,4993,391 $1,500 to $1,999890 $2,000 to $2,49937 $2,500 to $2,999155 No cash rent
Percentage of workers working in this county: 88.0%Number of people working at home: 1,524 (6.1% of all workers )
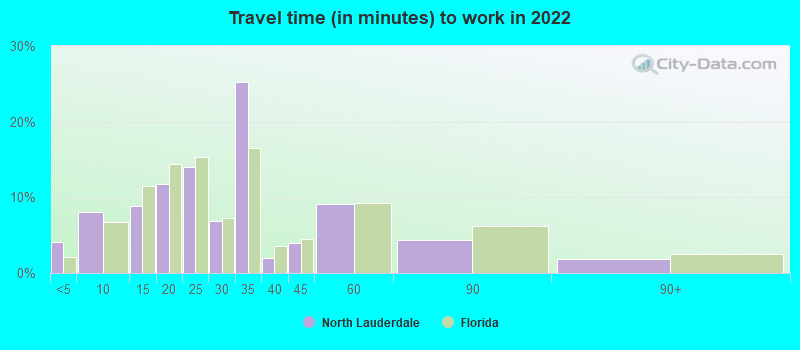
Travel time to work (commute)
Less than 5 minutes: 3575 to 9 minutes: 43010 to 14 minutes: 1,94915 to 19 minutes: 2,80920 to 24 minutes: 4,44725 to 29 minutes: 1,16430 to 34 minutes: 5,76135 to 39 minutes: 95840 to 44 minutes: 1,03745 to 59 minutes: 1,79260 to 89 minutes: 1,41290 or more minutes: 698
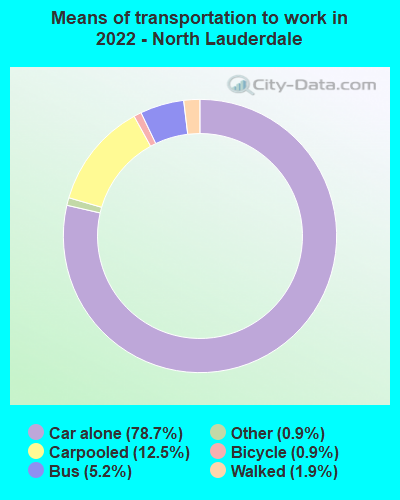
Means of transportation to work:
Drove a car alone: 4,377 (61.7%)Carpooled: 793 (11.2%)Bus : 311 (4.4%)Taxi: 51 (0.7%)Bicycle: 59 (0.8%)Walked: 120 (1.7%)Worked at home: 1,524 (21.5%)
Unemployment by race in 2022
Unemployment rate for White non-Hispanic residents 6.6% MalesUnemployment rate for Black residents 4.7% Males8.3% FemalesUnemployment rate for other race residents 3.7% Males11.4% FemalesUnemployment rate for two or more race residents 1.0% Males6.2% FemalesUnemployment rate for Hispanic or Latino residents 0.9% Males5.7% Females
Year of entry for the foreign-born population in North Lauderdale, Florida
7,114 2010 or later 6,048 2000 to 2009 4,754 1990 to 1999 3,784 1980 to 1989 1,367 1970 to 1979 753 Before 1970
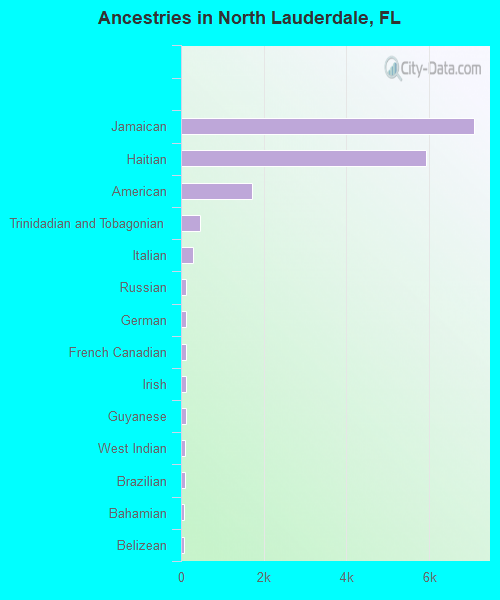
First ancestries reported:
Jamaican: 7,095 (21.9%)
Haitian: 5,914 (18.2%)
American: 1,708 (5.3%)
Trinidadian and Tobagonian: 459 (1.4%)
Italian: 279 (0.9%)
Russian: 130 (0.4%)
German: 123 (0.4%)
French Canadian: 122 (0.4%)
Irish: 121 (0.4%)
Guyanese: 112 (0.3%)
West Indian: 100 (0.3%)
Brazilian: 86 (0.3%)
Bahamian: 80 (0.2%)
Belizean: 71 (0.2%)
Romanian: 49 (0.2%)
English: 48 (0.1%)
Austrian: 47 (0.1%)
Barbadian: 32 (0.10%)
French: 31 (0.10%)
Scottish: 27 (0.08%)
Polish: 25 (0.08%)
African: 22 (0.07%)
Portuguese: 21 (0.06%)
Nigerian: 19 (0.06%)
European: 16 (0.05%)
Hungarian: 16 (0.05%)
Czech: 13 (0.04%)
Dutch: 9 (0.03%)
Greek: 5 (0.02%) Most common places of birth for foreign-born residents (%): Jamaica North Lauderdale:
28.1% (6,361)Florida:
5.0% (227,319)
Haiti North Lauderdale:
23.7% (5,365)Florida:
7.5% (342,375)
El Salvador North Lauderdale:
9.2% (2,079)Florida:
1.1% (49,838)
Colombia North Lauderdale:
4.1% (918)Florida:
6.5% (298,669)
Trinidad and Tobago North Lauderdale:
3.6% (812)Florida:
1.0% (43,642)
Mexico North Lauderdale:
2.8% (645)Florida:
5.6% (257,152)
Peru North Lauderdale:
2.8% (633)Florida:
2.1% (96,693)
Dominican Republic North Lauderdale:
2.5% (561)Florida:
3.0% (137,727)
Cuba North Lauderdale:
2.0% (448)Florida:
22.0% (1,006,576)
Honduras North Lauderdale:
1.9% (438)Florida:
2.3% (107,160)
Place of birth for U.S.-born residents:
This state: 15,822Other state: 5,513Northeast: 3,498Midwest: 736South: 850West: 429 89.7% of North Lauderdale residents lived in the same house 1 years ago.
Out of people who lived in different houses, 42.8% lived in this county.
Out of people who lived in different counties, 52.2% lived in Florida.
North Lauderdale:
89.7%State average:
86.3%
Education attainment for males 25 years and older:
No schooling: 643Nursery to 4th grade: 1625th and 6th grade: 757th and 8th grade: 1509th grade: 32110th grade: 19611th grade: 17412th grade, no diploma: 840High school graduate (or equivalency): 4,834Less than 1 year of college: 1,269Some college more than 1 year, no degree: 1,159Associate degree: 1,415Bachelor's degree: 1,650Master's degree: 545Professional school degree: 85Doctorate degree: 124
Education attainment for females 25 years and older:
No schooling: 634Nursery to 4th grade: 695th and 6th grade: 5107th and 8th grade: 1529th grade: 26910th grade: 29811th grade: 32112th grade, no diploma: 615High school graduate (or equivalency): 4,559Less than 1 year of college: 766Some college more than 1 year, no degree: 1,690Associate degree: 1,950Bachelor's degree: 2,383Master's degree: 988Professional school degree: 249Doctorate degree: 231
Housing units in structures:
One, detached: 6,429One, attached: 2,258Two: 3913 or 4: 1,1345 to 9: 1,13010 to 19: 1,39520 to 49: 1,68950 or more: 1,345Mobile homes: 693Median worth of mobile homes: $22,945
Housing units lacking complete plumbing facilities in 2022: 0.2%Housing units lacking complete kitchen facilities in 2022: 0.2%House/condo owner moved in on average 9 years ago
Renter moved in on average 4 years ago
Private vs. public school enrollment:
Students in private schools in grades 1 to 8 (elementary and middle school): 538 Students in private schools in grades 9 to 12 (high school): 140 Students in private undergraduate colleges: 333