Newport East, RI (Rhode Island) Houses and Residents
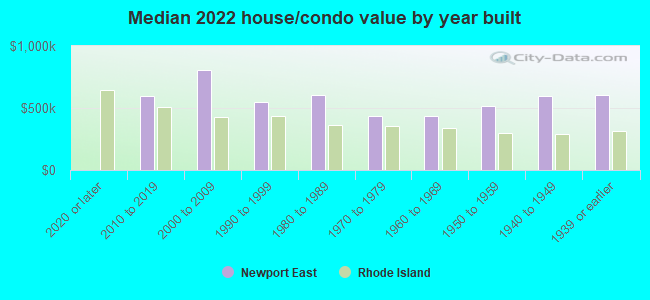
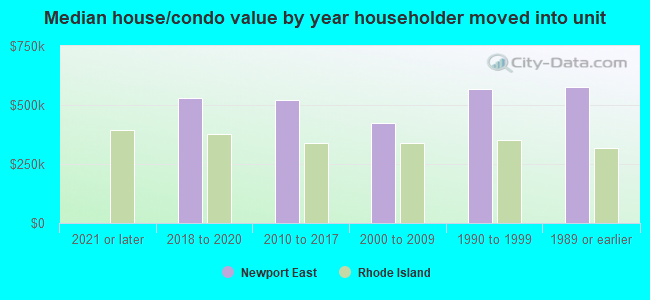
| Newport East: | $544,680 |
| Rhode Island: | $383,900 |
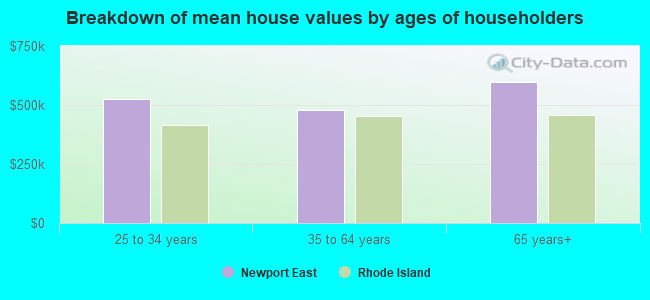
Mean price in 2022:
Detached houses: $527,278
Here: $527,278 State: $445,354 Townhouses or other attached units: $490,542
Here: $490,542 State: $371,092 In 2-unit structures: $779,113
Here: $779,113 State: $317,098 Mobile homes: $158,892
Here: $158,892 State: $105,454
Total population: 11,769 (Urban population: 11,677, Rural population: 0)
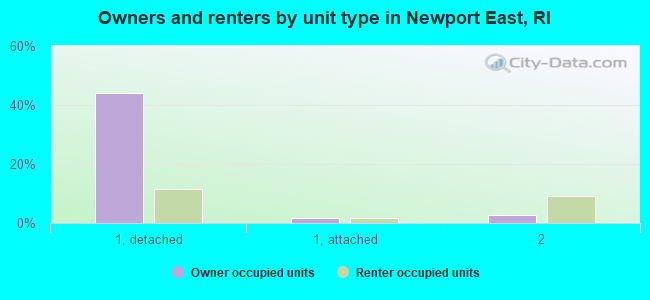
Houses: 5,815 (5,160 occupied: 3,012 owner occupied, 2,315 renter occupied)
| % of renters here: | 43% |
| State: | 37% |
Housing density: 1,024 houses/condos per square mile
Median price asked for vacant for-sale houses and condos in 2022: $184,585.
Median contract rent in 2022: $1,428 (lower quartile is $1,111, upper quartile is $1,821)
Median rent asked for vacant for-rent units in 2022: $1,313
Median gross rent in Newport East, RI in 2022: $1,428
Housing units in Newport East with a mortgage: 2,142 (323 second mortgage, 0 home equity loan, 268 both second mortgage and home equity loan)
Houses without a mortgage: 163
Median household income for houses/condos with a mortgage: $122,017
Median household income for apartments without a mortgage: $72,465
Median monthly housing costs: $1,625
Compare current foreclosures near Newport East, RI:
| Photo | Address | Area | Beds / Baths | Price | Details |
|---|---|---|---|---|---|

|
#1
Hallville Rd
Exeter, RI 02822
|
943 sq. feet
|
1 baths 2 beds |
$69,900
|
show details |

|
#2
Pokross St
Fall River, MA 02724
|
960 sq. feet
|
1 baths 3 beds |
show details | |

|
#3
Walnut Glen Dr
Warwick, RI 02886
|
1,404 sq. feet
|
2 baths 3 beds |
show details | |

|
#4
Bishop St
Fall River, MA 02721
|
2,316 sq. feet
|
2 baths 3 beds |
show details | |

|
#5
Crystal Dr
Warwick, RI 02889
|
888 sq. feet
|
1 baths 3 beds |
show details | |

|
#6
Fulton St Apt 21
Fall River, MA 02720
|
1,020 sq. feet
|
1 baths 2 beds |
show details | |

|
#7
Nichols Rd
Kingston, RI 02881
|
1,152 sq. feet
|
1 baths 3 beds |
show details | |

|
#8
W Bay Dr
Narragansett, RI 02882
|
1,861 sq. feet
|
3 baths 3 beds |
show details | |

|
#9
Bliss St
Fall River, MA 02720
|
1,220 sq. feet
|
2 baths 2 beds |
show details | |

|
#10
Potomac Rd
Portsmouth, RI 02871
|
1,030 sq. feet
|
2 baths 3 beds |
show details |
| Photo | Address | Area | Beds / Baths | Price | Details |
|---|---|---|---|---|---|

|
#11
Wyola Rd
Swansea, MA 02777
|
775 sq. feet
|
1 baths 2 beds |
show details | |

|
#12
Chesworth St
Fall River, MA 02723
|
1,767 sq. feet
|
2 baths 5 beds |
show details | |

|
#13
Cornell Cir
South Dartmouth, MA 02748
|
1,050 sq. feet
|
1 baths 3 beds |
show details | |

|
#14
Glen Ter
Portsmouth, RI 02871
|
1,304 sq. feet
|
1 baths 3 beds |
show details | |

|
#15
Duncan St
Fall River, MA 02721
|
1,326 sq. feet
|
2 baths 3 beds |
show details | |

|
#16
Mayo Dr
Warren, RI 02885
|
1,739 sq. feet
|
1 baths 3 beds |
show details | |

|
#17
Roosevelt Dr
Bristol, RI 02809
|
1,848 sq. feet
|
2 baths 4 beds |
show details | |

|
#18
Stewart St
Fall River, MA 02720
|
1,575 sq. feet
|
2 baths 6 beds |
show details | |

|
#19
Bay St # 2
Fall River, MA 02721
|
2,257 sq. feet
|
2 baths 3 beds |
show details | |

|
#20
New Boston Rd # 1
Fall River, MA 02720
|
4,036 sq. feet
|
2 baths 6 beds |
show details |
| Photo | Address | Area | Beds / Baths | Price | Details |
|---|---|---|---|---|---|

|
#21
Pitman St
Fall River, MA 02723
|
873 sq. feet
|
1 baths 4 beds |
show details | |

|
#22
Archdale Dr
Warwick, RI 02889
|
1,032 sq. feet
|
1 baths 3 beds |
show details | |

|
#23
Quaker Ln Apt 31
West Warwick, RI 02893
|
1,288 sq. feet
|
1 baths 2 beds |
show details | |

|
#24
Quaker Ln Apt 42
West Warwick, RI 02893
|
1,140 sq. feet
|
1 baths 2 beds |
show details | |

|
#25
Rodman St
Fall River, MA 02721
|
1,938 sq. feet
|
1 baths 3 beds |
show details | |

|
#26
Newbury St
Fall River, MA 02720
|
2,333 sq. feet
|
2 baths 4 beds |
show details | |

|
#27
E Greenwich Ave, Bldg 2
West Warwick, RI 02893
|
1,264 sq. feet
|
2 baths 2 beds |
show details | |

|
#28
Archdale Dr
Warwick, RI 02889
|
1,380 sq. feet
|
1 baths 3 beds |
show details | |

|
#29
Stanmore Rd
Warwick, RI 02889
|
720 sq. feet
|
1 baths 2 beds |
show details | |

|
#30
Shore Dr Unit 611
Fall River, MA 02721
|
1,902 sq. feet
|
3 baths 3 beds |
show details |
| Photo | Address | Area | Beds / Baths | Price | Details |
|---|---|---|---|---|---|

|
#31
Center Ave
Middletown, RI 02842
|
2,066 sq. feet
|
1 baths 2 beds |
show details | |

|
#32
S Beach St
Fall River, MA 02724
|
3,148 sq. feet
|
3 baths 8 beds |
show details | |

|
#33
Ridgeway Ave
Warwick, RI 02889
|
1,134 sq. feet
|
1 baths 3 beds |
show details | |

|
#34
Plymouth Ave
Fall River, MA 02721
|
2,726 sq. feet
|
2 baths 2 beds |
show details | |

|
#35
Walnut St
Fall River, MA 02720
|
4,600 sq. feet
|
4 baths 4 beds |
show details | |

|
#36
Juniper Dr
West Warwick, RI 02893
|
1,956 sq. feet
|
1 baths 3 beds |
show details | |

|
#37
Hemlock Ave
Narragansett, RI 02882
|
1,515 sq. feet
|
1 baths 4 beds |
show details | |

|
#38
Stevens St
Fall River, MA 02721
|
2,153 sq. feet
|
2 baths 3 beds |
show details | |

|
#39
Tanner Ave
Warwick, RI 02886
|
1,032 sq. feet
|
1 baths 3 beds |
show details | |

|
#40
Morton St # 1
Fall River, MA 02720
|
2,970 sq. feet
|
2 baths 6 beds |
show details |
| Photo | Address | Area | Beds / Baths | Price | Details |
|---|---|---|---|---|---|

|
#41
S Beach St
Fall River, MA 02724
|
1,941 sq. feet
|
1 baths 4 beds |
show details | |

|
#42
Brown St
Fall River, MA 02724
|
2,092 sq. feet
|
2 baths 4 beds |
show details | |

|
#43
College Ln
North Dartmouth, MA 02747
|
2,016 sq. feet
|
2 baths 4 beds |
show details | |

|
#44
New Hampshire Ave
Barrington, RI 02806
|
1,488 sq. feet
|
2 baths 3 beds |
show details | |

|
#45
Mount Fair Cir
Swansea, MA 02777
|
1,980 sq. feet
|
2 baths 3 beds |
show details | |

|
#46
Morton St # 2
Fall River, MA 02720
|
1,994 sq. feet
|
3 baths 6 beds |
show details | |

|
#47
Cambridge St
Fall River, MA 02721
|
1,172 sq. feet
|
1 baths 3 beds |
show details | |

|
#48
Fatima Dr
Warren, RI 02885
|
1,326 sq. feet
|
1 baths 2 beds |
show details | |

|
#49
E Greenwich Ave
West Warwick, RI 02893
|
1,998 sq. feet
|
2 baths 3 beds |
show details | |

|
Check over 1 million property listings on Foreclosure.com!
|
browse all offers | |||


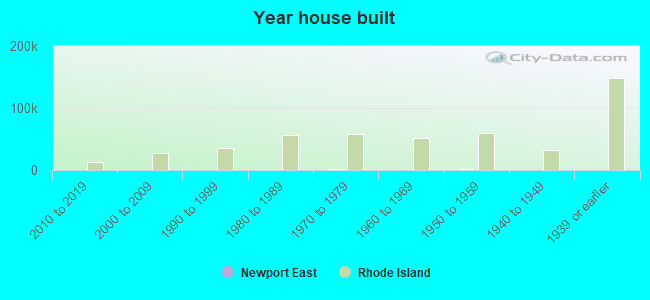
Median year apartment built: 1965
Household type by relationship:
Households: 11,513- Male householders: 2,554 (638 living alone), Female householders: 2,518 (947 living alone)
1,965 spouses (1,952 opposite-sex spouses), 478 unmarried partners, (476 opposite-sex unmarried partners), 3,042 children (2,873 natural, 94 adopted, 74 stepchildren), 105 grandchildren, 27 brothers or sisters, 165 parents, 0 foster children, 37 other relatives, 312 non-relatives
- In group quarters: 304
Size of family households: 1,513 2-persons, 661 3-persons, 545 4-persons, 296 5-persons, 44 6-persons, 15 7-or-more-persons.
Size of nonfamily households: 1,639 1-person, 577 2-persons.
1,285 married couples with children.
566 single-parent households (195 men, 371 women).
86.3% of residents of Newport East speak English at home.
3.9% of residents speak Spanish at home (60% speak English very well, 11% speak English well, 5% speak English not well, 25% don't speak English at all).
7.5% of residents speak other Indo-European language at home (59% speak English very well, 30% speak English well, 9% speak English not well, 2% don't speak English at all).
2.0% of residents speak Asian or Pacific Island language at home (60% speak English very well, 21% speak English well, 18% speak English not well).
0.5% of residents speak other language at home (85% speak English very well, 15% speak English not well).
Foreign born population: 1,519 (13.2%)
(49.3% of them are naturalized citizens)
| Here: | 6.4 |
| State: | 6.2 |
| Here: | 4.5 |
| State: | 4.1 |
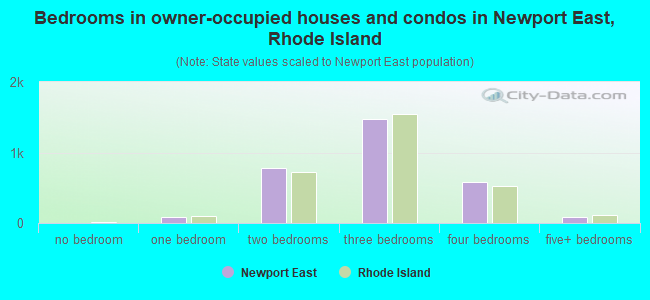
- Bedrooms in owner-occupied houses and condos in Newport East, Rhode Island
- 0no bedroom
- 871 bedroom
- 7742 bedrooms
- 1,4773 bedrooms
- 5884 bedrooms
- 875+ bedrooms
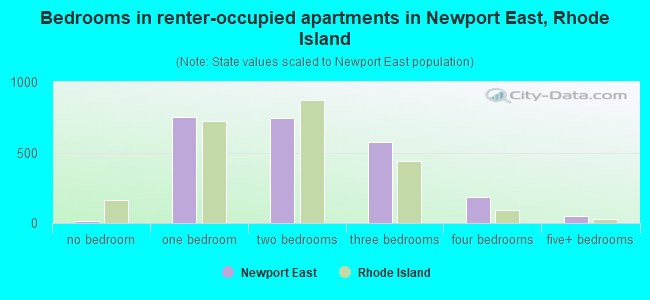
- Bedrooms in renter-occupied apartments in Newport East, Rhode Island
- 15no bedroom
- 7491 bedroom
- 7422 bedrooms
- 5753 bedrooms
- 1844 bedrooms
- 525+ bedrooms
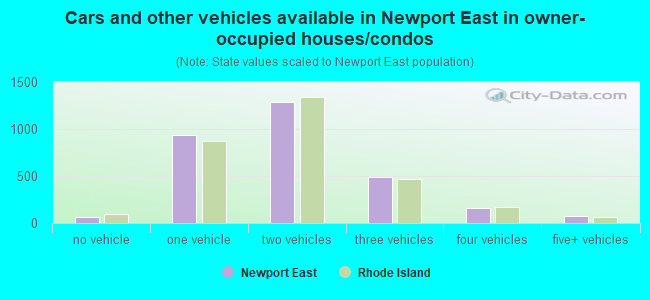
- Cars and other vehicles available in Newport East in owner-occupied houses/condos
- 60no vehicle
- 9361 vehicle
- 1,2892 vehicles
- 4943 vehicles
- 1594 vehicles
- 755+ vehicles
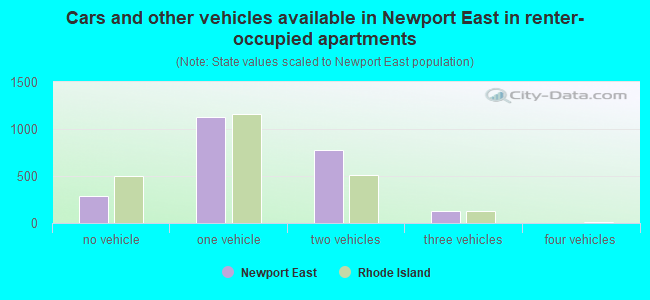
- Cars and other vehicles available in Newport East in renter-occupied apartments
- 285no vehicle
- 1,1271 vehicle
- 7732 vehicles
- 1323 vehicles
- 04 vehicles
- 05+ vehicles
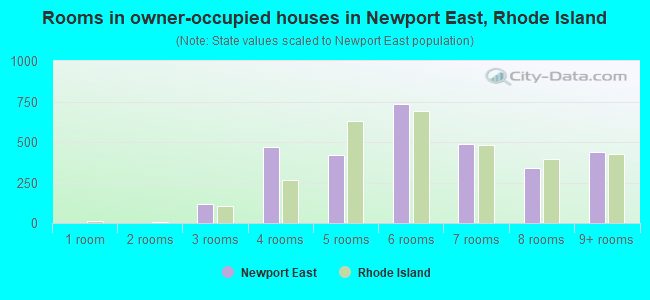
- Rooms in owner-occupied houses in Newport East, Rhode Island
- 01 room
- 02 rooms
- 1173 rooms
- 4704 rooms
- 4225 rooms
- 7366 rooms
- 4887 rooms
- 3408 rooms
- 4399+ rooms
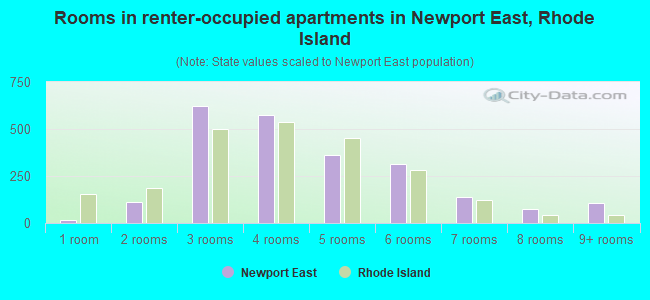
- Rooms in renter-occupied apartments in Newport East, Rhode Island
- 151 room
- 1122 rooms
- 6213 rooms
- 5744 rooms
- 3635 rooms
- 3126 rooms
- 1407 rooms
- 748 rooms
- 1059+ rooms
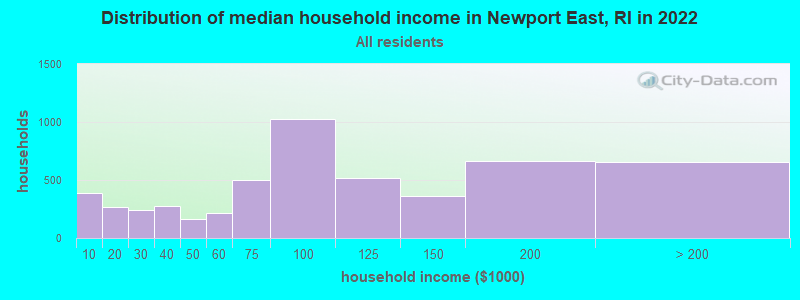
Newport East, RI household income distribution

- 392Less than $10,000
- 271$10,000 to $19,999
- 243$20,000 to $29,999
- 277$30,000 to $39,999
- 164$40,000 to $49,999
- 219$50,000 to $59,999
- 502$60,000 to $74,999
- 1,028$75,000 to $99,999
- 521$100,000 to $124,999
- 363$125,000 to $149,999
- 665$150,000 to $199,999
- 656$200,000 or more
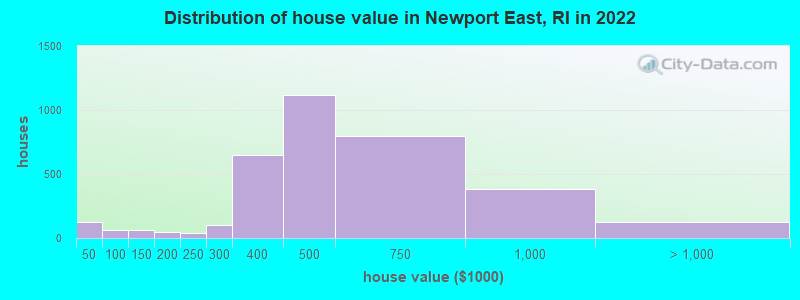
Home value of owner - occupied houses in 2022 in Newport East, RI
-
- 10Less than $10,000
- 3$15,000 to $19,999
- 8$20,000 to $24,999
- 22$25,000 to $29,999
- 13$30,000 to $34,999
- 17$35,000 to $39,999
- 47$40,000 to $49,999
- 19$70,000 to $79,999
- 56$100,000 to $124,999
- 8$125,000 to $149,999
- 43$175,000 to $199,999
- 39$200,000 to $249,999
- 99$250,000 to $299,999
- 648$300,000 to $399,999
- 1,119$400,000 to $499,999
- 796$500,000 to $749,999
- 378$750,000 to $999,999
- 67$1,000,000 to $1,499,999
- 60$2,000,000 or more
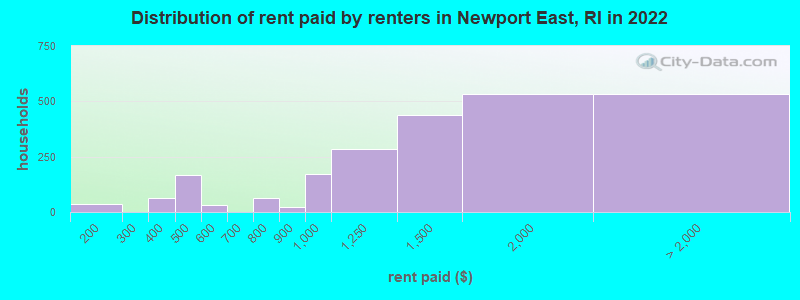
Rent paid by renters in 2022 in Newport East, RI
-
- 37$100 to $149
- 13$300 to $349
- 51$350 to $399
- 22$400 to $449
- 144$450 to $499
- 32$550 to $599
- 61$700 to $749
- 22$800 to $899
- 170$900 to $999
- 286$1,000 to $1,249
- 435$1,250 to $1,499
- 531$1,500 to $1,999
- 101$2,000 to $2,499
- 87$2,500 to $2,999
- 191$3,000 to $3,499
- 11$3,500 or more
- 140No cash rent
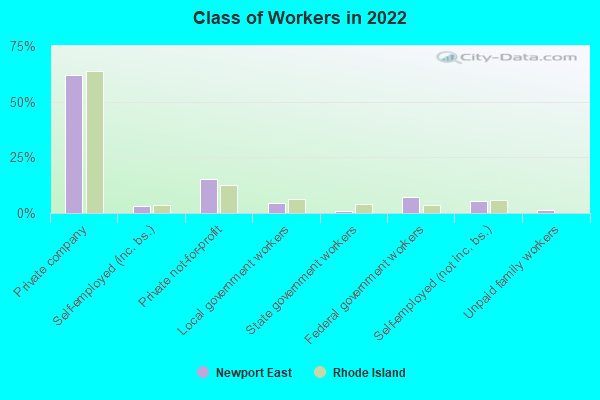
Percentage of workers working in this county: 87.5%
Number of people working at home: 662 (10.8% of all workers)

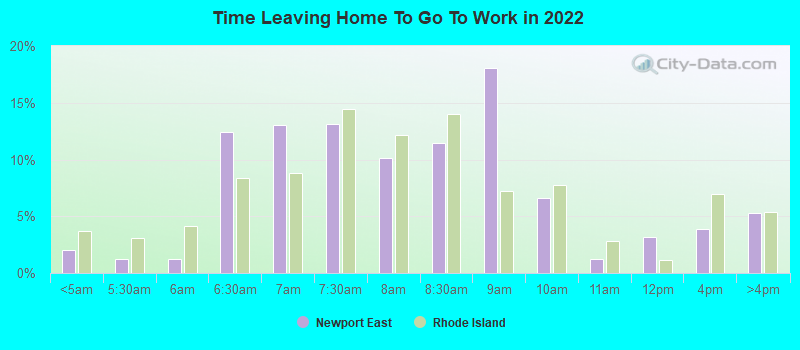
Travel time to work (commute)
- Less than 5 minutes: 292
- 5 to 9 minutes: 761
- 10 to 14 minutes: 1,556
- 15 to 19 minutes: 872
- 20 to 24 minutes: 498
- 25 to 29 minutes: 67
- 30 to 34 minutes: 354
- 35 to 39 minutes: 51
- 40 to 44 minutes: 132
- 45 to 59 minutes: 314
- 60 to 89 minutes: 98
- 90 or more minutes: 138
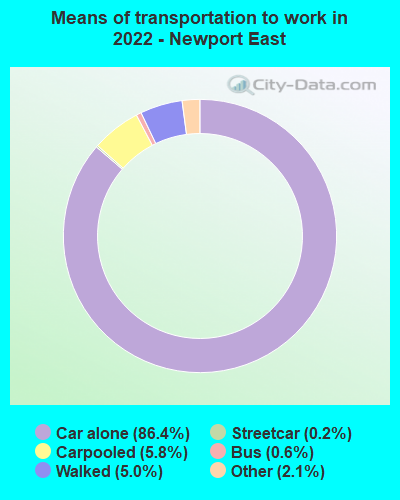
Means of transportation to work:
- Drove a car alone: 7,147 (77.7%)
- Carpooled: 513 (5.6%)
- Bus: 32 (0.3%)
- Subway or elevated rail: 15 (0.2%)
- Taxi: 244 (2.7%)
- Walked: 424 (4.6%)
- Worked at home: 662 (7.2%)
- Unemployment by race in 2022
- Unemployment rate for White non-Hispanic residents
- 5.0%Males
- 4.8%Females
- Unemployment rate for two or more race residents
- 17.2%Males
- 8.7%Females
- Unemployment rate for Hispanic or Latino residents
- 16.3%Males
- 6.9%Females
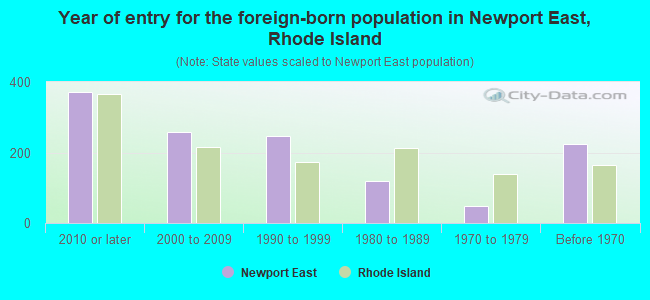
- Year of entry for the foreign-born population in Newport East, Rhode Island
- 3712010 or later
- 2572000 to 2009
- 2471990 to 1999
- 1201980 to 1989
- 491970 to 1979
- 224Before 1970
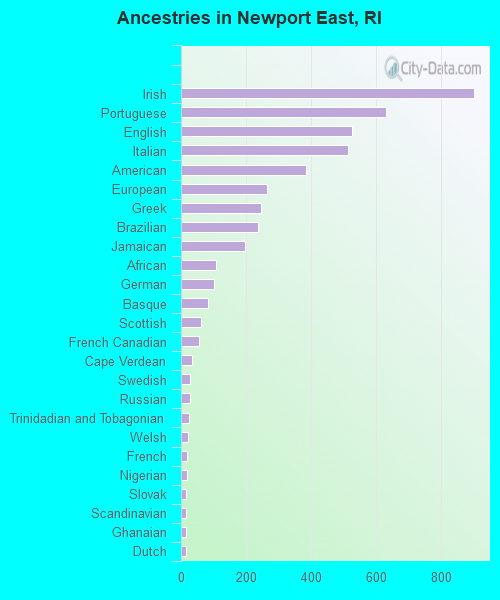
First ancestries reported:
- Irish: 902 (15.6%)
- Portuguese: 631 (10.9%)
- English: 526 (9.1%)
- Italian: 513 (8.9%)
- American: 385 (6.7%)
- European: 263 (4.5%)
- Greek: 245 (4.2%)
- Brazilian: 238 (4.1%)
- Jamaican: 198 (3.4%)
- African: 107 (1.8%)
- German: 101 (1.7%)
- Basque: 83 (1.4%)
- Scottish: 62 (1.1%)
- French Canadian: 56 (1.0%)
- Cape Verdean: 34 (0.6%)
- Swedish: 29 (0.5%)
- Russian: 29 (0.5%)
- Trinidadian and Tobagonian: 26 (0.4%)
- Welsh: 23 (0.4%)
- French: 17 (0.3%)
- Nigerian: 17 (0.3%)
- Slovak: 16 (0.3%)
- Scandinavian: 15 (0.3%)
- Ghanaian: 15 (0.3%)
- Dutch: 14 (0.2%)
- Hungarian: 13 (0.2%)
- Lebanese: 11 (0.2%)
- Czech: 10 (0.2%)
- British West Indian: 10 (0.2%)
- Scotch-Irish: 9 (0.2%)
- Barbadian: 8 (0.1%)
- Polish: 7 (0.1%)
- Eastern European: 5 (0.09%)
Most common places of birth for foreign-born residents (%):
| Newport East: | 36.0% (434) |
| Rhode Island: | 1.8% (2,826) |
| Newport East: | 13.4% (162) |
| Rhode Island: | 10.4% (16,385) |
| Newport East: | 12.6% (152) |
| Rhode Island: | 10.0% (15,766) |
| Newport East: | 5.8% (70) |
| Rhode Island: | 0.5% (714) |
| Newport East: | 5.2% (63) |
| Rhode Island: | 0.4% (603) |
| Newport East: | 4.5% (54) |
| Rhode Island: | 1.7% (2,625) |
| Newport East: | 3.4% (41) |
| Rhode Island: | 0.4% (637) |
| Newport East: | 2.7% (33) |
| Rhode Island: | 0.3% (399) |
| Newport East: | 2.1% (25) |
| Rhode Island: | 0.4% (554) |
| Newport East: | 1.8% (22) |
| Rhode Island: | 0.5% (848) |
Place of birth for U.S.-born residents:
- This state: 5,840
- Other state: 3,946
- Northeast: 2,634
- Midwest: 291
- South: 669
- West: 287
91.3% of Newport East residents lived in the same house 1 years ago.
Out of people who lived in different houses, 26.9% lived in this county.
Out of people who lived in different counties, 9.5% lived in Rhode Island.
| Newport East: | 91.3% |
| State average: | 89.3% |
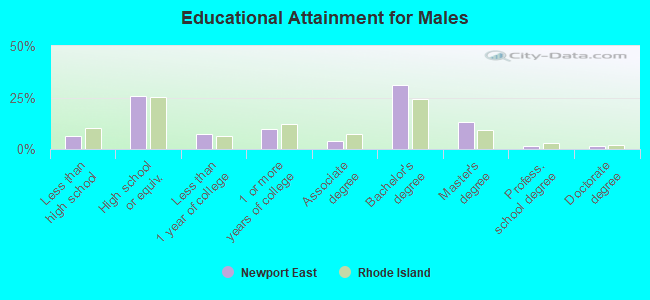
Education attainment for males 25 years and older:
- No schooling: 152
- Nursery to 4th grade: 22
- 5th and 6th grade: 0
- 7th and 8th grade: 17
- 9th grade: 17
- 10th grade: 11
- 11th grade: 22
- 12th grade, no diploma: 20
- High school graduate (or equivalency): 1,060
- Less than 1 year of college: 301
- Some college more than 1 year, no degree: 410
- Associate degree: 165
- Bachelor's degree: 1,287
- Master's degree: 547
- Professional school degree: 58
- Doctorate degree: 62
Education attainment for females 25 years and older:
- No schooling: 148
- Nursery to 4th grade: 31
- 5th and 6th grade: 0
- 7th and 8th grade: 13
- 9th grade: 1
- 10th grade: 11
- 11th grade: 27
- 12th grade, no diploma: 21
- High school graduate (or equivalency): 1,335
- Less than 1 year of college: 386
- Some college more than 1 year, no degree: 372
- Associate degree: 349
- Bachelor's degree: 1,146
- Master's degree: 612
- Professional school degree: 239
- Doctorate degree: 175


Housing units in structures:
- One, detached: 3,103
- One, attached: 394
- Two: 617
- 3 or 4: 498
- 5 to 9: 73
- 10 to 19: 309
- 20 to 49: 243
- 50 or more: 283
- Mobile homes: 280
- Boats, RVs, vans, etc.: 10
Median worth of mobile homes: $100,400
Housing units lacking complete kitchen facilities in 2022: 0.3%
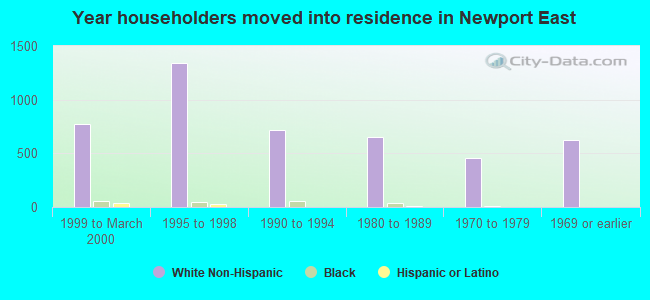
House/condo owner moved in on average 16 years ago
Renter moved in on average 3 years ago
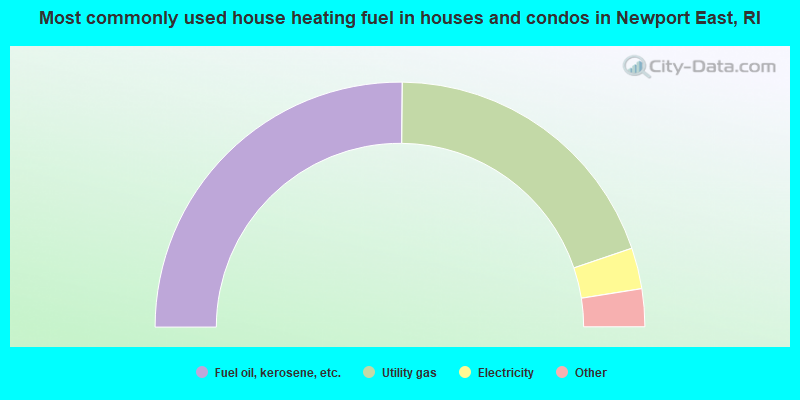
- 50.3%Fuel oil, kerosene, etc.
- 39.3%Utility gas
- 5.4%Electricity
- 3.9%Bottled, tank, or LP gas
- 0.7%Other fuel
- 0.3%Wood
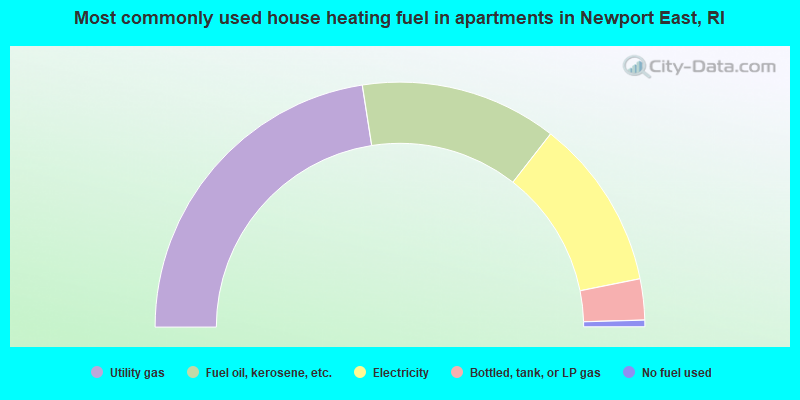
- 45.1%Utility gas
- 26.0%Fuel oil, kerosene, etc.
- 22.6%Electricity
- 5.4%Bottled, tank, or LP gas
- 0.9%No fuel used
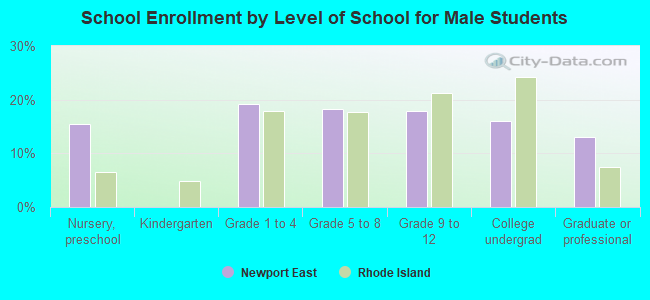
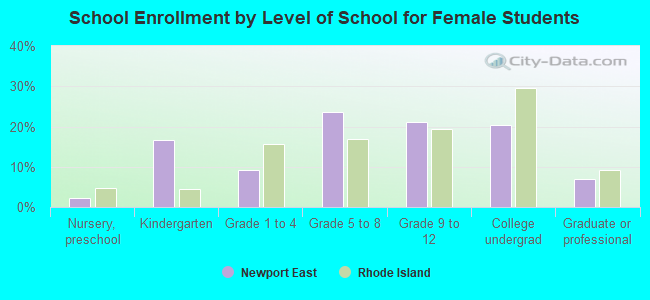
Private vs. public school enrollment:
| Here: | 16.0% |
| Rhode Island: | 12.2% |
| Here: | 12.9% |
| Rhode Island: | 11.6% |
| Here: | 2.5% |
| Rhode Island: | 41.1% |