New Brunswick, NJ (New Jersey) Houses and Residents
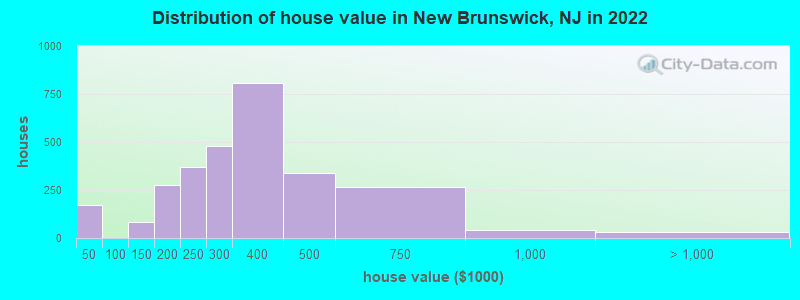
Estimated median house or condo value in 2022: $309,570 (it was $125,700 in 2000 )
New Brunswick:
$309,570New Jersey:
$428,900
Lower value quartile - upper value quartile: $237,725 - $407,355Mean price in 2022: Detached houses: $334,157 Here:
$334,157State:
$537,591
Townhouses or other attached units: $263,821 Here:
$263,821State:
$381,113
In 2-unit structures: $226,514 Here:
$226,514State:
$444,476
In 3-to-4-unit structures: $328,534 Here:
$328,534State:
$457,463
In 5-or-more-unit structures: $272,015 Here:
$272,015State:
$368,745
Total population: 57,080 (Urban population: 48,573, Rural population: 0)
Houses: 17,022 (15,751 occupied: 3,208 owner occupied, 12,675 renter occupied )
% of renters here:
80%State:
35%
Housing density: 3,257 houses/condos per square mile
Median price asked for vacant for-sale houses and condos in 2022: $238,054.
Median contract rent in 2022: $1,500 (lower quartile is $1,082, upper quartile is $1,902)
Median rent asked for vacant for-rent units in 2022: $2,567
Median gross rent in New Brunswick, NJ in 2022: $1,683
Housing units in New Brunswick with a mortgage: 2,025 (105 second mortgage, 23 home equity loan, 52 both second mortgage and home equity loan )Houses without a mortgage: 28
Median household income for houses/condos with a mortgage: $109,034
Median household income for apartments without a mortgage: $60,543
Median monthly housing costs: $1,665
Data:
Median house or condo value ($)
Median house or condo value ($ change since 2000)
Median house or condo value ($) - White
Median house or condo value ($) - Black or African American
Median house or condo value ($) - Asian
Median house or condo value ($) - Hispanic or Latino
Median house or condo value ($) - American Indian and Alaska Native
Median house or condo value ($) - Multirace
Median house or condo value ($) - Other Race
Median price asked for mobile homes ($)
Household density (households per square mile)
Mean house or condo value by units in structure - 1, detached ($)
Mean house or condo value by units in structure - 1, attached ($)
Mean house or condo value by units in structure - 2 ($)
Mean house or condo value by units in structure by units in structure - 3 or 4 ($)
Mean house or condo value by units in structure - 5 or more ($)
Mean house or condo value by units in structure - Boat, RV, van, etc. ($)
Mean house or condo value by units in structure - Mobile home ($)
Median contract rent ($)
Median contract rent - Lower quartile ($)
Median contract rent - Upper quartile ($)
Median gross rent ($)
Urban houses (%)
Rural houses (%)
Houses occupied (%)
Houses occupied (% change since 2000)
Houses owner occupied (%)
Houses owner occupied (% change since 2000)
Houses renter occupied (%)
Houses renter occupied (% change since 2000)
Vacant housing units - For rent (%)
Vacant housing units - For rent (% change since 2000)
Vacant housing units - For sale only (%)
Vacant housing units - For sale only (% change since 2000)
Vacant housing units - Rented or sold, not occupied (%)
Vacant housing units - Rented or sold, not occupied (% change since 2000)
Vacant housing units - For seasonal, recreational, or occasional use (%)
Vacant housing units - For seasonal, recreational, or occasional use (% change since 2000)
Vacant housing units - For migrant workers (%)
Vacant housing units - For migrant workers (% change since 2000)
Vacant housing units - Other vacant (%)
Vacant housing units - Other vacant (% change since 2000)
Median monthly housing costs ($)
Median household income for houses/condos with a mortgage ($)
Median household income for houses/condos without a mortgage ($)
Median household income ($)
Median household income ($) - White
Median household income ($) - Black or African American
Median household income ($) - Asian
Median household income ($) - Hispanic or Latino
Median household income ($) - American Indian and Alaska Native
Median household income ($) - Multirace
Median household income ($) - Other Race
Mortgage status - with mortgage (%)
Mortgage status - with second mortgage (%)
Mortgage status - with home equity loan (%)
Mortgage status - with both second mortgage and home equity loan (%)
Mortgage status - without a mortgage (%)
Median year house/condo built
Median year apartment built
Household type by relationship - Male householder living alone (%)
Household type by relationship - Male householder not living alone (%)
Household type by relationship - Female householder living alone (%)
Household type by relationship - Female householder not living alone (%)
Household type by relationship - Opposite-Sex spouse (%)
Household type by relationship - Same-Sex spouse (%)
Household type by relationship - Opposite-Sex unmarried partner (%)
Household type by relationship - Same-Sex unmarried partner (%)
Household type by relationship - In group quarters (%)
Size of family households - 2-person household (%)
Size of family households - 3-person household (%)
Size of family households - 4-person household (%)
Size of family households - 5-person household (%)
Size of family households - 6-person household (%)
Size of family households - 7-or-more-person household (%)
Size of nonfamily households - 1-person household (%)
Size of nonfamily households - 2-person household (%)
Size of nonfamily households - 3-person household (%)
Size of nonfamily households - 4-person household (%)
Size of nonfamily households - 5-person household (%)
Size of nonfamily households - 6-person household (%)
Size of nonfamily households - 7-or-moreperson household (%)
Year house built - Built 2010 or later (%)
Year house built - Built 2000 to 2009 (%)
Year house built - Built 1990 to 1999 (%)
Year house built - Built 1980 to 1989 (%)
Year house built - Built 1970 to 1979 (%)
Year house built - Built 1960 to 1969 (%)
Year house built - Built 1950 to 1959 (%)
Year house built - Built 1940 to 1949 (%)
Year house built - Built 1939 or earlier (%)
Median number of rooms in houses and condos
Median number of rooms in apartments
Median number of bedrooms in owner occupied houses
Mean number of bedrooms in owner occupied houses
Median number of bedrooms in renter occupied houses
Mean number of bedrooms in renter occupied houses
Median number of vehichles in owner occupied houses
Mean number of vehichles in owner occupied houses
Median number of vehichles in renter occupied houses
Mean number of vehichles in renter occupied houses
Rooms in owner-occupied houses - 1 room (%)
Rooms in owner-occupied houses - 2 rooms (%)
Rooms in owner-occupied houses - 3 rooms (%)
Rooms in owner-occupied houses - 4 rooms (%)
Rooms in owner-occupied houses - 5 rooms (%)
Rooms in owner-occupied houses - 6 rooms (%)
Rooms in owner-occupied houses - 7 rooms (%)
Rooms in owner-occupied houses - 8 rooms (%)
Rooms in owner-occupied houses - 9+ rooms (%)
Rooms in renter-occupied houses - 1 room (%)
Rooms in renter-occupied houses - 2 rooms (%)
Rooms in renter-occupied houses - 3 rooms (%)
Rooms in renter-occupied houses - 4 rooms (%)
Rooms in renter-occupied houses - 5 rooms (%)
Rooms in renter-occupied houses - 6 rooms (%)
Rooms in renter-occupied houses - 7 rooms (%)
Rooms in renter-occupied houses - 8 rooms (%)
Rooms in renter-occupied houses - 9+ rooms (%)
Bedrooms in owner-occupied houses - no bedrooms (%)
Bedrooms in owner-occupied houses - 1 bedroom (%)
Bedrooms in owner-occupied houses - 2 bedrooms (%)
Bedrooms in owner-occupied houses - 3 bedrooms (%)
Bedrooms in owner-occupied houses - 4 bedrooms (%)
Bedrooms in owner-occupied houses - 5+ bedrooms (%)
Bedrooms in renter-occupied houses - no bedrooms (%)
Bedrooms in renter-occupied houses - 1 bedroom (%)
Bedrooms in renter-occupied houses - 2 bedrooms (%)
Bedrooms in renter-occupied houses - 3 bedrooms (%)
Bedrooms in renter-occupied houses - 4 bedrooms (%)
Bedrooms in renter-occupied houses - 5+ bedrooms (%)
Vehicles available in owner-occupied houses - no vehicle available (%)
Vehicles available in owner-occupied houses - 1 vehicle available(%)
Vehicles available in owner-occupied houses - 2 Vehicles available (%)
Vehicles available in owner-occupied houses - 3 Vehicles available (%)
Vehicles available in owner-occupied houses - 4 Vehicles available (%)
Vehicles available in owner-occupied houses - 5+ Vehicles available (%)
Vehicles available in renter-occupied houses - no vehicle available (%)
Vehicles available in renter-occupied houses - 1 vehicle available (%)
Vehicles available in renter-occupied houses - 2 Vehicles available (%)
Vehicles available in renter-occupied houses - 3 Vehicles available (%)
Vehicles available in renter-occupied houses - 4 Vehicles available (%)
Vehicles available in renter-occupied houses - 5+ Vehicles available (%)
Housing units in structures - 1, detached (%)
Housing units in structures - 1, attached (%)
Housing units in structures - 2 (%)
Housing units in structures - 3 or 4 (%)
Housing units in structures - 5 to 9 (%)
Housing units in structures - 10 to 19 (%)
Housing units in structures - 20 to 49 (%)
Housing units in structures - 50 or more (%)
Housing units in structures - Mobile home (%)
Housing units in structures - Boat, RV, van, etc. (%)
Housing units in structures - Owners - 1, detached (%)
Housing units in structures - Owners - 1, attached (%)
Housing units in structures - Owners - 2 (%)
Housing units in structures - Owners - 3 or 4 (%)
Housing units in structures - Owners - 5 to 9 (%)
Housing units in structures - Owners - 10 to 19 (%)
Housing units in structures - Owners - 20 to 49 (%)
Housing units in structures - Owners - 50 or more (%)
Housing units in structures - Owners - Mobile home (%)
Housing units in structures - Owners - Boat, RV, van, etc. (%)
Housing units in structures - Renters - 1, detached (%)
Housing units in structures - Renters - 1, attached (%)
Housing units in structures - Renters - 2 (%)
Housing units in structures - Renters - 3 or 4 (%)
Housing units in structures - Renters - 5 to 9 (%)
Housing units in structures - Renters - 10 to 19 (%)
Housing units in structures - Renters - 20 to 49 (%)
Housing units in structures - Renters - 50 or more (%)
Housing units in structures - Renters - Mobile home (%)
Housing units in structures - Renters - Boat, RV, van, etc. (%)
House/condo owner moved in on average (years ago)
Renter moved in on average (years ago)
Year householder moved into unit - Moved in 1999 to March 2000 (%)
Year householder moved into unit - Moved in 1999 to March 2000 (%) - White
Year householder moved into unit - Moved in 1999 to March 2000 (%) - Black or African American
Year householder moved into unit - Moved in 1999 to March 2000 (%) - Asian
Year householder moved into unit - Moved in 1999 to March 2000 (%) - Hispanic or Latino
Year householder moved into unit - Moved in 1999 to March 2000 (%) - American Indian and Alaska Native
Year householder moved into unit - Moved in 1999 to March 2000 (%) - Multirace
Year householder moved into unit - Moved in 1999 to March 2000 (%) - Other Race
Year householder moved into unit - Moved in 1995 to 1998 (%)
Year householder moved into unit - Moved in 1995 to 1998 (%) - White
Year householder moved into unit - Moved in 1995 to 1998 (%) - Black or African American
Year householder moved into unit - Moved in 1995 to 1998 (%) - Asian
Year householder moved into unit - Moved in 1995 to 1998 (%) - Hispanic or Latino
Year householder moved into unit - Moved in 1995 to 1998 (%) - American Indian and Alaska Native
Year householder moved into unit - Moved in 1995 to 1998 (%) - Multirace
Year householder moved into unit - Moved in 1995 to 1998 (%) - Other Race
Year householder moved into unit - Moved in 1990 to 1994 (%)
Year householder moved into unit - Moved in 1990 to 1994 (%) - White
Year householder moved into unit - Moved in 1990 to 1994 (%) - Black or African American
Year householder moved into unit - Moved in 1990 to 1994 (%) - Asian
Year householder moved into unit - Moved in 1990 to 1994 (%) - Hispanic or Latino
Year householder moved into unit - Moved in 1990 to 1994 (%) - American Indian and Alaska Native
Year householder moved into unit - Moved in 1990 to 1994 (%) - Multirace
Year householder moved into unit - Moved in 1990 to 1994 (%) - Other Race
Year householder moved into unit - Moved in 1980 to 1989 (%)
Year householder moved into unit - Moved in 1980 to 1989 (%) - White
Year householder moved into unit - Moved in 1980 to 1989 (%) - Black or African American
Year householder moved into unit - Moved in 1980 to 1989 (%) - Asian
Year householder moved into unit - Moved in 1980 to 1989 (%) - Hispanic or Latino
Year householder moved into unit - Moved in 1980 to 1989 (%) - American Indian and Alaska Native
Year householder moved into unit - Moved in 1980 to 1989 (%) - Multirace
Year householder moved into unit - Moved in 1980 to 1989 (%) - Other Race
Year householder moved into unit - Moved in 1970 to 1979 (%)
Year householder moved into unit - Moved in 1970 to 1979 (%) - White
Year householder moved into unit - Moved in 1970 to 1979 (%) - Black or African American
Year householder moved into unit - Moved in 1970 to 1979 (%) - Asian
Year householder moved into unit - Moved in 1970 to 1979 (%) - Hispanic or Latino
Year householder moved into unit - Moved in 1970 to 1979 (%) - American Indian and Alaska Native
Year householder moved into unit - Moved in 1970 to 1979 (%) - Multirace
Year householder moved into unit - Moved in 1970 to 1979 (%) - Other Race
Year householder moved into unit - Moved in 1969 or earlier (%)
Year householder moved into unit - Moved in 1969 or earlier (%) - White
Year householder moved into unit - Moved in 1969 or earlier (%) - Black or African American
Year householder moved into unit - Moved in 1969 or earlier (%) - Asian
Year householder moved into unit - Moved in 1969 or earlier (%) - Hispanic or Latino
Year householder moved into unit - Moved in 1969 or earlier (%) - American Indian and Alaska Native
Year householder moved into unit - Moved in 1969 or earlier (%) - Multirace
Year householder moved into unit - Moved in 1969 or earlier (%) - Other Race
Housing units lacking complete plumbing facilities (%)
Housing units lacking complete kitchen facilities (%)
House heating fuel used in houses and condos - Utility gas (%)
House heating fuel used in houses and condos - Bottled, tank, or LP gas (%)
House heating fuel used in houses and condos - Electricity (%)
House heating fuel used in houses and condos - Fuel oil, kerosene, etc. (%)
House heating fuel used in houses and condos - Coal or coke (%)
House heating fuel used in houses and condos - Wood (%)
House heating fuel used in houses and condos - Solar energy (%)
House heating fuel used in houses and condos - Other fuel (%)
House heating fuel used in houses and condos - No fuel used (%)
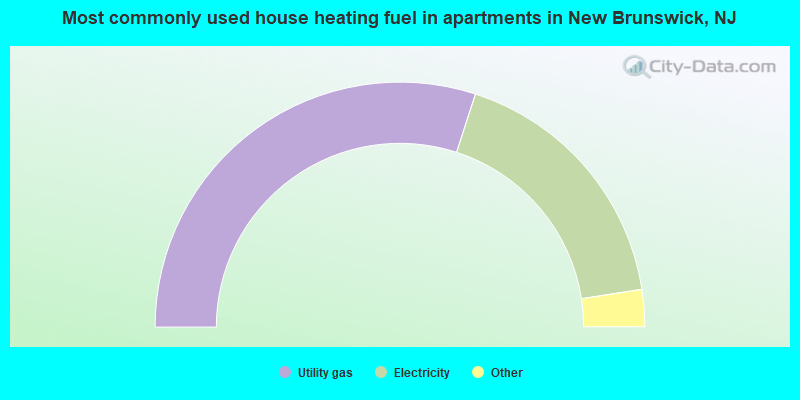
House heating fuel used in apartments - Utility gas (%)
House heating fuel used in apartments - Bottled, tank, or LP gas (%)
House heating fuel used in apartments - Electricity (%)
House heating fuel used in apartments - Fuel oil, kerosene, etc. (%)
House heating fuel used in apartments - Coal or coke (%)
House heating fuel used in apartments - Wood (%)
House heating fuel used in apartments - Solar energy (%)
House heating fuel used in apartments - Other fuel (%)
House heating fuel used in apartments - No fuel used (%)
Median year house/condo built: 1956Median year apartment built: 1975Household type by relationship:
Households: 55,800
Male householders: 7,493 (2,021 living alone ), Female householders: 8,156 (2,136 living alone )4,377 spouses (4,307 opposite-sex spouses ), 2,313 unmarried partners , (2,225 opposite-sex unmarried partners ), 14,642 children (13,937 natural , 240 adopted , 464 stepchildren ), 1,470 grandchildren , 623 brothers or sisters , 611 parents , 0 foster children , 1,390 other relatives , 6,100 non-relatives In group quarters: 8,621
Size of family households: 2,381 2-persons , 2,023 3-persons , 1,893 4-persons , 1,136 5-persons , 885 6-persons , 426 7-or-more-persons .
Size of nonfamily households: 4,228 1-person , 2,155 2-persons , 395 3-persons , 207 4-persons , 86 5-persons , 80 6-persons , 197 7-or-more-persons .
4,240 married couples with children. single-parent households (892 men , 4,380 women ).
45.4% of residents of New Brunswick speak English at home. of residents speak Spanish at home (45% speak English very well , 16% speak English well , 17% speak English not well , 23% don't speak English at all ).of residents speak other Indo-European language at home (74% speak English very well , 18% speak English well , 5% speak English not well , 2% don't speak English at all ).of residents speak Asian or Pacific Island language at home (70% speak English very well , 24% speak English well , 6% speak English not well ).of residents speak other language at home (67% speak English very well , 4% speak English well , 17% speak English not well , 13% don't speak English at all ).
Foreign born population: 19,656 (35.2%)of them are naturalized citizens )
Median number of rooms in houses and condos:
Median number of rooms in apartments
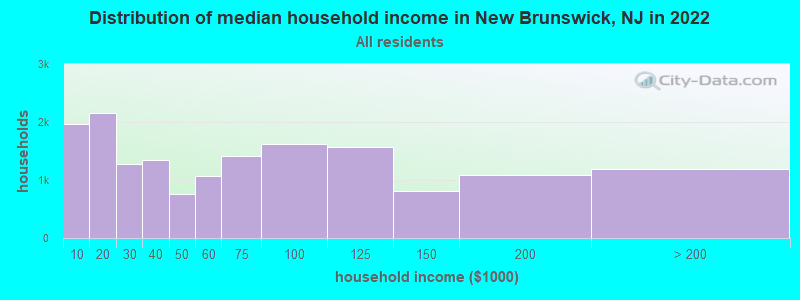
New Brunswick, NJ household income distribution 1,960 Less than $10,0002,155 $10,000 to $19,9991,273 $20,000 to $29,9991,350 $30,000 to $39,999758 $40,000 to $49,9991,062 $50,000 to $59,9991,414 $60,000 to $74,9991,613 $75,000 to $99,9991,563 $100,000 to $124,999816 $125,000 to $149,9991,079 $150,000 to $199,9991,188 $200,000 or more
Home value of owner - occupied houses in 2022 in New Brunswick, NJ 114 Less than $10,00040 $20,000 to $24,99917 $25,000 to $29,9997 $100,000 to $124,99977 $125,000 to $149,999180 $150,000 to $174,99997 $175,000 to $199,999371 $200,000 to $249,999480 $250,000 to $299,999808 $300,000 to $399,999339 $400,000 to $499,999266 $500,000 to $749,99942 $750,000 to $999,99926 $1,000,000 to $1,499,9993 $2,000,000 or moreRent paid by renters in 2022 in New Brunswick, NJ 43 Less than $10095 $100 to $149123 $150 to $199192 $200 to $24945 $250 to $299362 $300 to $349118 $350 to $39943 $400 to $449194 $450 to $49912 $500 to $549321 $550 to $599135 $600 to $64910 $650 to $699391 $700 to $749140 $750 to $799122 $800 to $899583 $900 to $9991,603 $1,000 to $1,2491,955 $1,250 to $1,4993,732 $1,500 to $1,9991,028 $2,000 to $2,499423 $2,500 to $2,999232 $3,000 to $3,499968 $3,500 or more291 No cash rent
Percentage of workers working in this county: 78.3%Number of people working at home: 2,802 (11.2% of all workers )
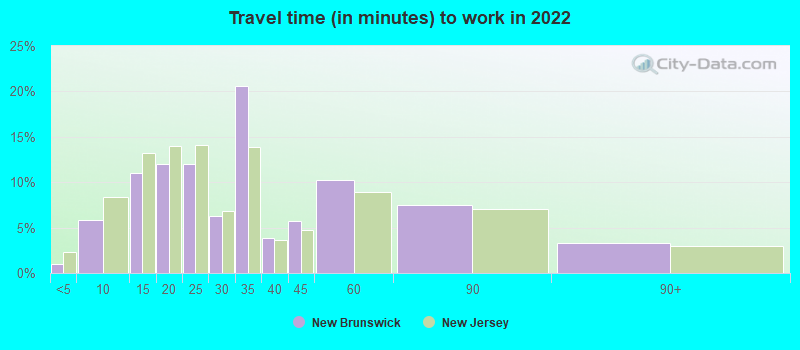
Travel time to work (commute)
Less than 5 minutes: 4785 to 9 minutes: 2,44810 to 14 minutes: 3,66215 to 19 minutes: 3,08120 to 24 minutes: 2,81325 to 29 minutes: 1,27330 to 34 minutes: 4,46335 to 39 minutes: 88740 to 44 minutes: 64845 to 59 minutes: 1,16560 to 89 minutes: 1,07990 or more minutes: 523
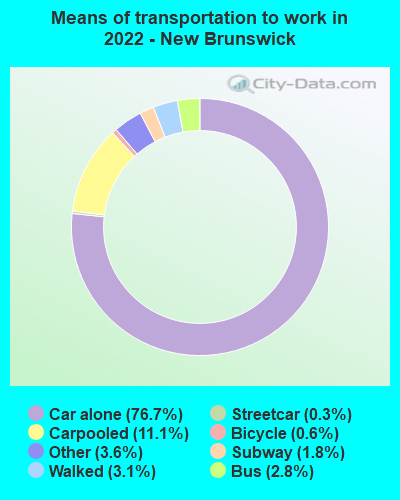
Means of transportation to work:
Drove a car alone: 28,505 (67.5%)Carpooled: 4,862 (11.5%)Bus : 459 (1.1%)Subway or elevated rail : 148 (0.4%)Long-distance train or commuter rail : 569 (1.3%)Light rail, streetcar or trolley : 12 (0.0%)Taxi: 1,814 (4.3%)Bicycle: 256 (0.6%)Walked: 1,694 (4.0%)Worked at home: 2,802 (6.6%)
Unemployment by race in 2022
Unemployment rate for White non-Hispanic residents 2.6% Males1.5% FemalesUnemployment rate for Black residents 20.9% Males16.9% FemalesUnemployment rate for American Indian and Alaska Native residents 6.1% FemalesUnemployment rate for Asian residents 7.1% Males1.4% FemalesUnemployment rate for other race residents 7.4% Males4.9% FemalesUnemployment rate for two or more race residents 2.0% Males6.1% FemalesUnemployment rate for Hispanic or Latino residents 4.5% Males6.0% Females
Year of entry for the foreign-born population in New Brunswick, New Jersey
6,976 2010 or later 6,760 2000 to 2009 3,542 1990 to 1999 3,944 1980 to 1989 804 1970 to 1979 486 Before 1970
First ancestries reported:
American: 1,803 (5.8%)
Italian: 509 (1.6%)
Lebanese: 242 (0.8%)
Hungarian: 232 (0.7%)
Irish: 229 (0.7%)
U.S. Virgin Islander: 214 (0.7%)
Polish: 198 (0.6%)
Jamaican: 176 (0.6%)
English: 167 (0.5%)
Russian: 152 (0.5%)
Palestinian: 141 (0.5%)
African: 140 (0.5%)
German: 128 (0.4%)
Ghanaian: 115 (0.4%)
Brazilian: 92 (0.3%)
Trinidadian and Tobagonian: 92 (0.3%)
Portuguese: 83 (0.3%)
Ukrainian: 65 (0.2%)
Egyptian: 62 (0.2%)
European: 61 (0.2%)
Guyanese: 56 (0.2%)
Iranian: 47 (0.2%)
Barbadian: 43 (0.1%)
Romanian: 36 (0.1%)
Austrian: 28 (0.09%)
Greek: 28 (0.09%)
Haitian: 25 (0.08%)
Danish: 24 (0.08%)
Carpatho Rusyn: 22 (0.07%)
Dutch: 22 (0.07%)
Swedish: 22 (0.07%)
British West Indian: 19 (0.06%)
Albanian: 18 (0.06%)
Czechoslovakian: 17 (0.05%)
Israeli: 16 (0.05%)
Turkish: 16 (0.05%)
French Canadian: 14 (0.05%)
Arab: 11 (0.04%)
French: 10 (0.03%)
Scottish: 10 (0.03%)
Nigerian: 9 (0.03%)
West Indian: 9 (0.03%)
Eastern European: 7 (0.02%)
Kenyan: 6 (0.02%)
Lithuanian: 5 (0.02%)
Syrian: 3 (0.01%)
Most common places of birth for foreign-born residents (%): Mexico New Brunswick:
33.3% (6,364)New Jersey:
4.8% (102,527)
Dominican Republic New Brunswick:
24.5% (4,680)New Jersey:
9.7% (209,055)
Honduras New Brunswick:
7.1% (1,365)New Jersey:
1.7% (37,335)
China, excluding Hong Kong and Taiwan New Brunswick:
5.3% (1,020)New Jersey:
3.7% (78,969)
Canada New Brunswick:
3.2% (612)New Jersey:
0.9% (18,317)
India New Brunswick:
2.6% (506)New Jersey:
12.8% (274,609)
Ecuador New Brunswick:
2.3% (444)New Jersey:
4.4% (95,275)
Guatemala New Brunswick:
2.3% (443)New Jersey:
2.2% (46,813)
El Salvador New Brunswick:
1.5% (289)New Jersey:
2.3% (48,885)
Place of birth for U.S.-born residents:
This state: 24,654Other state: 9,933Northeast: 5,403Midwest: 1,043South: 1,871West: 1,600 81.1% of New Brunswick residents lived in the same house 1 years ago.
Out of people who lived in different houses, 24.8% lived in this county.
Out of people who lived in different counties, 44.6% lived in New Jersey.
New Brunswick:
81.1%State average:
90.4%
Education attainment for males 25 years and older:
No schooling: 802Nursery to 4th grade: 8755th and 6th grade: 1,1397th and 8th grade: 5239th grade: 37810th grade: 22411th grade: 13212th grade, no diploma: 646High school graduate (or equivalency): 3,842Less than 1 year of college: 541Some college more than 1 year, no degree: 780Associate degree: 593Bachelor's degree: 1,845Master's degree: 874Professional school degree: 689Doctorate degree: 182
Education attainment for females 25 years and older:
No schooling: 614Nursery to 4th grade: 5495th and 6th grade: 6887th and 8th grade: 5489th grade: 25910th grade: 32611th grade: 32812th grade, no diploma: 715High school graduate (or equivalency): 3,201Less than 1 year of college: 602Some college more than 1 year, no degree: 1,067Associate degree: 684Bachelor's degree: 1,703Master's degree: 844Professional school degree: 274Doctorate degree: 242
Housing units in structures:
One, detached: 3,788One, attached: 1,215Two: 2,9383 or 4: 1,6325 to 9: 1,51610 to 19: 1,65020 to 49: 95750 or more: 3,323Housing units lacking complete plumbing facilities in 2022: 0.5%Housing units lacking complete kitchen facilities in 2022: 1.6%House/condo owner moved in on average 16 years ago
Renter moved in on average 3 years ago
Private vs. public school enrollment:
Students in private schools in grades 1 to 8 (elementary and middle school): 210 Here:
3.7%New Jersey:
12.3%
Students in private schools in grades 9 to 12 (high school): 57 Here:
2.1%New Jersey:
13.1%
Students in private undergraduate colleges: 5,383 Here:
42.8%New Jersey:
33.2%