Mount Clemens, MI (Michigan) Houses and Residents
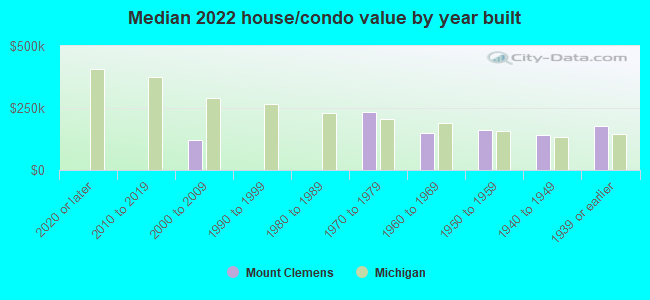
Estimated median house or condo value in 2022: $167,791 (it was $98,100 in 2000 )
Mount Clemens:
$167,791Michigan:
$224,400
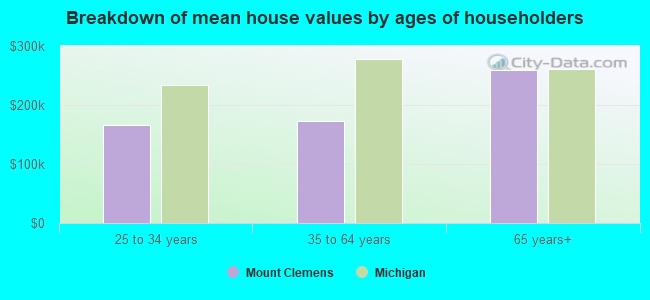
Lower value quartile - upper value quartile: $115,452 - $239,737Mean price in 2022: Detached houses: $176,806 Here:
$176,806State:
$280,038
Townhouses or other attached units: $76,674 Here:
$76,674State:
$239,520
In 2-unit structures: $137,644 Here:
$137,644State:
$219,481
In 3-to-4-unit structures: $90,588 Here:
$90,588State:
$207,067
In 5-or-more-unit structures: $83,584 Here:
$83,584State:
$192,733
Mobile homes: $133,820 Here:
$133,820State:
$72,868
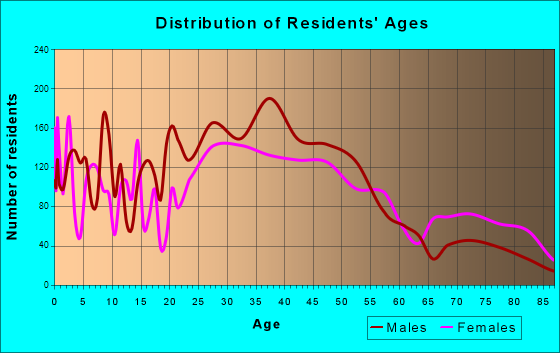
Total population: 16,408 (All urban)
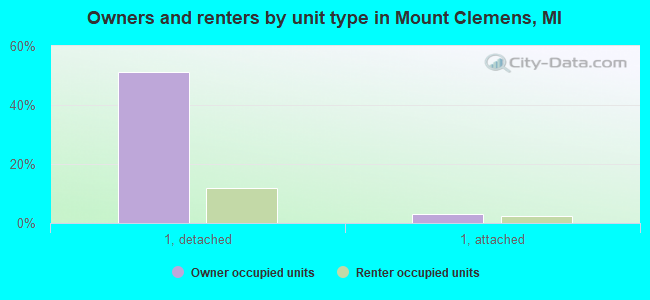
Houses: 6,954 (6,646 occupied: 3,970 owner occupied, 2,702 renter occupied )
% of renters here:
40%State:
27%
Housing density: 1,650 houses/condos per square mile
Median price asked for vacant for-sale houses and condos in 2022: $247,386.
Median contract rent in 2022: $788 (lower quartile is $558, upper quartile is $978)
Median rent asked for vacant for-rent units in 2022: $1,357
Median gross rent in Mount Clemens, MI in 2022: $875
Housing units in Mount Clemens with a mortgage: 2,357 (137 second mortgage, 2 home equity loan, 120 both second mortgage and home equity loan )Houses without a mortgage: 192
Median household income for houses/condos with a mortgage: $83,242
Median household income for apartments without a mortgage: $47,309
Median monthly housing costs: $877
Data:
Median house or condo value ($)
Median house or condo value ($ change since 2000)
Median house or condo value ($) - White
Median house or condo value ($) - Black or African American
Median house or condo value ($) - Asian
Median house or condo value ($) - Hispanic or Latino
Median house or condo value ($) - American Indian and Alaska Native
Median house or condo value ($) - Multirace
Median house or condo value ($) - Other Race
Median price asked for mobile homes ($)
Household density (households per square mile)
Mean house or condo value by units in structure - 1, detached ($)
Mean house or condo value by units in structure - 1, attached ($)
Mean house or condo value by units in structure - 2 ($)
Mean house or condo value by units in structure by units in structure - 3 or 4 ($)
Mean house or condo value by units in structure - 5 or more ($)
Mean house or condo value by units in structure - Boat, RV, van, etc. ($)
Mean house or condo value by units in structure - Mobile home ($)
Median contract rent ($)
Median contract rent - Lower quartile ($)
Median contract rent - Upper quartile ($)
Median gross rent ($)
Urban houses (%)
Rural houses (%)
Houses occupied (%)
Houses occupied (% change since 2000)
Houses owner occupied (%)
Houses owner occupied (% change since 2000)
Houses renter occupied (%)
Houses renter occupied (% change since 2000)
Vacant housing units - For rent (%)
Vacant housing units - For rent (% change since 2000)
Vacant housing units - For sale only (%)
Vacant housing units - For sale only (% change since 2000)
Vacant housing units - Rented or sold, not occupied (%)
Vacant housing units - Rented or sold, not occupied (% change since 2000)
Vacant housing units - For seasonal, recreational, or occasional use (%)
Vacant housing units - For seasonal, recreational, or occasional use (% change since 2000)
Vacant housing units - For migrant workers (%)
Vacant housing units - For migrant workers (% change since 2000)
Vacant housing units - Other vacant (%)
Vacant housing units - Other vacant (% change since 2000)
Median monthly housing costs ($)
Median household income for houses/condos with a mortgage ($)
Median household income for houses/condos without a mortgage ($)
Median household income ($)
Median household income ($) - White
Median household income ($) - Black or African American
Median household income ($) - Asian
Median household income ($) - Hispanic or Latino
Median household income ($) - American Indian and Alaska Native
Median household income ($) - Multirace
Median household income ($) - Other Race
Mortgage status - with mortgage (%)
Mortgage status - with second mortgage (%)
Mortgage status - with home equity loan (%)
Mortgage status - with both second mortgage and home equity loan (%)
Mortgage status - without a mortgage (%)
Median year house/condo built
Median year apartment built
Household type by relationship - Male householder living alone (%)
Household type by relationship - Male householder not living alone (%)
Household type by relationship - Female householder living alone (%)
Household type by relationship - Female householder not living alone (%)
Household type by relationship - Opposite-Sex spouse (%)
Household type by relationship - Same-Sex spouse (%)
Household type by relationship - Opposite-Sex unmarried partner (%)
Household type by relationship - Same-Sex unmarried partner (%)
Household type by relationship - In group quarters (%)
Size of family households - 2-person household (%)
Size of family households - 3-person household (%)
Size of family households - 4-person household (%)
Size of family households - 5-person household (%)
Size of family households - 6-person household (%)
Size of family households - 7-or-more-person household (%)
Size of nonfamily households - 1-person household (%)
Size of nonfamily households - 2-person household (%)
Size of nonfamily households - 3-person household (%)
Size of nonfamily households - 4-person household (%)
Size of nonfamily households - 5-person household (%)
Size of nonfamily households - 6-person household (%)
Size of nonfamily households - 7-or-moreperson household (%)
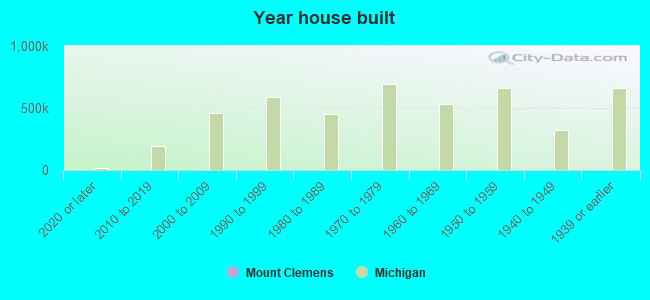
Year house built - Built 2010 or later (%)
Year house built - Built 2000 to 2009 (%)
Year house built - Built 1990 to 1999 (%)
Year house built - Built 1980 to 1989 (%)
Year house built - Built 1970 to 1979 (%)
Year house built - Built 1960 to 1969 (%)
Year house built - Built 1950 to 1959 (%)
Year house built - Built 1940 to 1949 (%)
Year house built - Built 1939 or earlier (%)
Median number of rooms in houses and condos
Median number of rooms in apartments
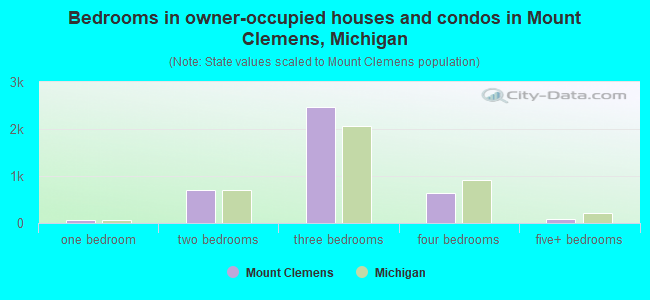
Median number of bedrooms in owner occupied houses
Mean number of bedrooms in owner occupied houses
Median number of bedrooms in renter occupied houses
Mean number of bedrooms in renter occupied houses
Median number of vehichles in owner occupied houses
Mean number of vehichles in owner occupied houses
Median number of vehichles in renter occupied houses
Mean number of vehichles in renter occupied houses
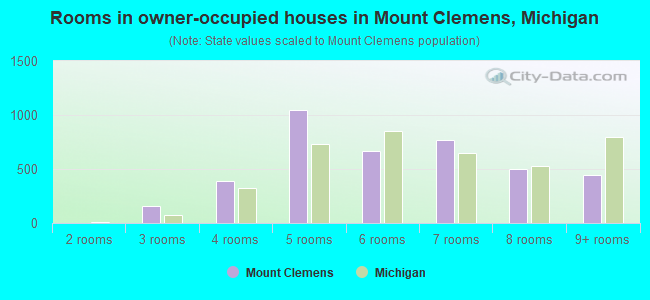
Rooms in owner-occupied houses - 1 room (%)
Rooms in owner-occupied houses - 2 rooms (%)
Rooms in owner-occupied houses - 3 rooms (%)
Rooms in owner-occupied houses - 4 rooms (%)
Rooms in owner-occupied houses - 5 rooms (%)
Rooms in owner-occupied houses - 6 rooms (%)
Rooms in owner-occupied houses - 7 rooms (%)
Rooms in owner-occupied houses - 8 rooms (%)
Rooms in owner-occupied houses - 9+ rooms (%)
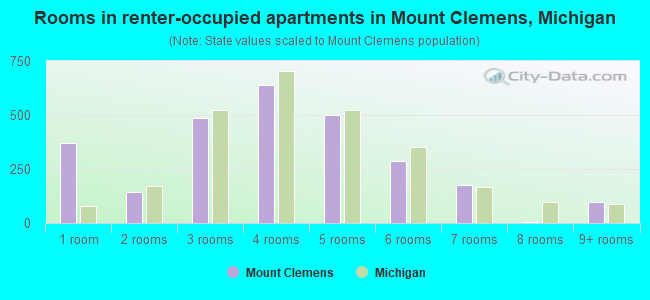
Rooms in renter-occupied houses - 1 room (%)
Rooms in renter-occupied houses - 2 rooms (%)
Rooms in renter-occupied houses - 3 rooms (%)
Rooms in renter-occupied houses - 4 rooms (%)
Rooms in renter-occupied houses - 5 rooms (%)
Rooms in renter-occupied houses - 6 rooms (%)
Rooms in renter-occupied houses - 7 rooms (%)
Rooms in renter-occupied houses - 8 rooms (%)
Rooms in renter-occupied houses - 9+ rooms (%)
Bedrooms in owner-occupied houses - no bedrooms (%)
Bedrooms in owner-occupied houses - 1 bedroom (%)
Bedrooms in owner-occupied houses - 2 bedrooms (%)
Bedrooms in owner-occupied houses - 3 bedrooms (%)
Bedrooms in owner-occupied houses - 4 bedrooms (%)
Bedrooms in owner-occupied houses - 5+ bedrooms (%)
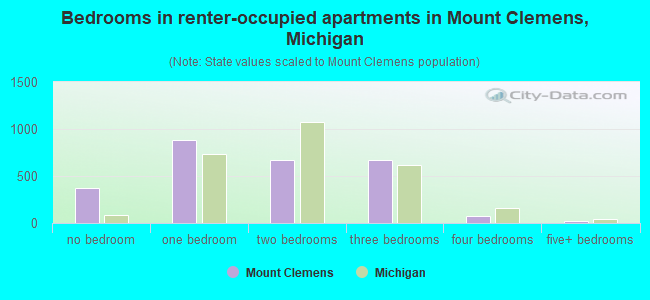
Bedrooms in renter-occupied houses - no bedrooms (%)
Bedrooms in renter-occupied houses - 1 bedroom (%)
Bedrooms in renter-occupied houses - 2 bedrooms (%)
Bedrooms in renter-occupied houses - 3 bedrooms (%)
Bedrooms in renter-occupied houses - 4 bedrooms (%)
Bedrooms in renter-occupied houses - 5+ bedrooms (%)
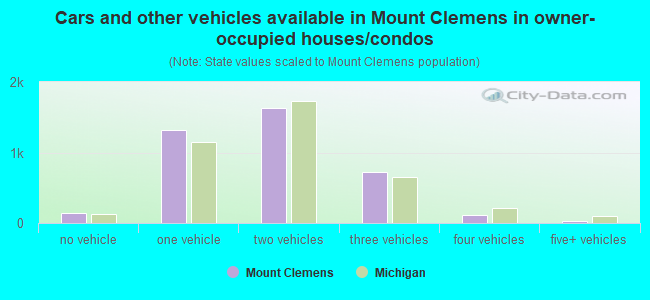
Vehicles available in owner-occupied houses - no vehicle available (%)
Vehicles available in owner-occupied houses - 1 vehicle available(%)
Vehicles available in owner-occupied houses - 2 Vehicles available (%)
Vehicles available in owner-occupied houses - 3 Vehicles available (%)
Vehicles available in owner-occupied houses - 4 Vehicles available (%)
Vehicles available in owner-occupied houses - 5+ Vehicles available (%)
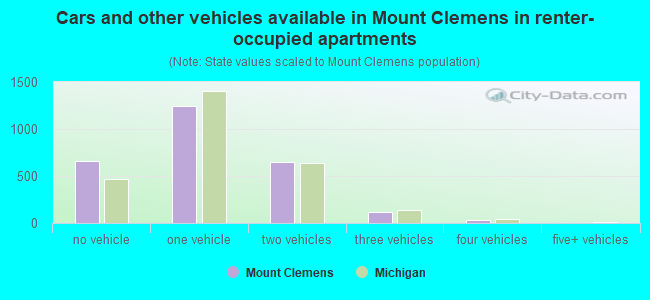
Vehicles available in renter-occupied houses - no vehicle available (%)
Vehicles available in renter-occupied houses - 1 vehicle available (%)
Vehicles available in renter-occupied houses - 2 Vehicles available (%)
Vehicles available in renter-occupied houses - 3 Vehicles available (%)
Vehicles available in renter-occupied houses - 4 Vehicles available (%)
Vehicles available in renter-occupied houses - 5+ Vehicles available (%)
Housing units in structures - 1, detached (%)
Housing units in structures - 1, attached (%)
Housing units in structures - 2 (%)
Housing units in structures - 3 or 4 (%)
Housing units in structures - 5 to 9 (%)
Housing units in structures - 10 to 19 (%)
Housing units in structures - 20 to 49 (%)
Housing units in structures - 50 or more (%)
Housing units in structures - Mobile home (%)
Housing units in structures - Boat, RV, van, etc. (%)
Housing units in structures - Owners - 1, detached (%)
Housing units in structures - Owners - 1, attached (%)
Housing units in structures - Owners - 2 (%)
Housing units in structures - Owners - 3 or 4 (%)
Housing units in structures - Owners - 5 to 9 (%)
Housing units in structures - Owners - 10 to 19 (%)
Housing units in structures - Owners - 20 to 49 (%)
Housing units in structures - Owners - 50 or more (%)
Housing units in structures - Owners - Mobile home (%)
Housing units in structures - Owners - Boat, RV, van, etc. (%)
Housing units in structures - Renters - 1, detached (%)
Housing units in structures - Renters - 1, attached (%)
Housing units in structures - Renters - 2 (%)
Housing units in structures - Renters - 3 or 4 (%)
Housing units in structures - Renters - 5 to 9 (%)
Housing units in structures - Renters - 10 to 19 (%)
Housing units in structures - Renters - 20 to 49 (%)
Housing units in structures - Renters - 50 or more (%)
Housing units in structures - Renters - Mobile home (%)
Housing units in structures - Renters - Boat, RV, van, etc. (%)
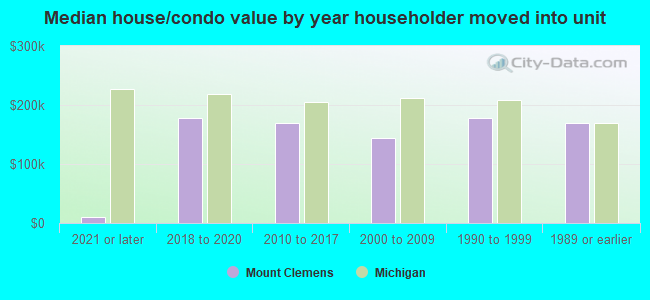
House/condo owner moved in on average (years ago)
Renter moved in on average (years ago)
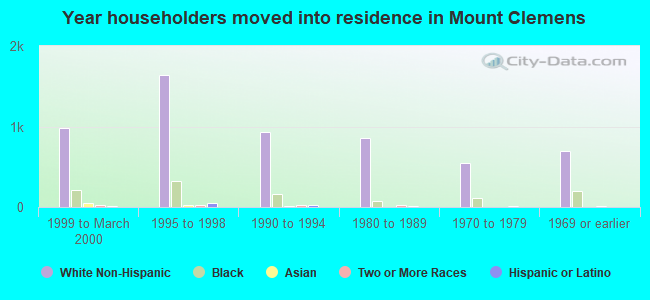
Year householder moved into unit - Moved in 1999 to March 2000 (%)
Year householder moved into unit - Moved in 1999 to March 2000 (%) - White
Year householder moved into unit - Moved in 1999 to March 2000 (%) - Black or African American
Year householder moved into unit - Moved in 1999 to March 2000 (%) - Asian
Year householder moved into unit - Moved in 1999 to March 2000 (%) - Hispanic or Latino
Year householder moved into unit - Moved in 1999 to March 2000 (%) - American Indian and Alaska Native
Year householder moved into unit - Moved in 1999 to March 2000 (%) - Multirace
Year householder moved into unit - Moved in 1999 to March 2000 (%) - Other Race
Year householder moved into unit - Moved in 1995 to 1998 (%)
Year householder moved into unit - Moved in 1995 to 1998 (%) - White
Year householder moved into unit - Moved in 1995 to 1998 (%) - Black or African American
Year householder moved into unit - Moved in 1995 to 1998 (%) - Asian
Year householder moved into unit - Moved in 1995 to 1998 (%) - Hispanic or Latino
Year householder moved into unit - Moved in 1995 to 1998 (%) - American Indian and Alaska Native
Year householder moved into unit - Moved in 1995 to 1998 (%) - Multirace
Year householder moved into unit - Moved in 1995 to 1998 (%) - Other Race
Year householder moved into unit - Moved in 1990 to 1994 (%)
Year householder moved into unit - Moved in 1990 to 1994 (%) - White
Year householder moved into unit - Moved in 1990 to 1994 (%) - Black or African American
Year householder moved into unit - Moved in 1990 to 1994 (%) - Asian
Year householder moved into unit - Moved in 1990 to 1994 (%) - Hispanic or Latino
Year householder moved into unit - Moved in 1990 to 1994 (%) - American Indian and Alaska Native
Year householder moved into unit - Moved in 1990 to 1994 (%) - Multirace
Year householder moved into unit - Moved in 1990 to 1994 (%) - Other Race
Year householder moved into unit - Moved in 1980 to 1989 (%)
Year householder moved into unit - Moved in 1980 to 1989 (%) - White
Year householder moved into unit - Moved in 1980 to 1989 (%) - Black or African American
Year householder moved into unit - Moved in 1980 to 1989 (%) - Asian
Year householder moved into unit - Moved in 1980 to 1989 (%) - Hispanic or Latino
Year householder moved into unit - Moved in 1980 to 1989 (%) - American Indian and Alaska Native
Year householder moved into unit - Moved in 1980 to 1989 (%) - Multirace
Year householder moved into unit - Moved in 1980 to 1989 (%) - Other Race
Year householder moved into unit - Moved in 1970 to 1979 (%)
Year householder moved into unit - Moved in 1970 to 1979 (%) - White
Year householder moved into unit - Moved in 1970 to 1979 (%) - Black or African American
Year householder moved into unit - Moved in 1970 to 1979 (%) - Asian
Year householder moved into unit - Moved in 1970 to 1979 (%) - Hispanic or Latino
Year householder moved into unit - Moved in 1970 to 1979 (%) - American Indian and Alaska Native
Year householder moved into unit - Moved in 1970 to 1979 (%) - Multirace
Year householder moved into unit - Moved in 1970 to 1979 (%) - Other Race
Year householder moved into unit - Moved in 1969 or earlier (%)
Year householder moved into unit - Moved in 1969 or earlier (%) - White
Year householder moved into unit - Moved in 1969 or earlier (%) - Black or African American
Year householder moved into unit - Moved in 1969 or earlier (%) - Asian
Year householder moved into unit - Moved in 1969 or earlier (%) - Hispanic or Latino
Year householder moved into unit - Moved in 1969 or earlier (%) - American Indian and Alaska Native
Year householder moved into unit - Moved in 1969 or earlier (%) - Multirace
Year householder moved into unit - Moved in 1969 or earlier (%) - Other Race
Housing units lacking complete plumbing facilities (%)
Housing units lacking complete kitchen facilities (%)
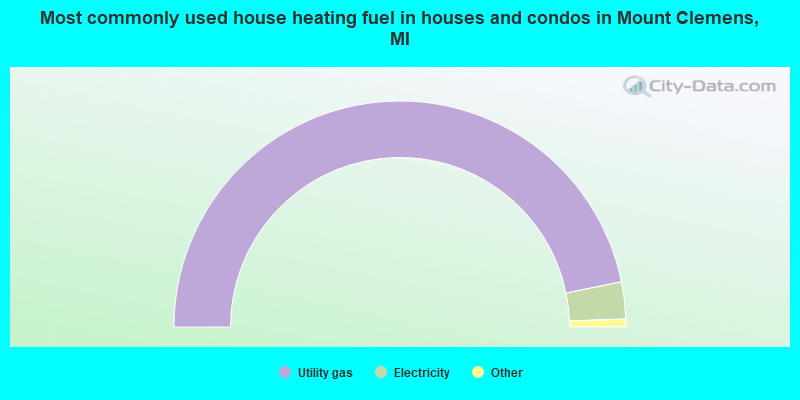
House heating fuel used in houses and condos - Utility gas (%)
House heating fuel used in houses and condos - Bottled, tank, or LP gas (%)
House heating fuel used in houses and condos - Electricity (%)
House heating fuel used in houses and condos - Fuel oil, kerosene, etc. (%)
House heating fuel used in houses and condos - Coal or coke (%)
House heating fuel used in houses and condos - Wood (%)
House heating fuel used in houses and condos - Solar energy (%)
House heating fuel used in houses and condos - Other fuel (%)
House heating fuel used in houses and condos - No fuel used (%)
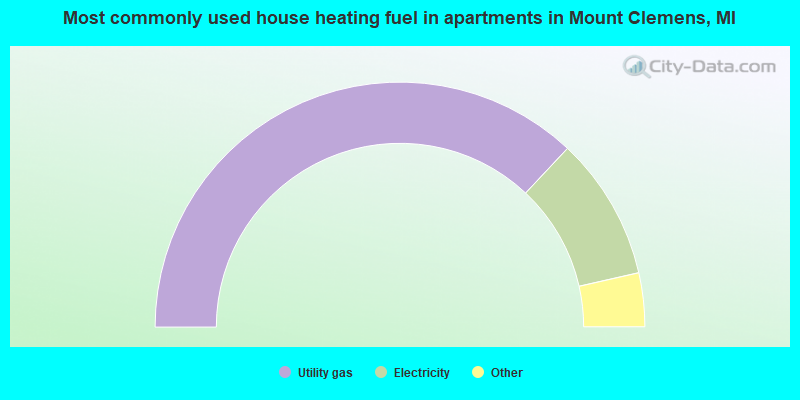
House heating fuel used in apartments - Utility gas (%)
House heating fuel used in apartments - Bottled, tank, or LP gas (%)
House heating fuel used in apartments - Electricity (%)
House heating fuel used in apartments - Fuel oil, kerosene, etc. (%)
House heating fuel used in apartments - Coal or coke (%)
House heating fuel used in apartments - Wood (%)
House heating fuel used in apartments - Solar energy (%)
House heating fuel used in apartments - Other fuel (%)
House heating fuel used in apartments - No fuel used (%)
Median year house/condo built: 1952Median year apartment built: 1964Household type by relationship:
Households: 15,603
Male householders: 3,468 (1,296 living alone ), Female householders: 3,082 (1,237 living alone )2,182 spouses (2,167 opposite-sex spouses ), 379 unmarried partners , (367 opposite-sex unmarried partners ), 4,077 children (3,792 natural , 31 adopted , 252 stepchildren ), 339 grandchildren , 149 brothers or sisters , 33 parents , 0 foster children , 85 other relatives , 414 non-relatives In group quarters: 1,390
Size of family households: 1,758 2-persons , 1,039 3-persons , 571 4-persons , 149 5-persons , 58 6-persons , 72 7-or-more-persons .
Size of nonfamily households: 2,488 1-person , 458 2-persons , 68 3-persons , 8 5-persons .
1,405 married couples with children. single-parent households (392 men , 682 women ).
95.8% of residents of Mount Clemens speak English at home. of residents speak Spanish at home (41% speak English very well , 51% speak English well , 5% speak English not well , 3% don't speak English at all ).of residents speak other Indo-European language at home (60% speak English very well , 36% speak English well , 4% speak English not well ).of residents speak Asian or Pacific Island language at home (65% speak English very well , 35% don't speak English at all ).of residents speak other language at home (100% speak English very well ).
Foreign born population: 277 (1.8%)of them are naturalized citizens )
Median number of rooms in houses and condos:
Median number of rooms in apartments
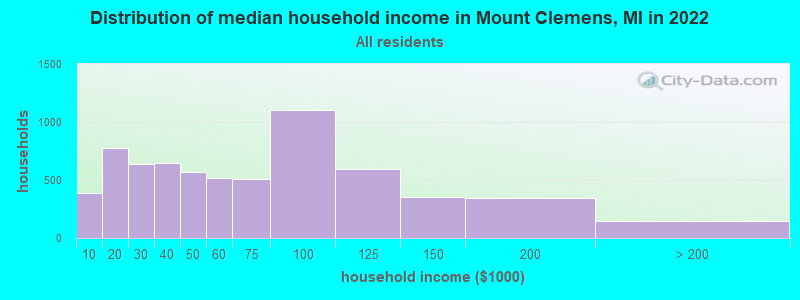
Mount Clemens, MI household income distribution 387 Less than $10,000772 $10,000 to $19,999634 $20,000 to $29,999646 $30,000 to $39,999573 $40,000 to $49,999520 $50,000 to $59,999509 $60,000 to $74,9991,102 $75,000 to $99,999591 $100,000 to $124,999356 $125,000 to $149,999345 $150,000 to $199,999147 $200,000 or more
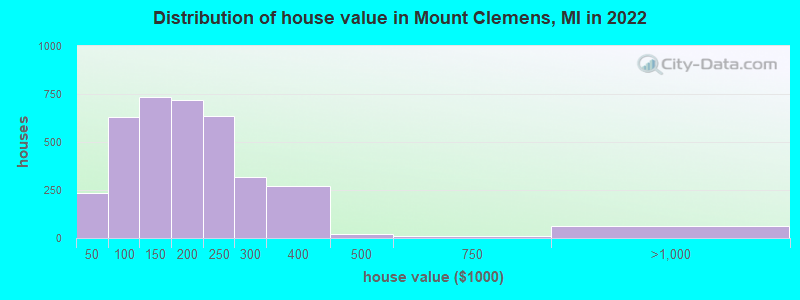
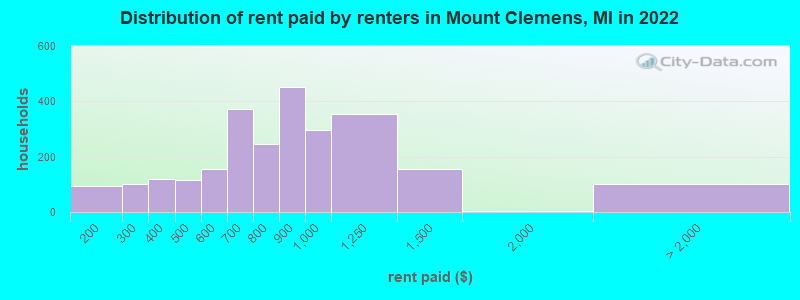
Home value of owner - occupied houses in 2022 in Mount Clemens, MI 50 Less than $10,00055 $15,000 to $19,99923 $20,000 to $24,99912 $25,000 to $29,9992 $30,000 to $34,9990 $35,000 to $39,99989 $40,000 to $49,99962 $50,000 to $59,999106 $60,000 to $69,999166 $70,000 to $79,999115 $80,000 to $89,99986 $90,000 to $99,999350 $100,000 to $124,999383 $125,000 to $149,999518 $150,000 to $174,999198 $175,000 to $199,999634 $200,000 to $249,999315 $250,000 to $299,999272 $300,000 to $399,99919 $400,000 to $499,99910 $500,000 to $749,99956 $750,000 to $999,9998 $2,000,000 or moreRent paid by renters in 2022 in Mount Clemens, MI 2 Less than $10039 $100 to $14953 $150 to $19929 $200 to $24970 $250 to $29930 $300 to $34989 $350 to $39967 $400 to $44947 $450 to $49961 $500 to $54993 $550 to $599166 $600 to $649207 $650 to $699122 $700 to $749123 $750 to $799452 $800 to $899296 $900 to $999353 $1,000 to $1,249156 $1,250 to $1,4993 $1,500 to $1,99915 $2,000 to $2,49985 No cash rent
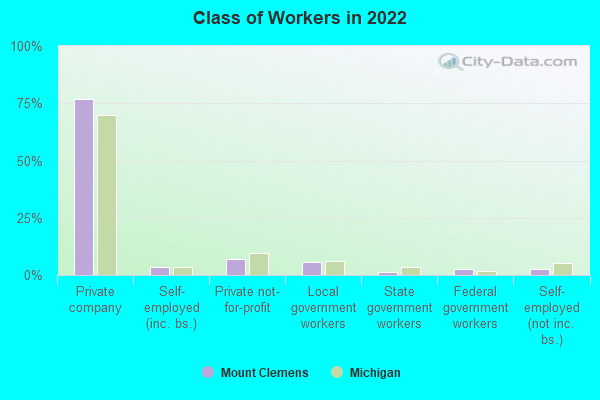
Percentage of workers working in this county: 77.8%Number of people working at home: 447 (6.3% of all workers )
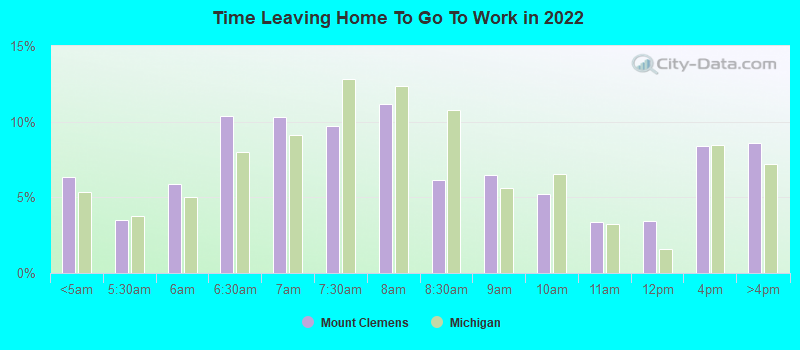
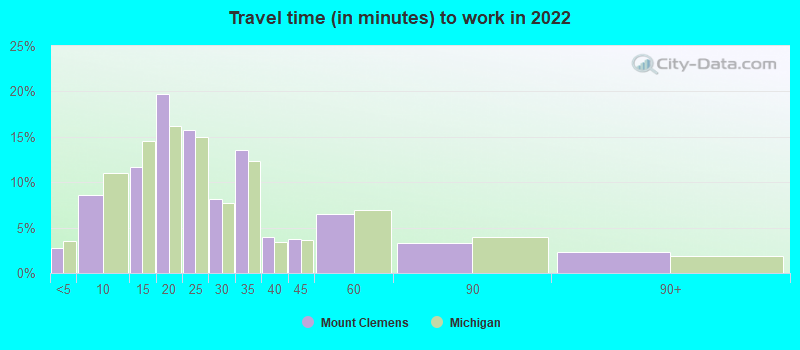
Travel time to work (commute)
Less than 5 minutes: 3365 to 9 minutes: 55810 to 14 minutes: 89115 to 19 minutes: 84720 to 24 minutes: 1,23525 to 29 minutes: 36730 to 34 minutes: 96835 to 39 minutes: 22440 to 44 minutes: 31745 to 59 minutes: 44660 to 89 minutes: 10090 or more minutes: 248
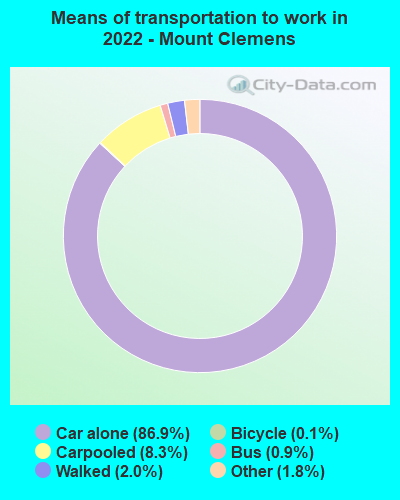
Means of transportation to work:
Drove a car alone: 9,443 (79.4%)Carpooled: 954 (8.0%)Bus : 75 (0.6%)Taxi: 212 (1.8%)Bicycle: 24 (0.2%)Walked: 234 (2.0%)Worked at home: 447 (3.8%)
Unemployment by race in 2022
Unemployment rate for White non-Hispanic residents 4.5% Males2.3% FemalesUnemployment rate for Black residents 11.1% Males23.2% FemalesUnemployment rate for other race residents 61.1% FemalesUnemployment rate for two or more race residents 1.2% Males
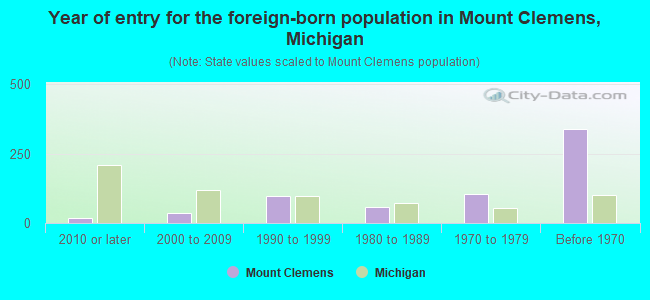
Year of entry for the foreign-born population in Mount Clemens, Michigan
19 2010 or later 35 2000 to 2009 98 1990 to 1999 56 1980 to 1989 106 1970 to 1979 339 Before 1970
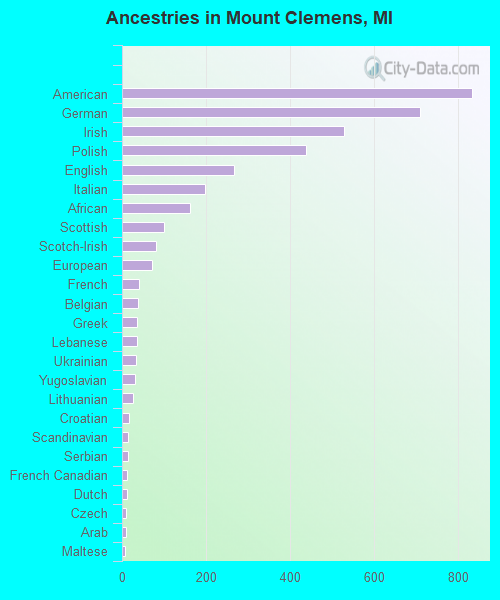
First ancestries reported:
American: 833 (12.3%)
German: 711 (10.5%)
Irish: 530 (7.8%)
Polish: 439 (6.5%)
English: 267 (3.9%)
Italian: 197 (2.9%)
African: 162 (2.4%)
Scottish: 100 (1.5%)
Scotch-Irish: 80 (1.2%)
European: 72 (1.1%)
French: 41 (0.6%)
Belgian: 37 (0.5%)
Greek: 36 (0.5%)
Lebanese: 35 (0.5%)
Ukrainian: 33 (0.5%)
Yugoslavian: 30 (0.4%)
Lithuanian: 26 (0.4%)
Croatian: 16 (0.2%)
Scandinavian: 15 (0.2%)
Serbian: 14 (0.2%)
French Canadian: 13 (0.2%)
Dutch: 12 (0.2%)
Czech: 10 (0.1%)
Arab: 9 (0.1%)
Maltese: 8 (0.1%)
Canadian: 8 (0.1%)
Albanian: 7 (0.1%)
Egyptian: 6 (0.09%)
Finnish: 5 (0.07%)
Slovak: 5 (0.07%)
Eastern European: 4 (0.06%)
Romanian: 4 (0.06%)
Russian: 4 (0.06%) Most common places of birth for foreign-born residents (%): Mexico Mount Clemens:
33.3% (94)Michigan:
10.9% (75,965)
Bosnia and Herzegovina Mount Clemens:
13.5% (38)Michigan:
0.9% (6,009)
Canada Mount Clemens:
10.3% (29)Michigan:
5.0% (35,052)
Philippines Mount Clemens:
6.7% (19)Michigan:
2.8% (19,112)
Germany Mount Clemens:
5.3% (15)Michigan:
2.3% (16,126)
Iraq Mount Clemens:
3.9% (11)Michigan:
8.1% (55,954)
Russia Mount Clemens:
3.9% (11)Michigan:
0.9% (6,326)
Greece Mount Clemens:
2.8% (8)Michigan:
0.4% (2,721)
India Mount Clemens:
2.5% (7)Michigan:
11.1% (77,240)
Italy Mount Clemens:
2.5% (7)Michigan:
1.1% (7,792)
Albania Mount Clemens:
2.1% (6)Michigan:
1.9% (12,910)
Egypt Mount Clemens:
2.1% (6)Michigan:
0.6% (3,827)
Place of birth for U.S.-born residents:
This state: 12,784Other state: 2,608Northeast: 209Midwest: 789South: 1,168West: 465 83.9% of Mount Clemens residents lived in the same house 1 years ago.
Out of people who lived in different houses, 41.4% lived in this county.
Out of people who lived in different counties, 78.5% lived in Michigan.
Mount Clemens:
83.9%State average:
88.4%
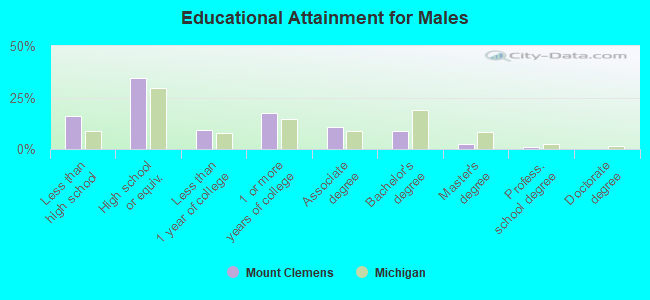
Education attainment for males 25 years and older:
No schooling: 144Nursery to 4th grade: 05th and 6th grade: 57th and 8th grade: 369th grade: 8710th grade: 20811th grade: 23312th grade, no diploma: 226High school graduate (or equivalency): 2,051Less than 1 year of college: 559Some college more than 1 year, no degree: 1,031Associate degree: 643Bachelor's degree: 523Master's degree: 151Professional school degree: 49Doctorate degree: 6
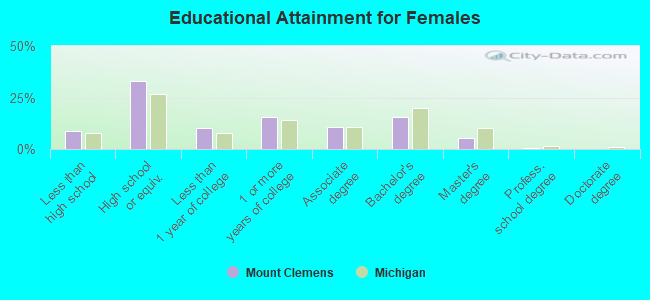
Education attainment for females 25 years and older:
No schooling: 108Nursery to 4th grade: 05th and 6th grade: 227th and 8th grade: 299th grade: 910th grade: 6911th grade: 13512th grade, no diploma: 111High school graduate (or equivalency): 1,809Less than 1 year of college: 550Some college more than 1 year, no degree: 851Associate degree: 594Bachelor's degree: 845Master's degree: 297Professional school degree: 39Doctorate degree: 11
Housing units in structures:
One, detached: 4,532One, attached: 347Two: 2253 or 4: 5155 to 9: 32610 to 19: 41020 to 49: 4550 or more: 403Mobile homes: 147Median worth of mobile homes: $53,873
Housing units lacking complete plumbing facilities in 2022: 0.4%Housing units lacking complete kitchen facilities in 2022: 0.8%House/condo owner moved in on average 14 years ago
Renter moved in on average 3 years ago
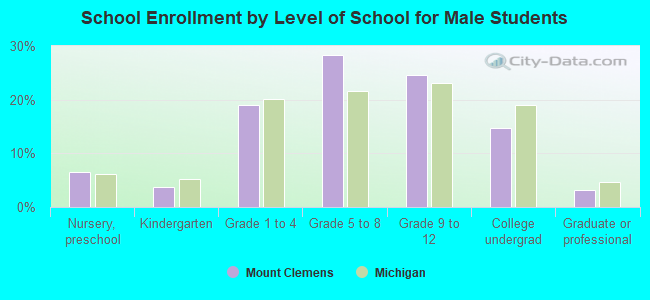
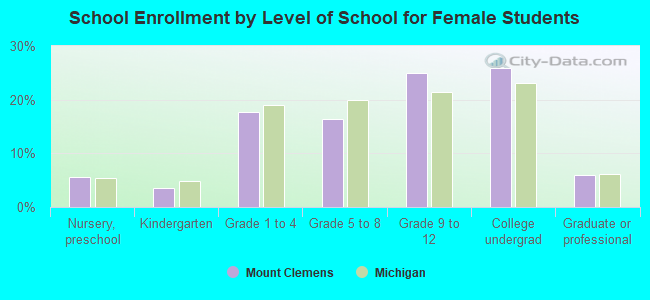
Private vs. public school enrollment:
Students in private schools in grades 1 to 8 (elementary and middle school): 24 Students in private schools in grades 9 to 12 (high school): 136 Students in private undergraduate colleges: 35