Millsboro, DE (Delaware) Houses and Residents
| Millsboro: | $291,744 |
| Delaware: | $337,200 |
Mean price in 2022:
Detached houses: $343,430
Here: $343,430 State: $419,599 Townhouses or other attached units: $187,392
Here: $187,392 State: $291,415 In 5-or-more-unit structures: $181,829
Here: $181,829 State: $212,751 Mobile homes: $34,933
Here: $34,933 State: $106,273
Total population: 4,120 (Urban population: 2,325 (all inside urban clusters), Rural population: 0)
Houses: 3,210 (3,052 occupied: 1,978 owner occupied, 1,057 renter occupied)
| % of renters here: | 35% |
| State: | 26% |
Housing density: 1,861 houses/condos per square mile
Median price asked for vacant for-sale houses and condos in 2022 in this county: $381,009.
Median contract rent in 2022: $1,021 (lower quartile is $706, upper quartile is $1,421)
Median rent asked for vacant for-rent units in 2022: $1,464
Median gross rent in Millsboro, DE in 2022: $1,159
Housing units in Millsboro with a mortgage: 1,602 (50 second mortgage, 0 home equity loan, 50 both second mortgage and home equity loan)
Houses without a mortgage: 0
Median household income for houses/condos with a mortgage: $87,300
Median household income for apartments without a mortgage: $74,089
Median monthly housing costs: $1,199
Compare current foreclosures in Millsboro, DE:
| Photo | Address | Area | Beds / Baths | Price | Details |
|---|---|---|---|---|---|

|
#1
Dodd St
Millsboro, DE 19966
|
- sq. feet
|
3 baths 5 beds |
show details | |

|
#2
Kent Dr
Millsboro, DE 19966
|
1,478 sq. feet
|
- baths 3 beds |
show details | |

|
#3
Granville Dr
Millsboro, DE 19966
|
2,052 sq. feet
|
- baths 4 beds |
show details | |

|
#4
Timbercreek Ln
Millsboro, DE 19966
|
2,224 sq. feet
|
- baths 3 beds |
show details | |

|
#5
Caitlins Way
Millsboro, DE 19966
|
714 sq. feet
|
- baths 2 beds |
show details | |

|
#6
Godwin School Rd
Millsboro, DE 19966
|
2,536 sq. feet
|
- baths 3 beds |
show details | |

|
#7
Jersey Rd
Millsboro, DE 19966
|
1,344 sq. feet
|
- baths 2 beds |
show details | |

|
#8
Gravel Hill Rd
Millsboro, DE 19966
|
1,432 sq. feet
|
- baths 2 beds |
show details | |

|
#9
Kendall St
Millsboro, DE 19966
|
1,008 sq. feet
|
- baths 3 beds |
show details | |

|
#10
Gull Point Rd
Millsboro, DE 19966
|
1,308 sq. feet
|
- baths 3 beds |
show details |
| Photo | Address | Area | Beds / Baths | Price | Details |
|---|---|---|---|---|---|

|
#11
John B Dr
Millsboro, DE 19966
|
1,874 sq. feet
|
- baths 3 beds |
show details | |

|
#12
Main St
Millsboro, DE 19966
|
746 sq. feet
|
- baths - beds |
show details | |

|
#13
Timbercreek Ln
Millsboro, DE 19966
|
2,115 sq. feet
|
- baths 3 beds |
show details | |

|
#14
Hollyville Rd
Millsboro, DE 19966
|
1,792 sq. feet
|
- baths 3 beds |
show details | |

|
#15
School Ln
Millsboro, DE 19966
|
1,328 sq. feet
|
- baths - beds |
show details | |

|
#16
White Pine Dr
Millsboro, DE 19966
|
1,080 sq. feet
|
- baths 3 beds |
show details | |

|
#17
Grace St
Millsboro, DE 19966
|
2,255 sq. feet
|
- baths 3 beds |
show details | |

|
#18
Bethesda Rd
Millsboro, DE 19966
|
1,248 sq. feet
|
- baths 3 beds |
show details | |

|
#19
Clipper Dr
Millsboro, DE 19966
|
1,456 sq. feet
|
- baths 3 beds |
show details | |

|
#20
Samuel Adams Cir
Millsboro, DE 19966
|
3,259 sq. feet
|
- baths 4 beds |
show details |
| Photo | Address | Area | Beds / Baths | Price | Details |
|---|---|---|---|---|---|

|
#21
Sandridge Ct
Millsboro, DE 19966
|
2,173 sq. feet
|
- baths 3 beds |
show details | |

|
#22
Sylvia Dr
Millsboro, DE 19966
|
1,568 sq. feet
|
- baths 3 beds |
show details | |

|
#23
Possum Point Rd
Millsboro, DE 19966
|
- sq. feet
|
- baths - beds |
show details | |

|
#24
Sailfish Ln
Millsboro, DE 19966
|
- sq. feet
|
- baths - beds |
show details | |

|
#25
Old Landing Rd
Millsboro, DE 19966
|
960 sq. feet
|
- baths - beds |
show details | |

|
#26
Kent Dr
Millsboro, DE 19966
|
- sq. feet
|
- baths - beds |
show details | |

|
#27
Sandridge Ct
Millsboro, DE 19966
|
- sq. feet
|
- baths - beds |
show details | |

|
#28
Pine Dr
Millsboro, DE 19966
|
- sq. feet
|
- baths - beds |
show details | |

|
#29
Cari Dr
Millsboro, DE 19966
|
- sq. feet
|
- baths - beds |
show details | |

|
#30
Radish Rd
Millsboro, DE 19966
|
- sq. feet
|
- baths - beds |
show details |
| Photo | Address | Area | Beds / Baths | Price | Details |
|---|---|---|---|---|---|

|
#31
Quail Ln
Millsboro, DE 19966
|
- sq. feet
|
- baths - beds |
show details | |

|
#32
Brunswick Ln
Millsboro, DE 19966
|
- sq. feet
|
- baths - beds |
show details | |

|
#33
Country Meadows Dr
Millsboro, DE 19966
|
- sq. feet
|
- baths - beds |
show details | |

|
#34
Hollyville Rd
Millsboro, DE 19966
|
1,400 sq. feet
|
- baths - beds |
show details | |

|
#35
Sunset Lane
Millsboro, DE 19966
|
- sq. feet
|
- baths - beds |
show details | |

|
#36
E Albemarle Ct
Millsboro, DE 19966
|
1,680 sq. feet
|
- baths - beds |
show details | |

|
#37
Riverside Plaza Dr, Unit 5203
Millsboro, DE 19966
|
- sq. feet
|
- baths - beds |
show details | |

|
#38
Moores Xing Unit 21
Millsboro, DE 19966
|
- sq. feet
|
- baths - beds |
show details | |

|
#39
Saint Thomas Blvd
Millsboro, DE 19966
|
- sq. feet
|
- baths - beds |
show details | |

|
#40
Bobbys Branch Rd
Millsboro, DE 19966
|
- sq. feet
|
- baths - beds |
show details |
| Photo | Address | Area | Beds / Baths | Price | Details |
|---|---|---|---|---|---|

|
#41
Sandpiper Dr
Millsboro, DE 19966
|
1,680 sq. feet
|
- baths - beds |
show details | |

|
#42
Bethesda Rd
Millsboro, DE 19966
|
1,680 sq. feet
|
- baths - beds |
show details | |

|
#43
Cassville Ln
Millsboro, DE 19966
|
- sq. feet
|
- baths - beds |
show details | |

|
#44
Windswept Dr Unit 8201
Millsboro, DE 19966
|
- sq. feet
|
- baths - beds |
show details | |

|
#45
Harmons Hill Rd
Millsboro, DE 19966
|
1,680 sq. feet
|
- baths - beds |
show details | |

|
#46
Riverside Plaza Dr, Unit 3101
Millsboro, DE 19966
|
- sq. feet
|
- baths - beds |
show details | |

|
#47
Old Salt Cv
Millsboro, DE 19966
|
- sq. feet
|
- baths - beds |
show details | |

|
#48
Jeannette Rd
Millsboro, DE 19966
|
- sq. feet
|
- baths - beds |
show details | |

|
#49
Windswept Dr Unit 9101
Millsboro, DE 19966
|
- sq. feet
|
- baths - beds |
show details | |

|
Check over 1 million property listings on Foreclosure.com!
|
browse all offers | |||

Latest news about housing in Millsboro, DE collected exclusively by city-data.com from local newspapers, TV, and radio stations

 | Headed back to check out yearly rental homes in Sussex...Questions about Condo Communities (10 replies) |
| Insight Homes HELP! (69 replies) |
| Moving to Millsboro DE (8 replies) |
| Millsboro area, Peninsula Lakes (36 replies) |
| Revisiting Baywood (28 replies) |
| Coronavirus in Delaware: a place to share news, tips, information (1873 replies) |

Median year apartment built: 2014
Household type by relationship:
Households: 7,312- Male householders: 1,366 (339 living alone), Female householders: 1,708 (712 living alone)
1,469 spouses (1,384 opposite-sex spouses), 40 unmarried partners, (40 opposite-sex unmarried partners), 1,967 children (1,924 natural, 0 adopted, 42 stepchildren), 193 grandchildren, 125 brothers or sisters, 0 parents, 0 foster children, 80 other relatives, 141 non-relatives
- In group quarters: 219
Size of family households: 1,097 2-persons, 356 3-persons, 323 4-persons, 94 5-persons, 67 6-persons, 1 7-or-more-persons.
Size of nonfamily households: 979 1-person, 49 2-persons, 18 5-persons.
1,172 married couples with children.
334 single-parent households (122 men, 212 women).
88.5% of residents of Millsboro speak English at home.
8.9% of residents speak Spanish at home (64% speak English very well, 1% speak English well, 32% speak English not well, 4% don't speak English at all).
2.1% of residents speak other Indo-European language at home (82% speak English very well, 18% speak English well).
1.4% of residents speak Asian or Pacific Island language at home (61% speak English well, 39% speak English not well).
0.3% of residents speak other language at home (78% speak English very well, 22% speak English well).
Foreign born population: 495 (6.8%)
(46.1% of them are naturalized citizens)
| Here: | 5.8 |
| State: | 6.9 |
| Here: | 4.5 |
| State: | 4.4 |

- Bedrooms in owner-occupied houses and condos in Millsboro, Delaware
- 0no bedroom
- 01 bedroom
- 4762 bedrooms
- 1,3543 bedrooms
- 1054 bedrooms
- 435+ bedrooms

- Bedrooms in renter-occupied apartments in Millsboro, Delaware
- 28no bedroom
- 1521 bedroom
- 4052 bedrooms
- 4223 bedrooms
- 494 bedrooms
- 05+ bedrooms

- Cars and other vehicles available in Millsboro in owner-occupied houses/condos
- 8no vehicle
- 9041 vehicle
- 7982 vehicles
- 2283 vehicles
- 404 vehicles
- 05+ vehicles

- Cars and other vehicles available in Millsboro in renter-occupied apartments
- 222no vehicle
- 4721 vehicle
- 2932 vehicles
- 343 vehicles
- 374 vehicles
- 05+ vehicles

- Rooms in owner-occupied houses in Millsboro, Delaware
- 01 room
- 02 rooms
- 823 rooms
- 2564 rooms
- 5265 rooms
- 3836 rooms
- 2907 rooms
- 1318 rooms
- 3109+ rooms

- Rooms in renter-occupied apartments in Millsboro, Delaware
- 281 room
- 272 rooms
- 2193 rooms
- 2874 rooms
- 3015 rooms
- 1396 rooms
- 367 rooms
- 208 rooms
- 09+ rooms


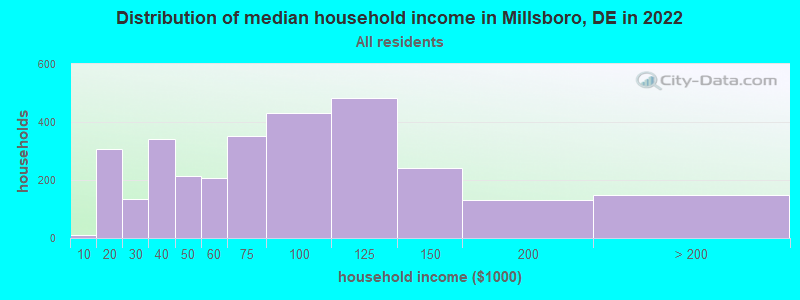
Millsboro, DE household income distribution

- 11Less than $10,000
- 306$10,000 to $19,999
- 134$20,000 to $29,999
- 340$30,000 to $39,999
- 215$40,000 to $49,999
- 207$50,000 to $59,999
- 353$60,000 to $74,999
- 430$75,000 to $99,999
- 484$100,000 to $124,999
- 241$125,000 to $149,999
- 130$150,000 to $199,999
- 147$200,000 or more
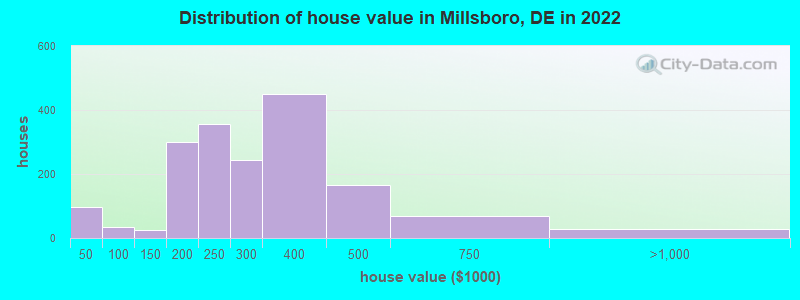
Home value of owner - occupied houses in 2022 in Millsboro, DE
-
- 10$10,000 to $14,999
- 20$15,000 to $19,999
- 3$20,000 to $24,999
- 47$25,000 to $29,999
- 15$30,000 to $34,999
- 1$50,000 to $59,999
- 26$60,000 to $69,999
- 6$80,000 to $89,999
- 24$125,000 to $149,999
- 199$150,000 to $174,999
- 100$175,000 to $199,999
- 356$200,000 to $249,999
- 243$250,000 to $299,999
- 450$300,000 to $399,999
- 164$400,000 to $499,999
- 69$500,000 to $749,999
- 28$750,000 to $999,999
Rent paid by renters in 2022 in Millsboro, DE
-
- 123Less than $100
- 42$200 to $249
- 35$250 to $299
- 52$500 to $549
- 20$700 to $749
- 47$750 to $799
- 91$800 to $899
- 41$900 to $999
- 140$1,000 to $1,249
- 191$1,250 to $1,499
- 64$1,500 to $1,999
- 60$2,000 to $2,499
- 30No cash rent


Percentage of workers working in this county: 88.1%
Number of people working at home: 363 (10.9% of all workers)

Travel time to work (commute)
- Less than 5 minutes: 0
- 5 to 9 minutes: 274
- 10 to 14 minutes: 222
- 15 to 19 minutes: 358
- 20 to 24 minutes: 502
- 25 to 29 minutes: 196
- 30 to 34 minutes: 571
- 35 to 39 minutes: 185
- 40 to 44 minutes: 95
- 45 to 59 minutes: 213
- 60 to 89 minutes: 189
- 90 or more minutes: 133
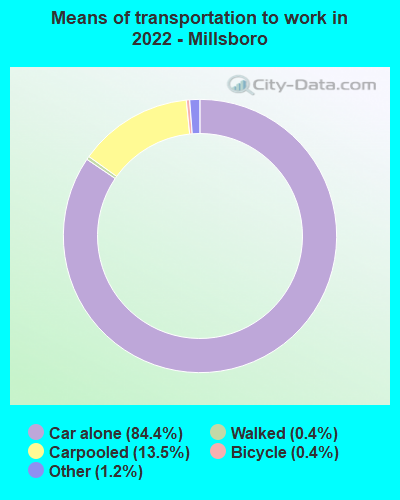
Means of transportation to work:
- Drove a car alone: 3,710 (76.0%)
- Carpooled: 544 (11.1%)
- Bus: 2 (0.0%)
- Taxi: 62 (1.3%)
- Bicycle: 14 (0.3%)
- Walked: 20 (0.4%)
- Worked at home: 363 (7.4%)

- Unemployment by race in 2022
- Unemployment rate for White non-Hispanic residents
- 0.5%Males
- 0.5%Females
- Unemployment rate for other race residents
- 96.4%Females
- Unemployment rate for Hispanic or Latino residents
- 94.9%Females

- Year of entry for the foreign-born population in Millsboro, Delaware
- 512010 or later
- 2402000 to 2009
- 1091990 to 1999
- 201980 to 1989
- 01970 to 1979
- 8Before 1970

First ancestries reported:
- English: 427 (11.4%)
- Italian: 312 (8.4%)
- Irish: 295 (7.9%)
- German: 147 (3.9%)
- American: 136 (3.6%)
- Scottish: 97 (2.6%)
- Latvian: 73 (2.0%)
- European: 42 (1.1%)
- French Canadian: 33 (0.9%)
- French: 29 (0.8%)
- Nigerian: 29 (0.8%)
- Bulgarian: 24 (0.6%)
- Polish: 22 (0.6%)
- Romanian: 20 (0.5%)
- Scotch-Irish: 16 (0.4%)
- Russian: 15 (0.4%)
- Croatian: 13 (0.3%)
- Hungarian: 12 (0.3%)
- Lithuanian: 8 (0.2%)
Most common places of birth for foreign-born residents (%):
| Millsboro: | 22.6% (108) |
| Delaware: | 6.0% (5,803) |
| Millsboro: | 21.5% (103) |
| Delaware: | 1.7% (1,635) |
| Millsboro: | 20.1% (96) |
| Delaware: | 15.3% (14,887) |
| Millsboro: | 7.5% (36) |
| Delaware: | 0.2% (155) |
| Millsboro: | 4.8% (23) |
| Delaware: | 0.4% (374) |
| Millsboro: | 3.8% (18) |
| Delaware: | 0.2% (174) |
| Millsboro: | 3.8% (18) |
| Delaware: | 1.6% (1,518) |
| Millsboro: | 3.3% (16) |
| Delaware: | 3.1% (2,996) |
| Millsboro: | 2.5% (12) |
| Delaware: | 0.2% (201) |
| Millsboro: | 2.5% (12) |
| Delaware: | 11.6% (11,288) |
| Millsboro: | 2.5% (12) |
| Delaware: | 3.0% (2,919) |
| Millsboro: | 1.9% (9) |
| Delaware: | 1.3% (1,297) |
| Millsboro: | 1.7% (8) |
| Delaware: | 0.9% (846) |
Place of birth for U.S.-born residents:
- This state: 2,830
- Other state: 3,906
- Northeast: 2,012
- Midwest: 193
- South: 1,573
- West: 126
88.9% of Millsboro residents lived in the same house 1 years ago.
Out of people who lived in different houses, 28.6% lived in this county.
Out of people who lived in different counties, 50.5% lived in Delaware.
| Millsboro: | 88.9% |
| State average: | 89.2% |
Education attainment for males 25 years and older:
- No schooling: 44
- Nursery to 4th grade: 0
- 5th and 6th grade: 88
- 7th and 8th grade: 3
- 9th grade: 3
- 10th grade: 16
- 11th grade: 64
- 12th grade, no diploma: 5
- High school graduate (or equivalency): 425
- Less than 1 year of college: 228
- Some college more than 1 year, no degree: 350
- Associate degree: 101
- Bachelor's degree: 479
- Master's degree: 272
- Professional school degree: 23
- Doctorate degree: 4

Education attainment for females 25 years and older:
- No schooling: 102
- Nursery to 4th grade: 0
- 5th and 6th grade: 1
- 7th and 8th grade: 24
- 9th grade: 0
- 10th grade: 5
- 11th grade: 5
- 12th grade, no diploma: 0
- High school graduate (or equivalency): 629
- Less than 1 year of college: 273
- Some college more than 1 year, no degree: 540
- Associate degree: 328
- Bachelor's degree: 599
- Master's degree: 604
- Professional school degree: 48
- Doctorate degree: 65


Housing units in structures:
- One, detached: 986
- One, attached: 1,374
- Two: 5
- 3 or 4: 97
- 5 to 9: 445
- 10 to 19: 122
- 20 to 49: 42
- 50 or more: 22
- Mobile homes: 115
House/condo owner moved in on average 6 years ago
Renter moved in on average 1 years ago

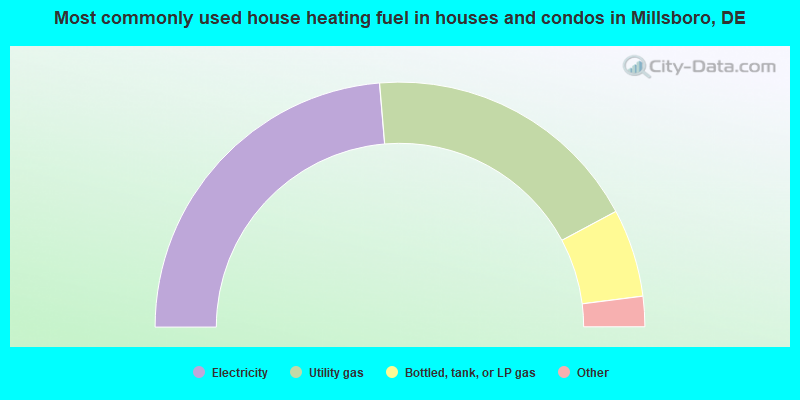
- 47.3%Electricity
- 37.0%Utility gas
- 11.6%Bottled, tank, or LP gas
- 3.0%Fuel oil, kerosene, etc.
- 1.0%Other fuel
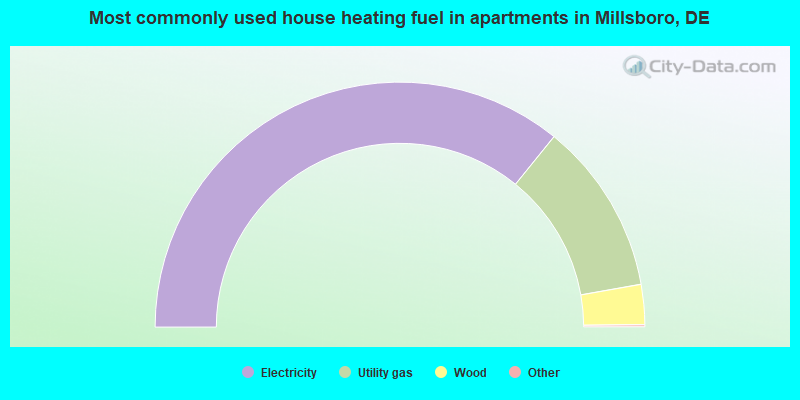
- 71.9%Electricity
- 22.8%Utility gas
- 5.3%Wood
Private vs. public school enrollment:
| Here: | 0.0% |
| Delaware: | 11.5% |
| Here: | 0.0% |
| Delaware: | 12.1% |
| Here: | 50.7% |
| Delaware: | 19.2% |


