Marine City, MI (Michigan) Houses and Residents
| Marine City: | $155,571 |
| Michigan: | $224,400 |
Total population: 4,165 (All urban)
Houses: 2,243 (1,964 occupied: 1,670 owner occupied, 369 renter occupied)
| % of renters here: | 18% |
| State: | 27% |
Housing density: 1,023 houses/condos per square mile
Median price asked for vacant for-sale houses and condos in 2022: $301,792.
Median contract rent in 2022: $770 (lower quartile is $564, upper quartile is $946)
Median rent asked for vacant for-rent units in 2022: $2,449
Median gross rent in Marine City, MI in 2022: $893
Housing units in Marine City with a mortgage: 1,082 (27 second mortgage, 0 home equity loan, 27 both second mortgage and home equity loan)
Houses without a mortgage: 110
Median household income for houses/condos with a mortgage: $67,597
Median household income for apartments without a mortgage: $63,629
Median monthly housing costs: $849
Compare current foreclosures near Marine City, MI:
| Photo | Address | Area | Beds / Baths | Price | Details |
|---|---|---|---|---|---|

|
#1
Woodworth St
Marine City, MI 48039
|
- sq. feet
|
1 baths 3 beds |
show details | |

|
#2
Westminister St
Marine City, MI 48039
|
1,041 sq. feet
|
1 baths 3 beds |
show details | |

|
#3
S Belle River Ave
Marine City, MI 48039
|
- sq. feet
|
1 baths 3 beds |
show details | |

|
#4
S Belle River Ave
Marine City, MI 48039
|
- sq. feet
|
- baths - beds |
show details | |

|
#5
S Belle River Ave # 8
Marine City, MI 48039
|
- sq. feet
|
- baths - beds |
show details | |

|
#6
Pittsburgh St
Marine City, MI 48039
|
- sq. feet
|
- baths - beds |
show details | |

|
#7
Butler St
Marine City, MI 48039
|
- sq. feet
|
- baths - beds |
show details | |

|
#8
Bruce St
Marine City, MI 48039
|
- sq. feet
|
- baths - beds |
show details | |

|
#9
Cedar St
Marine City, MI 48039
|
- sq. feet
|
- baths - beds |
show details | |

|
#10
S Belle River Ave
Marine City, MI 48039
|
- sq. feet
|
- baths - beds |
show details |
| Photo | Address | Area | Beds / Baths | Price | Details |
|---|---|---|---|---|---|

|
#11
Genaw Rd
Marine City, MI 48039
|
- sq. feet
|
- baths - beds |
show details | |

|
#12
Hale Ln # 197
New Baltimore, MI 48051
|
1,562 sq. feet
|
2 baths 2 beds |
show details | |

|
#13
Crawford Rd
Columbus, MI 48063
|
1,700 sq. feet
|
2 baths 3 beds |
show details | |

|
#14
Wadhams Rd
Smiths Creek, MI 48074
|
1,081 sq. feet
|
1 baths 3 beds |
show details | |

|
#15
Forbes St
New Baltimore, MI 48047
|
1,862 sq. feet
|
3 baths 3 beds |
show details | |

|
#16
Gratiot Ave
New Haven, MI 48048
|
1,716 sq. feet
|
1 baths 3 beds |
show details | |

|
#17
Short Cut Rd
Fair Haven, MI 48023
|
1,519 sq. feet
|
1 baths 3 beds |
show details | |

|
#18
Booth Rd
East China, MI 48054
|
1,664 sq. feet
|
2 baths 3 beds |
show details | |

|
#19
Richman Rd
Smiths Creek, MI 48074
|
1,183 sq. feet
|
1 baths 3 beds |
show details | |

|
#20
New Hampshire Ave
Marysville, MI 48040
|
- sq. feet
|
1 baths 3 beds |
show details |
| Photo | Address | Area | Beds / Baths | Price | Details |
|---|---|---|---|---|---|

|
#21
W Brockton St
New Haven, MI 48048
|
1,524 sq. feet
|
2 baths - beds |
show details | |

|
#22
Shadywood Dr
New Baltimore, MI 48047
|
1,650 sq. feet
|
2 baths 3 beds |
show details | |

|
#23
Vinecrest Ln
New Baltimore, MI 48047
|
1,686 sq. feet
|
1 baths 4 beds |
show details | |

|
#24
Bayview Dr # 92
New Baltimore, MI 48047
|
1,008 sq. feet
|
1 baths 2 beds |
show details | |

|
#25
N Park Dr
Algonac, MI 48001
|
- sq. feet
|
1 baths 3 beds |
show details | |

|
#26
Pinehurst Dr
New Baltimore, MI 48051
|
2,293 sq. feet
|
2 baths 4 beds |
show details | |

|
#27
N River Rd
Harrison Township, MI 48045
|
3,537 sq. feet
|
3 baths - beds |
show details | |

|
#28
Pembrooke Ave
New Haven, MI 48048
|
2,090 sq. feet
|
2 baths - beds |
show details | |

|
#29
Foxcrest St
New Baltimore, MI 48047
|
1,844 sq. feet
|
1 baths - beds |
show details | |

|
#30
Sugarbush Rd
New Baltimore, MI 48047
|
1,220 sq. feet
|
1 baths - beds |
show details |
| Photo | Address | Area | Beds / Baths | Price | Details |
|---|---|---|---|---|---|

|
#31
Clark St
New Haven, MI 48048
|
1,260 sq. feet
|
1 baths - beds |
show details | |

|
#32
Saint Clair Dr
New Baltimore, MI 48047
|
2,087 sq. feet
|
2 baths - beds |
show details | |

|
#33
Ravenswood Rd
Smiths Creek, MI 48074
|
1,108 sq. feet
|
1 baths - beds |
show details | |

|
#34
Marsha Ln
New Baltimore, MI 48047
|
1,350 sq. feet
|
1 baths - beds |
show details | |

|
#35
Marsha Ln
New Baltimore, MI 48047
|
1,350 sq. feet
|
1 baths - beds |
show details | |

|
#36
Circle Ln
Richmond, MI 48062
|
1,522 sq. feet
|
1 baths - beds |
show details | |

|
#37
Schnoor St
New Baltimore, MI 48047
|
1,032 sq. feet
|
1 baths - beds |
show details | |

|
#38
Ashley St
New Baltimore, MI 48047
|
990 sq. feet
|
1 baths - beds |
show details | |

|
#39
Richman Rd
Smiths Creek, MI 48074
|
1,632 sq. feet
|
1 baths - beds |
show details | |

|
#40
Ravenswood Rd
Smiths Creek, MI 48074
|
1,300 sq. feet
|
1 baths - beds |
show details |
| Photo | Address | Area | Beds / Baths | Price | Details |
|---|---|---|---|---|---|

|
#41
Barberry Cir
New Baltimore, MI 48051
|
1,192 sq. feet
|
2 baths - beds |
show details | |

|
#42
Raleigh Crescent Dr
New Baltimore, MI 48051
|
882 sq. feet
|
1 baths - beds |
show details | |

|
#43
Midfield Dr
New Haven, MI 48048
|
880 sq. feet
|
1 baths - beds |
show details | |

|
#44
Hampden Dr
New Baltimore, MI 48047
|
1,464 sq. feet
|
1 baths - beds |
show details | |

|
#45
Pickford Rd
Smiths Creek, MI 48074
|
1,420 sq. feet
|
1 baths - beds |
show details | |

|
#46
Wildwood Ln
Smiths Creek, MI 48074
|
1,344 sq. feet
|
1 baths - beds |
show details | |

|
#47
Washington St
New Baltimore, MI 48047
|
1,299 sq. feet
|
1 baths - beds |
show details | |

|
#48
Saint Clair Dr
New Baltimore, MI 48047
|
1,600 sq. feet
|
1 baths - beds |
show details | |

|
#49
Bart Ln
New Haven, MI 48048
|
- sq. feet
|
- baths - beds |
show details | |

|
Check over 1 million property listings on Foreclosure.com!
|
browse all offers | |||


 | marine city (2 replies) |
| Port Huron State of Mind (11 replies) |
| Am I dreaming, or is it possible in SE Michigan? (18 replies) |
| If you don't like Detroit..... (54 replies) |
| List of Detroit Subrubs (16 replies) |
| what can you tell me about New Haven/Lenox area (2 replies) |

Median year apartment built: 1960
Household type by relationship:
Households: 4,065- Male householders: 1,050 (413 living alone), Female householders: 896 (290 living alone)
837 spouses (824 opposite-sex spouses), 55 unmarried partners, (55 opposite-sex unmarried partners), 1,042 children (968 natural, 12 adopted, 60 stepchildren), 44 grandchildren, 16 brothers or sisters, 22 parents, 0 foster children, 9 other relatives, 87 non-relatives
Size of family households: 684 2-persons, 237 3-persons, 178 4-persons, 90 5-persons, 12 7-or-more-persons.
Size of nonfamily households: 761 1-person, 78 2-persons, 12 3-persons.
449 married couples with children.
153 single-parent households (6 men, 147 women).
99.7% of residents of Marine City speak English at home.
0.6% of residents speak Spanish at home (100% speak English very well).
Foreign born population: 46 (1.1%)
(65.2% of them are naturalized citizens)
| Here: | 6.4 |
| State: | 6.5 |
| Here: | 4.4 |
| State: | 4.3 |

- Bedrooms in owner-occupied houses and condos in Marine City, Michigan
- 0no bedroom
- 581 bedroom
- 3482 bedrooms
- 8793 bedrooms
- 3394 bedrooms
- 475+ bedrooms

- Bedrooms in renter-occupied apartments in Marine City, Michigan
- 0no bedroom
- 1311 bedroom
- 1422 bedrooms
- 963 bedrooms
- 04 bedrooms
- 05+ bedrooms

- Cars and other vehicles available in Marine City in owner-occupied houses/condos
- 18no vehicle
- 5061 vehicle
- 8642 vehicles
- 2593 vehicles
- 244 vehicles
- 05+ vehicles

- Cars and other vehicles available in Marine City in renter-occupied apartments
- 47no vehicle
- 2141 vehicle
- 982 vehicles
- 03 vehicles
- 104 vehicles
- 05+ vehicles

- Rooms in owner-occupied houses in Marine City, Michigan
- 01 room
- 02 rooms
- 1093 rooms
- 1274 rooms
- 2905 rooms
- 3446 rooms
- 4577 rooms
- 1978 rooms
- 1489+ rooms

- Rooms in renter-occupied apartments in Marine City, Michigan
- 01 room
- 292 rooms
- 733 rooms
- 904 rooms
- 715 rooms
- 696 rooms
- 267 rooms
- 08 rooms
- 109+ rooms


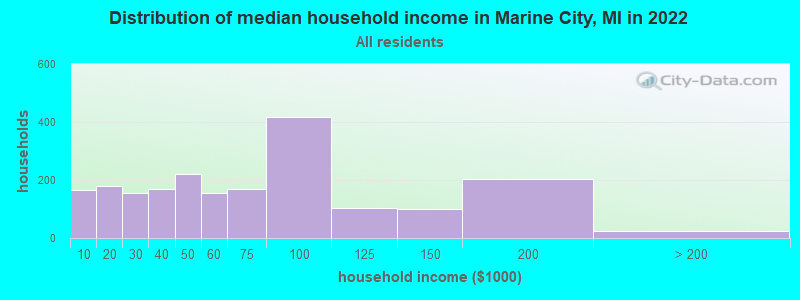
Marine City, MI household income distribution

- 165Less than $10,000
- 180$10,000 to $19,999
- 155$20,000 to $29,999
- 168$30,000 to $39,999
- 220$40,000 to $49,999
- 156$50,000 to $59,999
- 168$60,000 to $74,999
- 416$75,000 to $99,999
- 104$100,000 to $124,999
- 100$125,000 to $149,999
- 202$150,000 to $199,999
- 24$200,000 or more
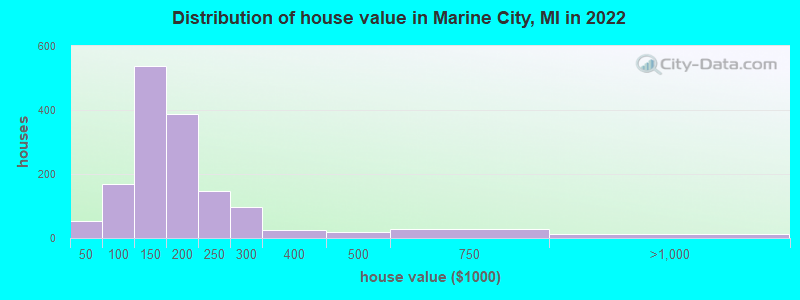
Home value of owner - occupied houses in 2022 in Marine City, MI
-
- 9$25,000 to $29,999
- 34$35,000 to $39,999
- 8$40,000 to $49,999
- 6$50,000 to $59,999
- 31$60,000 to $69,999
- 28$70,000 to $79,999
- 29$80,000 to $89,999
- 65$90,000 to $99,999
- 292$100,000 to $124,999
- 245$125,000 to $149,999
- 303$150,000 to $174,999
- 82$175,000 to $199,999
- 148$200,000 to $249,999
- 96$250,000 to $299,999
- 25$300,000 to $399,999
- 17$400,000 to $499,999
- 27$500,000 to $749,999
- 10$750,000 to $999,999
Rent paid by renters in 2022 in Marine City, MI
-
- 59$450 to $499
- 76$500 to $549
- 10$550 to $599
- 26$600 to $649
- 10$650 to $699
- 39$700 to $749
- 21$750 to $799
- 24$800 to $899
- 43$900 to $999
- 90$1,000 to $1,249


Percentage of workers working in this county: 55.9%
Number of people working at home: 109 (5.4% of all workers)
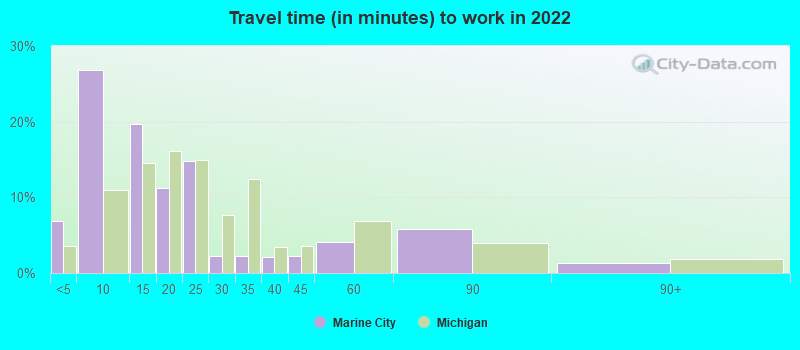
Travel time to work (commute)
- Less than 5 minutes: 133
- 5 to 9 minutes: 317
- 10 to 14 minutes: 192
- 15 to 19 minutes: 212
- 20 to 24 minutes: 58
- 25 to 29 minutes: 64
- 30 to 34 minutes: 161
- 35 to 39 minutes: 104
- 40 to 44 minutes: 19
- 45 to 59 minutes: 311
- 60 to 89 minutes: 246
- 90 or more minutes: 65
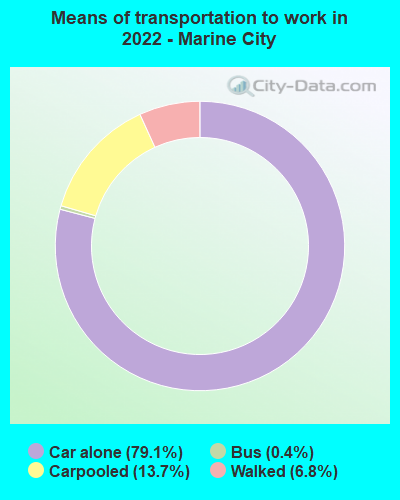
Means of transportation to work:
- Drove a car alone: 1,256 (72.3%)
- Carpooled: 220 (12.7%)
- Bus: 4 (0.2%)
- Walked: 109 (6.3%)
- Worked at home: 109 (6.3%)

- Unemployment by race in 2022
- Unemployment rate for White non-Hispanic residents
- 7.0%Males
- 5.6%Females

- Year of entry for the foreign-born population in Marine City, Michigan
- 02010 or later
- 02000 to 2009
- 41990 to 1999
- 51980 to 1989
- 01970 to 1979
- 31Before 1970

First ancestries reported:
- German: 387 (25.4%)
- Irish: 168 (11.0%)
- Polish: 163 (10.7%)
- English: 143 (9.4%)
- American: 117 (7.7%)
- Canadian: 78 (5.1%)
- French Canadian: 55 (3.6%)
- Italian: 45 (2.9%)
- Scottish: 39 (2.6%)
- Czech: 23 (1.5%)
- French: 21 (1.4%)
- Serbian: 20 (1.3%)
- European: 19 (1.2%)
- Northern European: 18 (1.2%)
- Swedish: 18 (1.2%)
- Eastern European: 17 (1.1%)
- Belgian: 15 (1.0%)
- Dutch: 14 (0.9%)
- Hungarian: 10 (0.7%)
- Croatian: 6 (0.4%)
- Scotch-Irish: 5 (0.3%)
- Lithuanian: 4 (0.3%)
Most common places of birth for foreign-born residents (%):
| Marine City: | 31.4% (16) |
| Michigan: | 10.9% (75,965) |
| Marine City: | 27.5% (14) |
| Michigan: | 0.5% (3,681) |
| Marine City: | 21.6% (11) |
| Michigan: | 2.3% (16,126) |
| Marine City: | 7.8% (4) |
| Michigan: | 5.0% (35,052) |
Place of birth for U.S.-born residents:
- This state: 3,430
- Other state: 556
- Northeast: 76
- Midwest: 199
- South: 124
- West: 150
91.4% of Marine City residents lived in the same house 1 years ago.
Out of people who lived in different houses, 39.1% lived in this county.
Out of people who lived in different counties, 100.0% lived in Michigan.
| Marine City: | 91.4% |
| State average: | 88.4% |
Education attainment for males 25 years and older:
- No schooling: 40
- Nursery to 4th grade: 0
- 5th and 6th grade: 0
- 7th and 8th grade: 23
- 9th grade: 0
- 10th grade: 69
- 11th grade: 36
- 12th grade, no diploma: 10
- High school graduate (or equivalency): 784
- Less than 1 year of college: 134
- Some college more than 1 year, no degree: 245
- Associate degree: 100
- Bachelor's degree: 60
- Master's degree: 194
- Professional school degree: 6
- Doctorate degree: 4

Education attainment for females 25 years and older:
- No schooling: 0
- Nursery to 4th grade: 0
- 5th and 6th grade: 0
- 7th and 8th grade: 37
- 9th grade: 23
- 10th grade: 13
- 11th grade: 29
- 12th grade, no diploma: 17
- High school graduate (or equivalency): 495
- Less than 1 year of college: 286
- Some college more than 1 year, no degree: 263
- Associate degree: 129
- Bachelor's degree: 120
- Master's degree: 90
- Professional school degree: 25
- Doctorate degree: 0


Housing units in structures:
- One, detached: 1,724
- One, attached: 93
- Two: 135
- 3 or 4: 107
- 5 to 9: 58
- 10 to 19: 74
- 20 to 49: 38
- Mobile homes: 11
House/condo owner moved in on average 9 years ago
Renter moved in on average 5 years ago

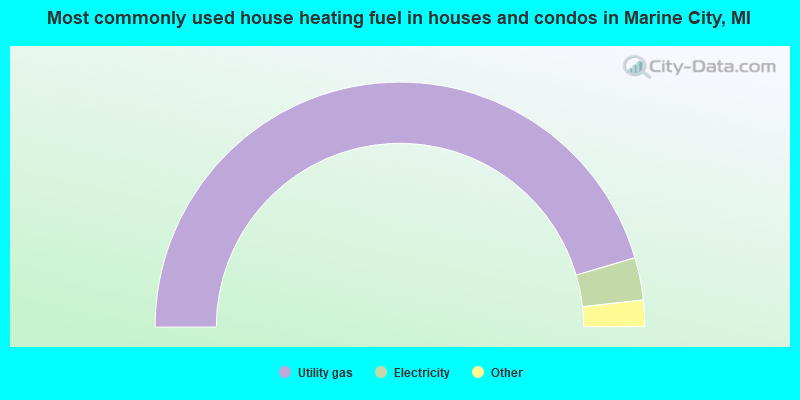
- 91.0%Utility gas
- 5.6%Electricity
- 3.0%Bottled, tank, or LP gas
- 0.4%Wood
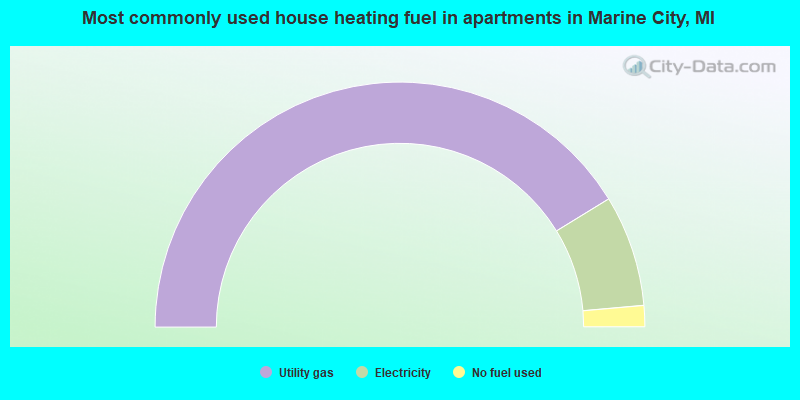
- 82.4%Utility gas
- 14.7%Electricity
- 2.8%No fuel used
Private vs. public school enrollment:
| Here: | 9.8% |
| Michigan: | 12.4% |
| Here: | 6.7% |
| Michigan: | 9.8% |
| Here: | 0.0% |
| Michigan: | 14.9% |


