Lynchburg, VA (Virginia) Houses and Residents
| Lynchburg: | $215,200 |
| Virginia: | $365,700 |
Mean price in 2022:
Detached houses: $269,492
Here: $269,492 State: $472,865 Townhouses or other attached units: $216,253
Here: $216,253 State: $457,437 In 2-unit structures: $187,111
Here: $187,111 State: $396,289 In 3-to-4-unit structures: $331,465
Here: $331,465 State: $252,346 In 5-or-more-unit structures: $208,464
Here: $208,464 State: $382,551 Mobile homes: $169,165
Here: $169,165 State: $100,736
Total population: 79,047 (Urban population: 63,295, Rural population: 1,974 (all nonfarm))
Houses: 34,201 (29,181 occupied: 13,760 owner occupied, 15,421 renter occupied)
| % of renters here: | 53% |
| State: | 33% |
Housing density: 692 houses/condos per square mile
Median price asked for vacant for-sale houses and condos in 2022: $176,106.
Median contract rent in 2022: $742 (lower quartile is $610, upper quartile is $981)
Median rent asked for vacant for-rent units in 2022: $945
Median gross rent in Lynchburg, VA in 2022: $937
Housing units in Lynchburg with a mortgage: 8,295 (988 second mortgage, 45 home equity loan, 903 both second mortgage and home equity loan)
Houses without a mortgage: 231
Median household income for houses/condos with a mortgage: $81,768
Median household income for apartments without a mortgage: $63,260
Median monthly housing costs: $914
Compare current foreclosures in Lynchburg, VA:
| Photo | Address | Area | Beds / Baths | Price | Details |
|---|---|---|---|---|---|

|
#1
Peaks View Dr
Lynchburg, VA 24501
|
2,165 sq. feet
|
3 baths 4 beds |
show details | |

|
#2
Medina Ln
Lynchburg, VA 24503
|
- sq. feet
|
2 baths 3 beds |
show details | |

|
#3
Logan Ln
Lynchburg, VA 24502
|
1,122 sq. feet
|
2 baths 2 beds |
show details | |

|
#4
Sangloe Pl
Lynchburg, VA 24502
|
1,058 sq. feet
|
2 baths 3 beds |
show details | |

|
#5
Hollins St
Lynchburg, VA 24504
|
1,176 sq. feet
|
1 baths 3 beds |
show details | |

|
#6
Old Forest Rd Unit 126
Lynchburg, VA 24501
|
1,440 sq. feet
|
2 baths 3 beds |
show details | |

|
#7
Rhonda Rd
Lynchburg, VA 24502
|
2,530 sq. feet
|
3 baths 3 beds |
show details | |

|
#8
Taylor St
Lynchburg, VA 24504
|
800 sq. feet
|
1 baths 3 beds |
show details | |

|
#9
Farley Branch Dr
Lynchburg, VA 24502
|
2,371 sq. feet
|
3 baths 5 beds |
show details | |

|
#10
Lynndale Pl
Lynchburg, VA 24502
|
1,603 sq. feet
|
1 baths 3 beds |
show details |
| Photo | Address | Area | Beds / Baths | Price | Details |
|---|---|---|---|---|---|

|
#11
Twin Oak Dr
Lynchburg, VA 24502
|
1,838 sq. feet
|
2 baths 4 beds |
show details | |

|
#12
Majestic Rd
Lynchburg, VA 24502
|
1,650 sq. feet
|
2 baths 3 beds |
show details | |

|
#13
Long Meadows Dr
Lynchburg, VA 24502
|
960 sq. feet
|
1 baths 3 beds |
show details | |

|
#14
Laxton Rd
Lynchburg, VA 24502
|
1,691 sq. feet
|
2 baths 3 beds |
show details | |

|
#15
Milford Ln
Lynchburg, VA 24501
|
2,212 sq. feet
|
3 baths 3 beds |
show details | |

|
#16
Moseley Dr
Lynchburg, VA 24502
|
1,786 sq. feet
|
2 baths 3 beds |
show details | |

|
#17
Churchill Dr
Lynchburg, VA 24502
|
1,890 sq. feet
|
2 baths 3 beds |
show details | |

|
#18
Village Rd
Lynchburg, VA 24502
|
1,615 sq. feet
|
1 baths 3 beds |
show details | |

|
#19
Rainbow Forest Dr
Lynchburg, VA 24502
|
2,569 sq. feet
|
1 baths 2 beds |
show details | |

|
#20
Parkwood Ave
Lynchburg, VA 24501
|
928 sq. feet
|
1 baths 3 beds |
show details |
| Photo | Address | Area | Beds / Baths | Price | Details |
|---|---|---|---|---|---|

|
#21
Lindsay St
Lynchburg, VA 24502
|
1,317 sq. feet
|
1 baths 2 beds |
show details | |

|
#22
Grove Rd
Lynchburg, VA 24502
|
1,486 sq. feet
|
2 baths 3 beds |
show details | |

|
#23
Hayes Dr
Lynchburg, VA 24502
|
1,582 sq. feet
|
1 baths 3 beds |
show details | |

|
#24
Sussex St
Lynchburg, VA 24501
|
1,631 sq. feet
|
1 baths 2 beds |
show details | |

|
#25
Brook St
Lynchburg, VA 24501
|
1,536 sq. feet
|
2 baths 3 beds |
show details | |

|
#26
Belvedere St # A
Lynchburg, VA 24503
|
1,884 sq. feet
|
2 baths 4 beds |
show details | |

|
#27
Long Mountain Dr
Lynchburg, VA 24504
|
1,720 sq. feet
|
2 baths 3 beds |
show details | |

|
#28
Plymouth Pl
Lynchburg, VA 24503
|
2,272 sq. feet
|
2 baths 4 beds |
show details | |

|
#29
Windsor Ave
Lynchburg, VA 24502
|
993 sq. feet
|
1 baths 2 beds |
show details | |

|
#30
Missionary Mnr
Lynchburg, VA 24501
|
1,566 sq. feet
|
2 baths 3 beds |
show details |
| Photo | Address | Area | Beds / Baths | Price | Details |
|---|---|---|---|---|---|

|
#31
19th St
Lynchburg, VA 24504
|
989 sq. feet
|
1 baths 3 beds |
show details | |

|
#32
Oakmont Cir
Lynchburg, VA 24502
|
2,180 sq. feet
|
2 baths 3 beds |
show details | |

|
#33
Wyndview Dr
Lynchburg, VA 24502
|
3,081 sq. feet
|
4 baths 3 beds |
show details | |

|
#34
Fairview Ave
Lynchburg, VA 24501
|
1,463 sq. feet
|
1 baths 2 beds |
show details | |

|
#35
Keywood Dr
Lynchburg, VA 24501
|
1,975 sq. feet
|
2 baths 3 beds |
show details | |

|
#36
Coffee Rd
Lynchburg, VA 24503
|
7,177 sq. feet
|
3 baths 6 beds |
show details | |

|
#37
Capstone Dr
Lynchburg, VA 24502
|
1,600 sq. feet
|
2 baths 3 beds |
show details | |

|
#38
Cabell St
Lynchburg, VA 24504
|
2,576 sq. feet
|
2 baths 4 beds |
show details | |

|
#39
Robin Hood Pl
Lynchburg, VA 24503
|
2,425 sq. feet
|
3 baths 4 beds |
show details | |

|
#40
Timberlake Rd Apt 116
Lynchburg, VA 24502
|
864 sq. feet
|
1 baths 2 beds |
show details |
| Photo | Address | Area | Beds / Baths | Price | Details |
|---|---|---|---|---|---|

|
#41
Northwynd Cir
Lynchburg, VA 24502
|
1,998 sq. feet
|
2 baths 4 beds |
show details | |

|
#42
College Park Dr
Lynchburg, VA 24502
|
2,155 sq. feet
|
2 baths 3 beds |
show details | |

|
#43
Laxton Rd
Lynchburg, VA 24502
|
2,024 sq. feet
|
3 baths 4 beds |
show details | |

|
#44
Dinwiddie St
Lynchburg, VA 24504
|
1,422 sq. feet
|
2 baths 4 beds |
show details | |

|
#45
Igloe Dr # B
Lynchburg, VA 24502
|
2,160 sq. feet
|
3 baths 4 beds |
show details | |

|
#46
Peninsular St
Lynchburg, VA 24501
|
1,118 sq. feet
|
1 baths 3 beds |
show details | |

|
#47
2nd St
Lynchburg, VA 24504
|
1,097 sq. feet
|
1 baths 2 beds |
show details | |

|
#48
Taylor Rd
Lynchburg, VA 24502
|
1,892 sq. feet
|
2 baths 4 beds |
show details | |

|
#49
Riverside Dr
Lynchburg, VA 24503
|
1,224 sq. feet
|
1 baths 2 beds |
show details | |

|
Check over 1 million property listings on Foreclosure.com!
|
browse all offers | |||

Latest news about housing in Lynchburg, VA collected exclusively by city-data.com from local newspapers, TV, and radio stations

 | Suburbs of Richmond or Lynchburg for Homeschool family (14 replies) |
| Roanoke/Lynchburg homeowners, how expensive are your heating costs? (11 replies) |
| Lynchburg vs. Norfolk (34 replies) |
| Rivermont area of Lynchburg real estate (2 replies) |
| Lynchburg City Public Schools (2 replies) |
| Lynchburg versus Martinsburg WV (7 replies) |

Median year apartment built: 1975
Household type by relationship:
Households: 79,287- Male householders: 13,037 (3,972 living alone), Female householders: 16,144 (5,472 living alone)
9,950 spouses (9,834 opposite-sex spouses), 1,948 unmarried partners, (1,846 opposite-sex unmarried partners), 18,503 children (17,451 natural, 670 adopted, 382 stepchildren), 832 grandchildren, 596 brothers or sisters, 855 parents, 142 foster children, 979 other relatives, 5,614 non-relatives
- In group quarters: 10,687
Size of family households: 9,128 2-persons, 3,985 3-persons, 1,619 4-persons, 569 5-persons, 337 6-persons, 726 7-or-more-persons.
Size of nonfamily households: 9,444 1-person, 1,916 2-persons, 647 3-persons, 810 4-persons.
6,963 married couples with children.
6,853 single-parent households (554 men, 6,299 women).
92.5% of residents of Lynchburg speak English at home.
2.8% of residents speak Spanish at home (67% speak English very well, 23% speak English well, 10% speak English not well).
1.5% of residents speak other Indo-European language at home (81% speak English very well, 16% speak English well, 3% speak English not well).
1.8% of residents speak Asian or Pacific Island language at home (76% speak English very well, 17% speak English well, 7% speak English not well).
1.0% of residents speak other language at home (80% speak English very well, 9% speak English well, 11% speak English not well).
Foreign born population: 2,446 (3.1%)
(40.5% of them are naturalized citizens)
| Here: | 6.8 |
| State: | 7.0 |
| Here: | 4.4 |
| State: | 4.3 |

- Bedrooms in owner-occupied houses and condos in Lynchburg, Virginia
- 99no bedroom
- 651 bedroom
- 2,0402 bedrooms
- 6,9153 bedrooms
- 3,2034 bedrooms
- 1,4385+ bedrooms

- Bedrooms in renter-occupied apartments in Lynchburg, Virginia
- 522no bedroom
- 2,6321 bedroom
- 7,6622 bedrooms
- 3,1013 bedrooms
- 1,4644 bedrooms
- 405+ bedrooms

- Cars and other vehicles available in Lynchburg in owner-occupied houses/condos
- 674no vehicle
- 4,2671 vehicle
- 5,8302 vehicles
- 2,2603 vehicles
- 5294 vehicles
- 2005+ vehicles

- Cars and other vehicles available in Lynchburg in renter-occupied apartments
- 2,856no vehicle
- 7,5151 vehicle
- 2,7802 vehicles
- 1,3003 vehicles
- 8344 vehicles
- 1365+ vehicles

- Rooms in owner-occupied houses in Lynchburg, Virginia
- 991 room
- 02 rooms
- 1833 rooms
- 9874 rooms
- 1,6905 rooms
- 3,1236 rooms
- 2,4267 rooms
- 1,8188 rooms
- 3,4349+ rooms

- Rooms in renter-occupied apartments in Lynchburg, Virginia
- 4701 room
- 7342 rooms
- 1,8803 rooms
- 5,2094 rooms
- 2,6235 rooms
- 2,5026 rooms
- 1,6087 rooms
- 1368 rooms
- 2599+ rooms


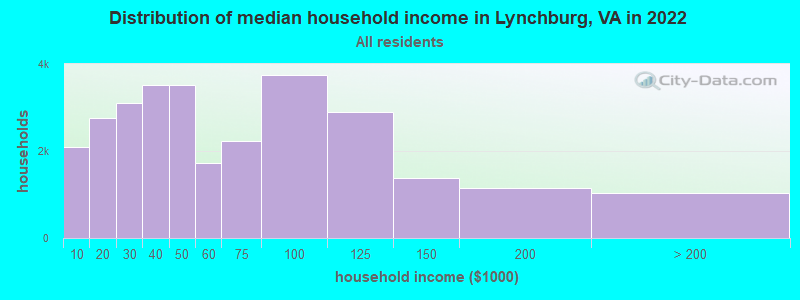
Lynchburg, VA household income distribution

- 2,102Less than $10,000
- 2,765$10,000 to $19,999
- 3,096$20,000 to $29,999
- 3,523$30,000 to $39,999
- 3,528$40,000 to $49,999
- 1,727$50,000 to $59,999
- 2,239$60,000 to $74,999
- 3,755$75,000 to $99,999
- 2,888$100,000 to $124,999
- 1,375$125,000 to $149,999
- 1,156$150,000 to $199,999
- 1,027$200,000 or more
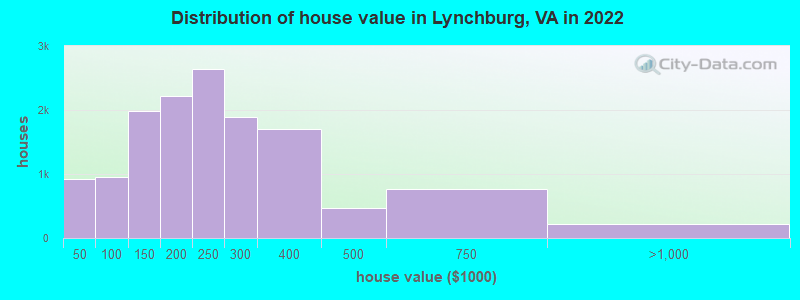
Home value of owner - occupied houses in 2022 in Lynchburg, VA
-
- 208Less than $10,000
- 121$10,000 to $14,999
- 70$15,000 to $19,999
- 134$20,000 to $24,999
- 81$25,000 to $29,999
- 309$35,000 to $39,999
- 437$50,000 to $59,999
- 69$70,000 to $79,999
- 265$80,000 to $89,999
- 181$90,000 to $99,999
- 1,021$100,000 to $124,999
- 959$125,000 to $149,999
- 814$150,000 to $174,999
- 1,405$175,000 to $199,999
- 2,643$200,000 to $249,999
- 1,885$250,000 to $299,999
- 1,696$300,000 to $399,999
- 475$400,000 to $499,999
- 770$500,000 to $749,999
- 189$750,000 to $999,999
- 28$1,000,000 to $1,499,999
Rent paid by renters in 2022 in Lynchburg, VA
-
- 69Less than $100
- 129$100 to $149
- 138$200 to $249
- 193$250 to $299
- 185$300 to $349
- 505$350 to $399
- 353$400 to $449
- 600$450 to $499
- 709$500 to $549
- 480$550 to $599
- 1,604$600 to $649
- 1,216$650 to $699
- 1,380$700 to $749
- 971$750 to $799
- 1,091$800 to $899
- 1,745$900 to $999
- 1,929$1,000 to $1,249
- 505$1,250 to $1,499
- 663$1,500 to $1,999
- 239$2,000 to $2,499
- 717No cash rent


Percentage of workers working in this county: 75.4%
Number of people working at home: 4,595 (12.6% of all workers)
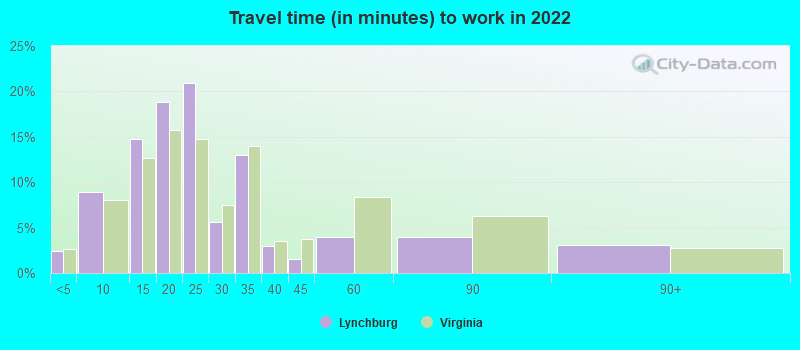
Travel time to work (commute)
- Less than 5 minutes: 1,093
- 5 to 9 minutes: 3,867
- 10 to 14 minutes: 6,844
- 15 to 19 minutes: 7,814
- 20 to 24 minutes: 4,189
- 25 to 29 minutes: 1,076
- 30 to 34 minutes: 2,125
- 35 to 39 minutes: 233
- 40 to 44 minutes: 187
- 45 to 59 minutes: 472
- 60 to 89 minutes: 665
- 90 or more minutes: 291
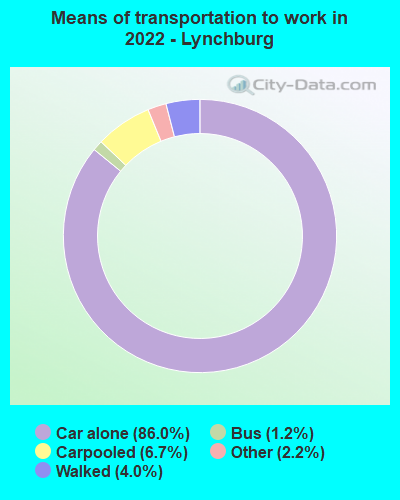
Means of transportation to work:
- Drove a car alone: 44,894 (78.9%)
- Carpooled: 3,490 (6.1%)
- Bus: 604 (1.1%)
- Taxi: 1,134 (2.0%)
- Walked: 2,063 (3.6%)
- Worked at home: 4,720 (8.3%)

- Unemployment by race in 2022
- Unemployment rate for White non-Hispanic residents
- 1.3%Males
- 1.4%Females
- Unemployment rate for Black residents
- 16.6%Males
- 13.6%Females
- Unemployment rate for Asian residents
- 1.6%Males
- 8.5%Females
- Unemployment rate for other race residents
- 3.7%Males
- Unemployment rate for two or more race residents
- 5.2%Males
- Unemployment rate for Hispanic or Latino residents
- 5.6%Males
- 0.4%Females

- Year of entry for the foreign-born population in Lynchburg, Virginia
- 1,7142010 or later
- 7492000 to 2009
- 3861990 to 1999
- 3891980 to 1989
- 1881970 to 1979
- 403Before 1970

First ancestries reported:
- American: 16,147 (37.1%)
- English: 3,536 (8.1%)
- German: 1,521 (3.5%)
- Irish: 1,391 (3.2%)
- European: 998 (2.3%)
- Italian: 758 (1.7%)
- Scottish: 605 (1.4%)
- African: 383 (0.9%)
- Scotch-Irish: 321 (0.7%)
- Nigerian: 319 (0.7%)
- Dutch: 209 (0.5%)
- Norwegian: 177 (0.4%)
- Polish: 175 (0.4%)
- British: 164 (0.4%)
- Lebanese: 110 (0.3%)
- Brazilian: 99 (0.2%)
- Kenyan: 80 (0.2%)
- Northern European: 78 (0.2%)
- French: 74 (0.2%)
- Greek: 68 (0.2%)
- Eastern European: 66 (0.2%)
- Welsh: 59 (0.1%)
- Russian: 55 (0.1%)
- Swedish: 52 (0.1%)
- Ghanaian: 49 (0.1%)
- Jamaican: 43 (0.10%)
- Czech: 42 (0.10%)
- Ukrainian: 40 (0.09%)
- Romanian: 38 (0.09%)
- Hungarian: 37 (0.09%)
- Danish: 34 (0.08%)
- Cajun: 34 (0.08%)
- Scandinavian: 33 (0.08%)
- Belgian: 29 (0.07%)
- Haitian: 27 (0.06%)
- Finnish: 24 (0.06%)
- Palestinian: 24 (0.06%)
- Canadian: 23 (0.05%)
- French Canadian: 22 (0.05%)
- Yugoslavian: 21 (0.05%)
- Ethiopian: 20 (0.05%)
- Cypriot: 18 (0.04%)
- Sudanese: 17 (0.04%)
- Austrian: 15 (0.03%)
- Swiss: 15 (0.03%)
- Pennsylvania German: 14 (0.03%)
- Portuguese: 14 (0.03%)
- Israeli: 14 (0.03%)
- Trinidadian and Tobagonian: 12 (0.03%)
- Maltese: 11 (0.03%)
- Latvian: 9 (0.02%)
- Lithuanian: 9 (0.02%)
- Iranian: 7 (0.02%)
- Croatian: 4 (0.01%)
- Arab: 4 (0.01%)
- Sierra Leonean: 4 (0.01%)
- Afghan: 3 (0.01%)
- Serbian: 3 (0.01%)
- Zimbabwean: 3 (0.01%)
- Egyptian: 3 (0.01%)
Most common places of birth for foreign-born residents (%):
| Lynchburg: | 9.3% (311) |
| Virginia: | 3.9% (42,989) |
| Lynchburg: | 9.0% (300) |
| Virginia: | 0.6% (6,956) |
| Lynchburg: | 7.3% (245) |
| Virginia: | 0.0% (315) |
| Lynchburg: | 6.4% (213) |
| Virginia: | 4.9% (52,857) |
| Lynchburg: | 5.7% (192) |
| Virginia: | 0.1% (999) |
| Lynchburg: | 4.7% (158) |
| Virginia: | 4.2% (45,750) |
| Lynchburg: | 4.4% (147) |
| Virginia: | 0.3% (3,275) |
| Lynchburg: | 4.2% (139) |
| Virginia: | 0.7% (7,672) |
| Lynchburg: | 4.1% (137) |
| Virginia: | 5.3% (57,498) |
| Lynchburg: | 3.4% (115) |
| Virginia: | 0.7% (8,081) |
| Lynchburg: | 3.3% (110) |
| Virginia: | 0.6% (7,042) |
| Lynchburg: | 3.0% (102) |
| Virginia: | 1.2% (12,984) |
| Lynchburg: | 2.8% (94) |
| Virginia: | 9.0% (97,830) |
| Lynchburg: | 2.3% (76) |
| Virginia: | 0.8% (8,186) |
| Lynchburg: | 2.2% (74) |
| Virginia: | 0.4% (4,196) |
| Lynchburg: | 2.1% (70) |
| Virginia: | 0.8% (8,513) |
| Lynchburg: | 1.9% (65) |
| Virginia: | 4.8% (52,629) |
| Lynchburg: | 1.9% (64) |
| Virginia: | 0.1% (805) |
| Lynchburg: | 1.9% (64) |
| Virginia: | 1.7% (18,227) |
| Lynchburg: | 1.8% (60) |
| Virginia: | 1.0% (10,734) |
| Lynchburg: | 1.7% (56) |
| Virginia: | 0.6% (6,458) |
| Lynchburg: | 1.6% (53) |
| Virginia: | 9.9% (107,534) |
| Lynchburg: | 1.6% (52) |
| Virginia: | 1.6% (17,346) |
Place of birth for U.S.-born residents:
- This state: 47,434
- Other state: 28,766
- Northeast: 8,798
- Midwest: 5,552
- South: 9,796
- West: 4,620
78.3% of Lynchburg residents lived in the same house 1 years ago.
Out of people who lived in different houses, 24.5% lived in this county.
Out of people who lived in different counties, 64.0% lived in Virginia.
| Lynchburg: | 78.3% |
| State average: | 86.6% |
Education attainment for males 25 years and older:
- No schooling: 232
- Nursery to 4th grade: 39
- 5th and 6th grade: 24
- 7th and 8th grade: 164
- 9th grade: 275
- 10th grade: 968
- 11th grade: 599
- 12th grade, no diploma: 167
- High school graduate (or equivalency): 3,975
- Less than 1 year of college: 828
- Some college more than 1 year, no degree: 4,440
- Associate degree: 719
- Bachelor's degree: 4,429
- Master's degree: 1,462
- Professional school degree: 666
- Doctorate degree: 584

Education attainment for females 25 years and older:
- No schooling: 145
- Nursery to 4th grade: 0
- 5th and 6th grade: 26
- 7th and 8th grade: 0
- 9th grade: 120
- 10th grade: 559
- 11th grade: 276
- 12th grade, no diploma: 575
- High school graduate (or equivalency): 5,725
- Less than 1 year of college: 1,584
- Some college more than 1 year, no degree: 3,467
- Associate degree: 2,270
- Bachelor's degree: 5,338
- Master's degree: 2,506
- Professional school degree: 509
- Doctorate degree: 287


Housing units in structures:
- One, detached: 19,737
- One, attached: 2,146
- Two: 1,357
- 3 or 4: 1,587
- 5 to 9: 1,949
- 10 to 19: 2,328
- 20 to 49: 2,416
- 50 or more: 2,338
- Mobile homes: 343
Housing units lacking complete kitchen facilities in 2022: 0.3%
House/condo owner moved in on average 12 years ago
Renter moved in on average 2 years ago

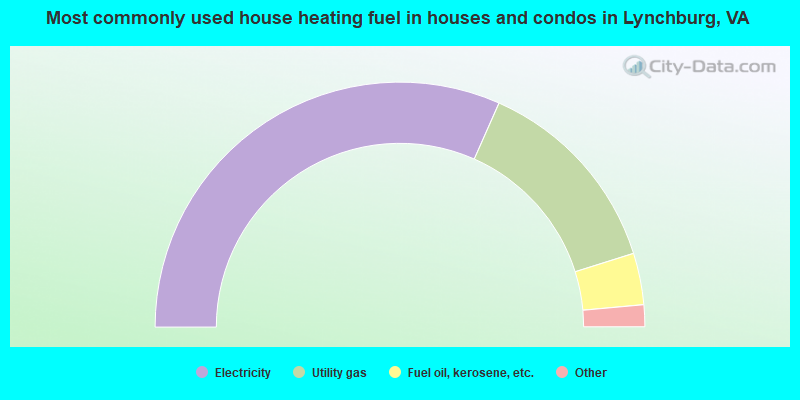
- 63.2%Electricity
- 27.0%Utility gas
- 6.8%Fuel oil, kerosene, etc.
- 1.8%Bottled, tank, or LP gas
- 0.4%Other fuel
- 0.4%No fuel used
- 0.4%Wood
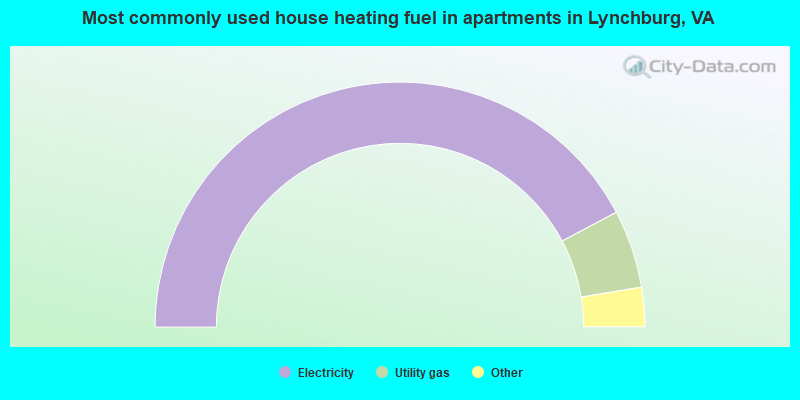
- 84.5%Electricity
- 10.3%Utility gas
- 3.1%Fuel oil, kerosene, etc.
- 1.2%Bottled, tank, or LP gas
- 0.7%No fuel used
- 0.1%Wood
Private vs. public school enrollment:
| Here: | 13.9% |
| Virginia: | 13.2% |
| Here: | 7.2% |
| Virginia: | 10.2% |
| Here: | 39.9% |
| Virginia: | 18.7% |


