Long Neck, DE (Delaware) Houses and Residents
| Long Neck: | $140,622 |
| Delaware: | $337,200 |
Mean price in 2022:
Detached houses: $188,567
Here: $188,567 State: $419,599 Townhouses or other attached units: $274,219
Here: $274,219 State: $291,415 Mobile homes: $86,909
Here: $86,909 State: $106,273
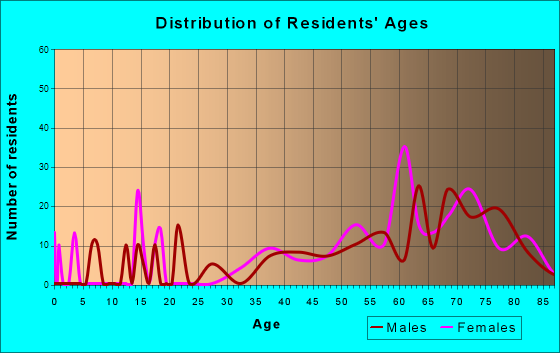
Total population: 1,980 (Urban population: 1,556 (all inside urban clusters), Rural population: 0)
Houses: 2,837 (1,667 occupied: 1,433 owner occupied, 224 renter occupied)
| % of renters here: | 14% |
| State: | 26% |
Housing density: 1,141 houses/condos per square mile
Median price asked for vacant for-sale houses and condos in 2022: $101,087.
Median contract rent in 2022: $814 (lower quartile is $721, upper quartile is $1,568)
Median gross rent in Long Neck, DE in 2022: $1,272
Housing units in Long Neck with a mortgage: 512 (14 second mortgage, 0 home equity loan, 9 both second mortgage and home equity loan)
Houses without a mortgage: 0
Median household income for houses/condos with a mortgage: $82,991
Median household income for apartments without a mortgage: $64,540
Median monthly housing costs: $1,277
Compare current foreclosures near Long Neck, DE:
| Photo | Address | Area | Beds / Baths | Price | Details |
|---|---|---|---|---|---|

|
#1
Burton St
Georgetown, DE 19947
|
1,838 sq. feet
|
2 baths 3 beds |
$213,200
|
show details |

|
#2
Gum Tree Rd
Frankford, DE 19945
|
1,312 sq. feet
|
1 baths 3 beds |
show details | |

|
#3
Dodd St
Millsboro, DE 19966
|
- sq. feet
|
3 baths 5 beds |
show details | |

|
#4
Rehoboth Avenue Ext Unit 5
Rehoboth Beach, DE 19971
|
1,797 sq. feet
|
- baths 3 beds |
show details | |

|
#5
Johnson Ln
Selbyville, DE 19975
|
1,445 sq. feet
|
- baths 3 beds |
show details | |

|
#6
Breasure Rd
Georgetown, DE 19947
|
2,624 sq. feet
|
- baths 3 beds |
show details | |

|
#7
Augusta Ct
Lewes, DE 19958
|
2,903 sq. feet
|
- baths 3 beds |
show details | |

|
#8
Sea Chase Dr
Rehoboth Beach, DE 19971
|
1,672 sq. feet
|
- baths 3 beds |
show details | |

|
#9
Lakeshore Dr
Lewes, DE 19958
|
1,774 sq. feet
|
- baths 3 beds |
show details | |

|
#10
Creek Ln
Lewes, DE 19958
|
1,707 sq. feet
|
- baths 3 beds |
show details |
| Photo | Address | Area | Beds / Baths | Price | Details |
|---|---|---|---|---|---|

|
#11
Martins Farm Rd
Milton, DE 19968
|
2,108 sq. feet
|
- baths 2 beds |
show details | |

|
#12
Kent Dr
Millsboro, DE 19966
|
1,478 sq. feet
|
- baths 3 beds |
show details | |

|
#13
Caitlins Way
Millsboro, DE 19966
|
714 sq. feet
|
- baths 2 beds |
show details | |

|
#14
Peregrine Rd
Lewes, DE 19958
|
2,576 sq. feet
|
- baths 4 beds |
show details | |

|
#15
Honolulu Rd
Frankford, DE 19945
|
1,410 sq. feet
|
- baths 3 beds |
show details | |

|
#16
Fairway Dr
Ocean View, DE 19970
|
2,694 sq. feet
|
- baths 3 beds |
show details | |

|
#17
Granville Dr
Millsboro, DE 19966
|
2,052 sq. feet
|
- baths 4 beds |
show details | |

|
#18
Glade Farm Dr
Rehoboth Beach, DE 19971
|
4,205 sq. feet
|
- baths 3 beds |
show details | |

|
#19
Ocean Pkwy
Berlin, MD 21811
|
1,188 sq. feet
|
3 baths - beds |
show details | |

|
#20
E Light Dr
Lewes, DE 19958
|
2,390 sq. feet
|
- baths 3 beds |
show details |
| Photo | Address | Area | Beds / Baths | Price | Details |
|---|---|---|---|---|---|

|
#21
Jays Way
Milton, DE 19968
|
2,008 sq. feet
|
- baths 3 beds |
show details | |

|
#22
Lakeside Dr
Lewes, DE 19958
|
1,660 sq. feet
|
- baths 3 beds |
show details | |

|
#23
Love Creek Dr
Lewes, DE 19958
|
1,596 sq. feet
|
- baths 3 beds |
show details | |

|
#24
Anser Ln
Lewes, DE 19958
|
2,432 sq. feet
|
- baths 3 beds |
show details | |

|
#25
Johnson Rd
Laurel, DE 19956
|
1,344 sq. feet
|
- baths 3 beds |
show details | |

|
#26
Timbercreek Ln
Millsboro, DE 19966
|
2,224 sq. feet
|
- baths 3 beds |
show details | |

|
#27
Hollyville Rd
Millsboro, DE 19966
|
1,792 sq. feet
|
- baths 3 beds |
show details | |

|
#28
Cromwell Dr
Ocean View, DE 19970
|
1,570 sq. feet
|
- baths 2 beds |
show details | |

|
#29
Sandy Ridge Dr
Lewes, DE 19958
|
3,416 sq. feet
|
- baths 5 beds |
show details | |

|
#30
Lighthouse Rd
Selbyville, DE 19975
|
1,074 sq. feet
|
- baths - beds |
show details |
| Photo | Address | Area | Beds / Baths | Price | Details |
|---|---|---|---|---|---|

|
#31
Holly Ln
Ocean View, DE 19970
|
1,474 sq. feet
|
- baths - beds |
show details | |

|
#32
Madaket Ct
Rehoboth Beach, DE 19971
|
1,388 sq. feet
|
- baths 3 beds |
show details | |

|
#33
Avalon Rd
Georgetown, DE 19947
|
720 sq. feet
|
- baths - beds |
show details | |

|
#34
Jersey Rd
Millsboro, DE 19966
|
1,344 sq. feet
|
- baths 2 beds |
show details | |

|
#35
W Barrier Reef Blvd
Lewes, DE 19958
|
1,502 sq. feet
|
- baths 3 beds |
show details | |

|
#36
Cygnet Dr
Selbyville, DE 19975
|
2,560 sq. feet
|
- baths 3 beds |
show details | |

|
#37
Godwin School Rd
Millsboro, DE 19966
|
2,536 sq. feet
|
- baths 3 beds |
show details | |

|
#38
Highlands Way
Lewes, DE 19958
|
1,764 sq. feet
|
- baths 3 beds |
show details | |

|
#39
Betts Ave
Ocean View, DE 19970
|
2,886 sq. feet
|
- baths 3 beds |
show details | |

|
#40
Cool Spring Rd
Milton, DE 19968
|
2,288 sq. feet
|
- baths 3 beds |
show details |
| Photo | Address | Area | Beds / Baths | Price | Details |
|---|---|---|---|---|---|

|
#41
Bethesda Rd
Millsboro, DE 19966
|
1,248 sq. feet
|
- baths 3 beds |
show details | |

|
#42
Gravel Hill Rd
Millsboro, DE 19966
|
1,432 sq. feet
|
- baths 2 beds |
show details | |

|
#43
Radcliffe Dr
Rehoboth Beach, DE 19971
|
1,248 sq. feet
|
- baths 3 beds |
show details | |

|
#44
Sandridge Ct
Millsboro, DE 19966
|
2,173 sq. feet
|
- baths 3 beds |
show details | |

|
#45
Grace St
Millsboro, DE 19966
|
2,255 sq. feet
|
- baths 3 beds |
show details | |

|
#46
Clayton Ave
Frankford, DE 19945
|
2,222 sq. feet
|
- baths - beds |
show details | |

|
#47
Kendall St
Millsboro, DE 19966
|
1,008 sq. feet
|
- baths 3 beds |
show details | |

|
#48
Alyssa Dr
Dagsboro, DE 19939
|
1,614 sq. feet
|
- baths 3 beds |
show details | |

|
#49
Pine Grove Ln
Ocean View, DE 19970
|
2,747 sq. feet
|
- baths 3 beds |
show details | |

|
Check over 1 million property listings on Foreclosure.com!
|
browse all offers | |||


 | Headed back to check out yearly rental homes in Sussex...Questions about Condo Communities (10 replies) |
| Revisiting Baywood (28 replies) |
| weekly renters (16 replies) |
| Ashburn Homes (2 replies) |
| Crime increase in Long Neck area (22 replies) |
| developments in Lewes/Rehoboth Beach with Fishing piers (27 replies) |
Median year apartment built: 2008
Household type by relationship:
Households: 3,172- Male householders: 692 (126 living alone), Female householders: 986 (542 living alone)
886 spouses (880 opposite-sex spouses), 6 unmarried partners, (6 opposite-sex unmarried partners), 348 children (304 natural, 44 adopted, 0 stepchildren), 27 grandchildren, 20 brothers or sisters, 48 parents, 0 foster children, 0 other relatives, 154 non-relatives
Size of family households: 779 2-persons, 136 3-persons, 22 4-persons, 29 5-persons, 49 6-persons.
Size of nonfamily households: 622 1-person, 29 2-persons.
226 married couples with children.
39 single-parent households (39 men, 0 women).
98.6% of residents of Long Neck speak English at home.
2.0% of residents speak Spanish at home (100% speak English very well).
1.0% of residents speak other Indo-European language at home (55% speak English very well, 45% don't speak English at all).
0.2% of residents speak Asian or Pacific Island language at home (100% speak English well).
Foreign born population: 69 (2.2%)
(85.5% of them are naturalized citizens)
| Here: | 6.2 |
| State: | 6.9 |
| Here: | 4.8 |
| State: | 4.4 |

- Bedrooms in owner-occupied houses and condos in Long Neck, Delaware
- 0no bedroom
- 61 bedroom
- 1552 bedrooms
- 1,0383 bedrooms
- 1974 bedrooms
- 365+ bedrooms

- Bedrooms in renter-occupied apartments in Long Neck, Delaware
- 0no bedroom
- 01 bedroom
- 1172 bedrooms
- 593 bedrooms
- 494 bedrooms
- 05+ bedrooms

- Cars and other vehicles available in Long Neck in owner-occupied houses/condos
- 15no vehicle
- 6691 vehicle
- 6172 vehicles
- 813 vehicles
- 454 vehicles
- 65+ vehicles

- Cars and other vehicles available in Long Neck in renter-occupied apartments
- 28no vehicle
- 1301 vehicle
- 172 vehicles
- 493 vehicles
- 04 vehicles
- 05+ vehicles

- Rooms in owner-occupied houses in Long Neck, Delaware
- 01 room
- 02 rooms
- 63 rooms
- 1314 rooms
- 3675 rooms
- 3046 rooms
- 2827 rooms
- 1638 rooms
- 1789+ rooms

- Rooms in renter-occupied apartments in Long Neck, Delaware
- 01 room
- 02 rooms
- 73 rooms
- 894 rooms
- 725 rooms
- 496 rooms
- 07 rooms
- 08 rooms
- 69+ rooms


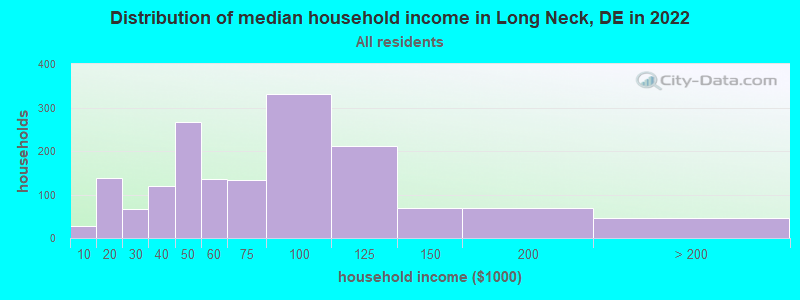
Long Neck, DE household income distribution

- 28Less than $10,000
- 138$10,000 to $19,999
- 66$20,000 to $29,999
- 120$30,000 to $39,999
- 266$40,000 to $49,999
- 136$50,000 to $59,999
- 133$60,000 to $74,999
- 331$75,000 to $99,999
- 211$100,000 to $124,999
- 68$125,000 to $149,999
- 70$150,000 to $199,999
- 45$200,000 or more
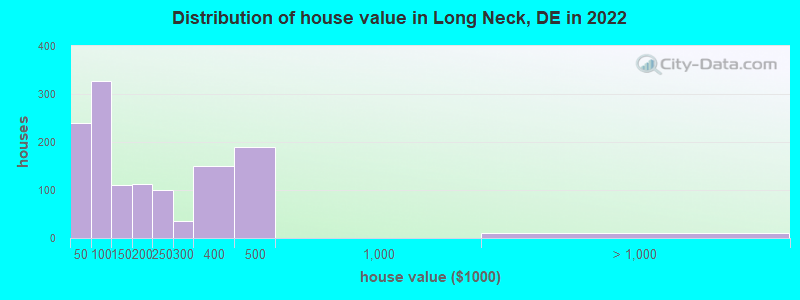
Home value of owner - occupied houses in 2022 in Long Neck, DE
-
- 25Less than $10,000
- 16$10,000 to $14,999
- 25$15,000 to $19,999
- 17$20,000 to $24,999
- 38$25,000 to $29,999
- 14$30,000 to $34,999
- 49$35,000 to $39,999
- 52$40,000 to $49,999
- 28$50,000 to $59,999
- 50$60,000 to $69,999
- 30$70,000 to $79,999
- 105$80,000 to $89,999
- 60$90,000 to $99,999
- 92$100,000 to $124,999
- 18$125,000 to $149,999
- 68$150,000 to $174,999
- 44$175,000 to $199,999
- 99$200,000 to $249,999
- 34$250,000 to $299,999
- 151$300,000 to $399,999
- 188$400,000 to $499,999
- 11$2,000,000 or more
Rent paid by renters in 2022 in Long Neck, DE
-
- 3$550 to $599
- 55$700 to $749
- 19$800 to $899
- 13$900 to $999
- 8$1,000 to $1,249
- 5$1,250 to $1,499
- 56$1,500 to $1,999
- 26No cash rent


Percentage of workers working in this county: 86.5%
Number of people working at home: 174 (12.6% of all workers)
Travel time to work (commute)
- Less than 5 minutes: 26
- 5 to 9 minutes: 136
- 10 to 14 minutes: 72
- 15 to 19 minutes: 128
- 20 to 24 minutes: 114
- 25 to 29 minutes: 62
- 30 to 34 minutes: 164
- 35 to 39 minutes: 0
- 40 to 44 minutes: 90
- 45 to 59 minutes: 162
- 60 to 89 minutes: 59
- 90 or more minutes: 132
Means of transportation to work:
- Drove a car alone: 467 (86.5%)
- Carpooled: 62 (11.5%)
- Bus or trolley bus: 11 (2.0%)

- Unemployment by race in 2022
- Unemployment rate for White non-Hispanic residents
- 10.9%Males
- 1.3%Females
- Unemployment rate for other race residents
- 70.7%Males
- Unemployment rate for Hispanic or Latino residents
- 73.6%Males

- Year of entry for the foreign-born population in Long Neck, Delaware
- 122010 or later
- 222000 to 2009
- 151990 to 1999
- 01980 to 1989
- 81970 to 1979
- 11Before 1970

First ancestries reported:
- Italian: 317 (25.4%)
- German: 230 (18.5%)
- Irish: 199 (16.0%)
- English: 134 (10.8%)
- Dutch: 62 (5.0%)
- Polish: 58 (4.7%)
- American: 56 (4.5%)
- Scotch-Irish: 13 (1.0%)
- Swiss: 12 (1.0%)
- Turkish: 7 (0.6%)
- Lebanese: 6 (0.5%)
- Scottish: 6 (0.5%)
- Welsh: 5 (0.4%)
- Slovak: 4 (0.3%)
- European: 3 (0.2%)
Most common places of birth for foreign-born residents (%):
| Long Neck: | 55.2% (37) |
| Delaware: | 5.7% (5,583) |
| Long Neck: | 16.4% (11) |
| Delaware: | 0.1% (81) |
| Long Neck: | 11.9% (8) |
| Delaware: | 1.1% (1,038) |
| Long Neck: | 10.4% (7) |
| Delaware: | 1.1% (1,064) |
Place of birth for U.S.-born residents:
- This state: 618
- Other state: 2,572
- Northeast: 1,613
- Midwest: 34
- South: 927
- West: 0
85.4% of Long Neck residents lived in the same house 1 years ago.
Out of people who lived in different houses, 27.3% lived in this county.
Out of people who lived in different counties, 58.2% lived in Delaware.
| Long Neck: | 85.4% |
| State average: | 89.2% |
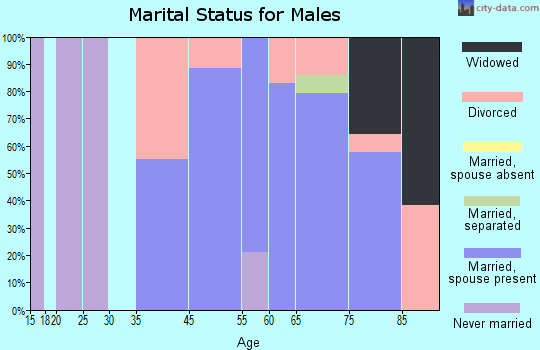
Education attainment for males 25 years and older:
- No schooling: 0
- Nursery to 4th grade: 0
- 5th and 6th grade: 0
- 7th and 8th grade: 0
- 9th grade: 0
- 10th grade: 0
- 11th grade: 5
- 12th grade, no diploma: 14
- High school graduate (or equivalency): 538
- Less than 1 year of college: 119
- Some college more than 1 year, no degree: 148
- Associate degree: 199
- Bachelor's degree: 73
- Master's degree: 7
- Professional school degree: 0
- Doctorate degree: 15

Education attainment for females 25 years and older:
- No schooling: 5
- Nursery to 4th grade: 0
- 5th and 6th grade: 0
- 7th and 8th grade: 0
- 9th grade: 7
- 10th grade: 8
- 11th grade: 0
- 12th grade, no diploma: 30
- High school graduate (or equivalency): 560
- Less than 1 year of college: 123
- Some college more than 1 year, no degree: 251
- Associate degree: 171
- Bachelor's degree: 280
- Master's degree: 161
- Professional school degree: 0
- Doctorate degree: 0

Housing units in structures:
- One, detached: 705
- One, attached: 104
- 3 or 4: 14
- 5 to 9: 4
- 10 to 19: 95
- Mobile homes: 1,913
Median worth of mobile homes: $101,021
House/condo owner moved in on average 7 years ago
Renter moved in on average 2 years ago

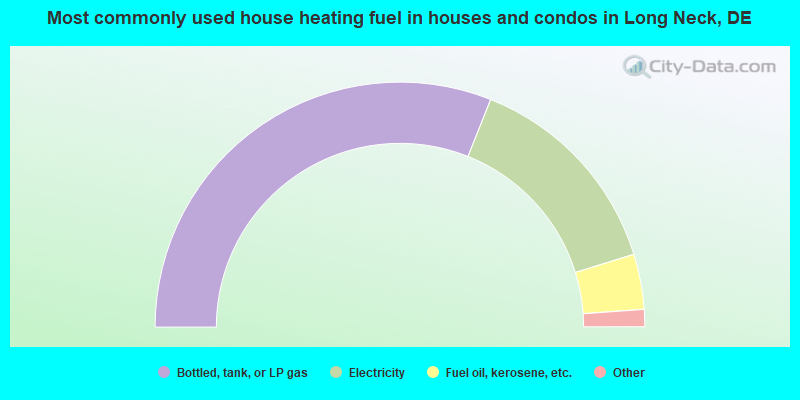
- 62.2%Bottled, tank, or LP gas
- 28.4%Electricity
- 7.3%Fuel oil, kerosene, etc.
- 1.5%Utility gas
- 0.7%Other fuel
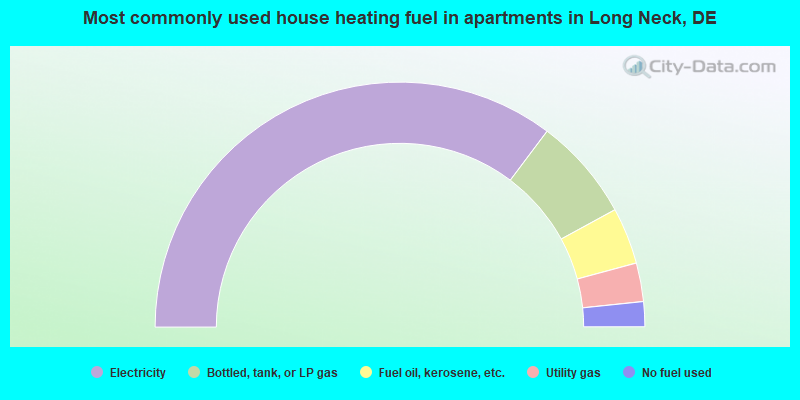
- 70.6%Electricity
- 13.6%Bottled, tank, or LP gas
- 7.5%Fuel oil, kerosene, etc.
- 5.1%Utility gas
- 3.3%No fuel used
Private vs. public school enrollment:
| Here: | 11.6% |
| Delaware: | 11.5% |
| Here: | 31.0% |
| Delaware: | 12.1% |
| Here: | 56.8% |
| Delaware: | 19.2% |


