Lochearn, MD (Maryland) Houses and Residents
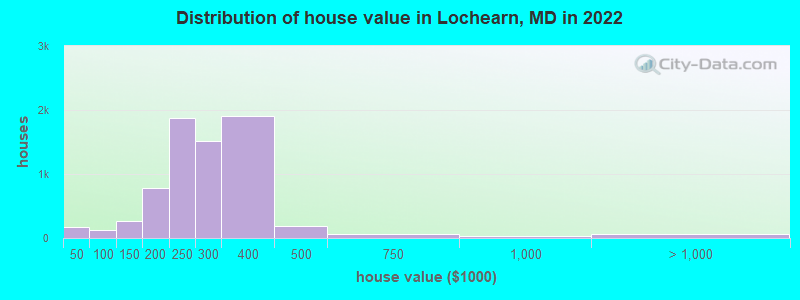
Estimated median house or condo value in 2022: $268,728 (it was $104,100 in 2000 )
Lochearn:
$268,728Maryland:
$398,100
Lower value quartile - upper value quartile: $215,524 - $321,319Mean price in 2022: Detached houses: $308,825 Here:
$308,825State:
$526,819
Townhouses or other attached units: $308,690 Here:
$308,690State:
$328,305
In 5-or-more-unit structures: $283,154 Here:
$283,154State:
$350,378
Total population: 25,333 (Urban population: 25,290, Rural population: 0)
Houses: 10,899 (10,352 occupied: 7,150 owner occupied, 3,432 renter occupied )
% of renters here:
32%State:
32%
Housing density: 1,957 houses/condos per square mile
Median price asked for vacant for-sale houses and condos in 2022: $100,972.
Median contract rent in 2022: $1,179 (lower quartile is $1,028, upper quartile is $1,338)
Median rent asked for vacant for-rent units in 2022: $1,112
Median gross rent in Lochearn, MD in 2022: $1,354
Housing units in Lochearn with a mortgage: 5,171 (601 second mortgage, 5 home equity loan, 516 both second mortgage and home equity loan )Houses without a mortgage: 158
Median household income for houses/condos with a mortgage: $98,485
Median household income for apartments without a mortgage: $64,640
Median monthly housing costs: $1,367
Data:
Median house or condo value ($)
Median house or condo value ($ change since 2000)
Median house or condo value ($) - White
Median house or condo value ($) - Black or African American
Median house or condo value ($) - Asian
Median house or condo value ($) - Hispanic or Latino
Median house or condo value ($) - American Indian and Alaska Native
Median house or condo value ($) - Multirace
Median house or condo value ($) - Other Race
Median price asked for mobile homes ($)
Household density (households per square mile)
Mean house or condo value by units in structure - 1, detached ($)
Mean house or condo value by units in structure - 1, attached ($)
Mean house or condo value by units in structure - 2 ($)
Mean house or condo value by units in structure by units in structure - 3 or 4 ($)
Mean house or condo value by units in structure - 5 or more ($)
Mean house or condo value by units in structure - Boat, RV, van, etc. ($)
Mean house or condo value by units in structure - Mobile home ($)
Median contract rent ($)
Median contract rent - Lower quartile ($)
Median contract rent - Upper quartile ($)
Median gross rent ($)
Urban houses (%)
Rural houses (%)
Houses occupied (%)
Houses occupied (% change since 2000)
Houses owner occupied (%)
Houses owner occupied (% change since 2000)
Houses renter occupied (%)
Houses renter occupied (% change since 2000)
Vacant housing units - For rent (%)
Vacant housing units - For rent (% change since 2000)
Vacant housing units - For sale only (%)
Vacant housing units - For sale only (% change since 2000)
Vacant housing units - Rented or sold, not occupied (%)
Vacant housing units - Rented or sold, not occupied (% change since 2000)
Vacant housing units - For seasonal, recreational, or occasional use (%)
Vacant housing units - For seasonal, recreational, or occasional use (% change since 2000)
Vacant housing units - For migrant workers (%)
Vacant housing units - For migrant workers (% change since 2000)
Vacant housing units - Other vacant (%)
Vacant housing units - Other vacant (% change since 2000)
Median monthly housing costs ($)
Median household income for houses/condos with a mortgage ($)
Median household income for houses/condos without a mortgage ($)
Median household income ($)
Median household income ($) - White
Median household income ($) - Black or African American
Median household income ($) - Asian
Median household income ($) - Hispanic or Latino
Median household income ($) - American Indian and Alaska Native
Median household income ($) - Multirace
Median household income ($) - Other Race
Mortgage status - with mortgage (%)
Mortgage status - with second mortgage (%)
Mortgage status - with home equity loan (%)
Mortgage status - with both second mortgage and home equity loan (%)
Mortgage status - without a mortgage (%)
Median year house/condo built
Median year apartment built
Household type by relationship - Male householder living alone (%)
Household type by relationship - Male householder not living alone (%)
Household type by relationship - Female householder living alone (%)
Household type by relationship - Female householder not living alone (%)
Household type by relationship - Opposite-Sex spouse (%)
Household type by relationship - Same-Sex spouse (%)
Household type by relationship - Opposite-Sex unmarried partner (%)
Household type by relationship - Same-Sex unmarried partner (%)
Household type by relationship - In group quarters (%)
Size of family households - 2-person household (%)
Size of family households - 3-person household (%)
Size of family households - 4-person household (%)
Size of family households - 5-person household (%)
Size of family households - 6-person household (%)
Size of family households - 7-or-more-person household (%)
Size of nonfamily households - 1-person household (%)
Size of nonfamily households - 2-person household (%)
Size of nonfamily households - 3-person household (%)
Size of nonfamily households - 4-person household (%)
Size of nonfamily households - 5-person household (%)
Size of nonfamily households - 6-person household (%)
Size of nonfamily households - 7-or-moreperson household (%)
Year house built - Built 2010 or later (%)
Year house built - Built 2000 to 2009 (%)
Year house built - Built 1990 to 1999 (%)
Year house built - Built 1980 to 1989 (%)
Year house built - Built 1970 to 1979 (%)
Year house built - Built 1960 to 1969 (%)
Year house built - Built 1950 to 1959 (%)
Year house built - Built 1940 to 1949 (%)
Year house built - Built 1939 or earlier (%)
Median number of rooms in houses and condos
Median number of rooms in apartments
Median number of bedrooms in owner occupied houses
Mean number of bedrooms in owner occupied houses
Median number of bedrooms in renter occupied houses
Mean number of bedrooms in renter occupied houses
Median number of vehichles in owner occupied houses
Mean number of vehichles in owner occupied houses
Median number of vehichles in renter occupied houses
Mean number of vehichles in renter occupied houses
Rooms in owner-occupied houses - 1 room (%)
Rooms in owner-occupied houses - 2 rooms (%)
Rooms in owner-occupied houses - 3 rooms (%)
Rooms in owner-occupied houses - 4 rooms (%)
Rooms in owner-occupied houses - 5 rooms (%)
Rooms in owner-occupied houses - 6 rooms (%)
Rooms in owner-occupied houses - 7 rooms (%)
Rooms in owner-occupied houses - 8 rooms (%)
Rooms in owner-occupied houses - 9+ rooms (%)
Rooms in renter-occupied houses - 1 room (%)
Rooms in renter-occupied houses - 2 rooms (%)
Rooms in renter-occupied houses - 3 rooms (%)
Rooms in renter-occupied houses - 4 rooms (%)
Rooms in renter-occupied houses - 5 rooms (%)
Rooms in renter-occupied houses - 6 rooms (%)
Rooms in renter-occupied houses - 7 rooms (%)
Rooms in renter-occupied houses - 8 rooms (%)
Rooms in renter-occupied houses - 9+ rooms (%)
Bedrooms in owner-occupied houses - no bedrooms (%)
Bedrooms in owner-occupied houses - 1 bedroom (%)
Bedrooms in owner-occupied houses - 2 bedrooms (%)
Bedrooms in owner-occupied houses - 3 bedrooms (%)
Bedrooms in owner-occupied houses - 4 bedrooms (%)
Bedrooms in owner-occupied houses - 5+ bedrooms (%)
Bedrooms in renter-occupied houses - no bedrooms (%)
Bedrooms in renter-occupied houses - 1 bedroom (%)
Bedrooms in renter-occupied houses - 2 bedrooms (%)
Bedrooms in renter-occupied houses - 3 bedrooms (%)
Bedrooms in renter-occupied houses - 4 bedrooms (%)
Bedrooms in renter-occupied houses - 5+ bedrooms (%)
Vehicles available in owner-occupied houses - no vehicle available (%)
Vehicles available in owner-occupied houses - 1 vehicle available(%)
Vehicles available in owner-occupied houses - 2 Vehicles available (%)
Vehicles available in owner-occupied houses - 3 Vehicles available (%)
Vehicles available in owner-occupied houses - 4 Vehicles available (%)
Vehicles available in owner-occupied houses - 5+ Vehicles available (%)
Vehicles available in renter-occupied houses - no vehicle available (%)
Vehicles available in renter-occupied houses - 1 vehicle available (%)
Vehicles available in renter-occupied houses - 2 Vehicles available (%)
Vehicles available in renter-occupied houses - 3 Vehicles available (%)
Vehicles available in renter-occupied houses - 4 Vehicles available (%)
Vehicles available in renter-occupied houses - 5+ Vehicles available (%)
Housing units in structures - 1, detached (%)
Housing units in structures - 1, attached (%)
Housing units in structures - 2 (%)
Housing units in structures - 3 or 4 (%)
Housing units in structures - 5 to 9 (%)
Housing units in structures - 10 to 19 (%)
Housing units in structures - 20 to 49 (%)
Housing units in structures - 50 or more (%)
Housing units in structures - Mobile home (%)
Housing units in structures - Boat, RV, van, etc. (%)
Housing units in structures - Owners - 1, detached (%)
Housing units in structures - Owners - 1, attached (%)
Housing units in structures - Owners - 2 (%)
Housing units in structures - Owners - 3 or 4 (%)
Housing units in structures - Owners - 5 to 9 (%)
Housing units in structures - Owners - 10 to 19 (%)
Housing units in structures - Owners - 20 to 49 (%)
Housing units in structures - Owners - 50 or more (%)
Housing units in structures - Owners - Mobile home (%)
Housing units in structures - Owners - Boat, RV, van, etc. (%)
Housing units in structures - Renters - 1, detached (%)
Housing units in structures - Renters - 1, attached (%)
Housing units in structures - Renters - 2 (%)
Housing units in structures - Renters - 3 or 4 (%)
Housing units in structures - Renters - 5 to 9 (%)
Housing units in structures - Renters - 10 to 19 (%)
Housing units in structures - Renters - 20 to 49 (%)
Housing units in structures - Renters - 50 or more (%)
Housing units in structures - Renters - Mobile home (%)
Housing units in structures - Renters - Boat, RV, van, etc. (%)
House/condo owner moved in on average (years ago)
Renter moved in on average (years ago)
Year householder moved into unit - Moved in 1999 to March 2000 (%)
Year householder moved into unit - Moved in 1999 to March 2000 (%) - White
Year householder moved into unit - Moved in 1999 to March 2000 (%) - Black or African American
Year householder moved into unit - Moved in 1999 to March 2000 (%) - Asian
Year householder moved into unit - Moved in 1999 to March 2000 (%) - Hispanic or Latino
Year householder moved into unit - Moved in 1999 to March 2000 (%) - American Indian and Alaska Native
Year householder moved into unit - Moved in 1999 to March 2000 (%) - Multirace
Year householder moved into unit - Moved in 1999 to March 2000 (%) - Other Race
Year householder moved into unit - Moved in 1995 to 1998 (%)
Year householder moved into unit - Moved in 1995 to 1998 (%) - White
Year householder moved into unit - Moved in 1995 to 1998 (%) - Black or African American
Year householder moved into unit - Moved in 1995 to 1998 (%) - Asian
Year householder moved into unit - Moved in 1995 to 1998 (%) - Hispanic or Latino
Year householder moved into unit - Moved in 1995 to 1998 (%) - American Indian and Alaska Native
Year householder moved into unit - Moved in 1995 to 1998 (%) - Multirace
Year householder moved into unit - Moved in 1995 to 1998 (%) - Other Race
Year householder moved into unit - Moved in 1990 to 1994 (%)
Year householder moved into unit - Moved in 1990 to 1994 (%) - White
Year householder moved into unit - Moved in 1990 to 1994 (%) - Black or African American
Year householder moved into unit - Moved in 1990 to 1994 (%) - Asian
Year householder moved into unit - Moved in 1990 to 1994 (%) - Hispanic or Latino
Year householder moved into unit - Moved in 1990 to 1994 (%) - American Indian and Alaska Native
Year householder moved into unit - Moved in 1990 to 1994 (%) - Multirace
Year householder moved into unit - Moved in 1990 to 1994 (%) - Other Race
Year householder moved into unit - Moved in 1980 to 1989 (%)
Year householder moved into unit - Moved in 1980 to 1989 (%) - White
Year householder moved into unit - Moved in 1980 to 1989 (%) - Black or African American
Year householder moved into unit - Moved in 1980 to 1989 (%) - Asian
Year householder moved into unit - Moved in 1980 to 1989 (%) - Hispanic or Latino
Year householder moved into unit - Moved in 1980 to 1989 (%) - American Indian and Alaska Native
Year householder moved into unit - Moved in 1980 to 1989 (%) - Multirace
Year householder moved into unit - Moved in 1980 to 1989 (%) - Other Race
Year householder moved into unit - Moved in 1970 to 1979 (%)
Year householder moved into unit - Moved in 1970 to 1979 (%) - White
Year householder moved into unit - Moved in 1970 to 1979 (%) - Black or African American
Year householder moved into unit - Moved in 1970 to 1979 (%) - Asian
Year householder moved into unit - Moved in 1970 to 1979 (%) - Hispanic or Latino
Year householder moved into unit - Moved in 1970 to 1979 (%) - American Indian and Alaska Native
Year householder moved into unit - Moved in 1970 to 1979 (%) - Multirace
Year householder moved into unit - Moved in 1970 to 1979 (%) - Other Race
Year householder moved into unit - Moved in 1969 or earlier (%)
Year householder moved into unit - Moved in 1969 or earlier (%) - White
Year householder moved into unit - Moved in 1969 or earlier (%) - Black or African American
Year householder moved into unit - Moved in 1969 or earlier (%) - Asian
Year householder moved into unit - Moved in 1969 or earlier (%) - Hispanic or Latino
Year householder moved into unit - Moved in 1969 or earlier (%) - American Indian and Alaska Native
Year householder moved into unit - Moved in 1969 or earlier (%) - Multirace
Year householder moved into unit - Moved in 1969 or earlier (%) - Other Race
Housing units lacking complete plumbing facilities (%)
Housing units lacking complete kitchen facilities (%)
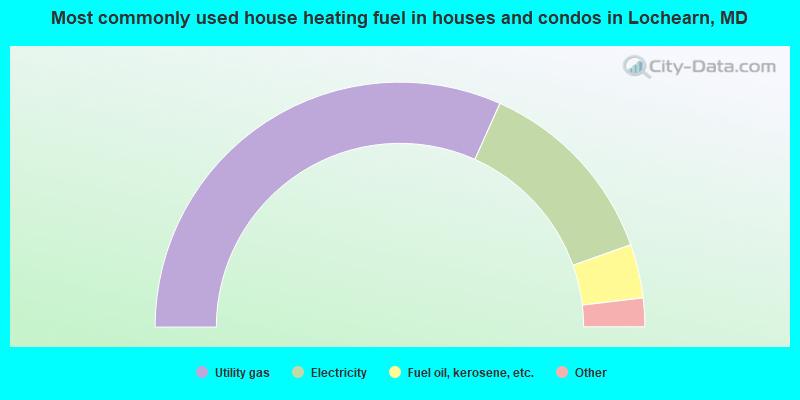
House heating fuel used in houses and condos - Utility gas (%)
House heating fuel used in houses and condos - Bottled, tank, or LP gas (%)
House heating fuel used in houses and condos - Electricity (%)
House heating fuel used in houses and condos - Fuel oil, kerosene, etc. (%)
House heating fuel used in houses and condos - Coal or coke (%)
House heating fuel used in houses and condos - Wood (%)
House heating fuel used in houses and condos - Solar energy (%)
House heating fuel used in houses and condos - Other fuel (%)
House heating fuel used in houses and condos - No fuel used (%)
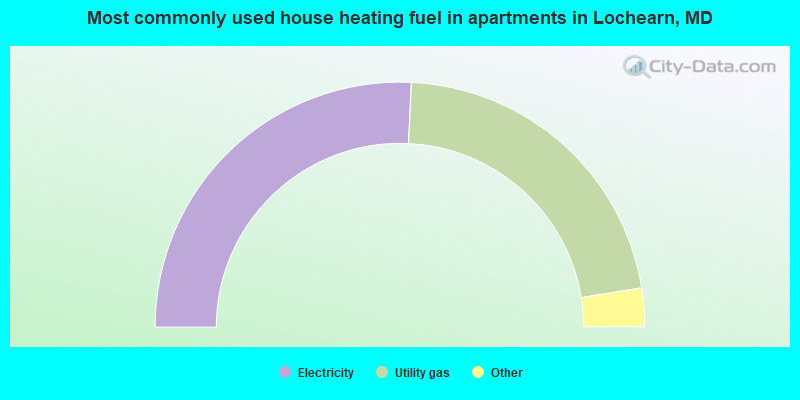
House heating fuel used in apartments - Utility gas (%)
House heating fuel used in apartments - Bottled, tank, or LP gas (%)
House heating fuel used in apartments - Electricity (%)
House heating fuel used in apartments - Fuel oil, kerosene, etc. (%)
House heating fuel used in apartments - Coal or coke (%)
House heating fuel used in apartments - Wood (%)
House heating fuel used in apartments - Solar energy (%)
House heating fuel used in apartments - Other fuel (%)
House heating fuel used in apartments - No fuel used (%)
Latest news about housing in Lochearn, MD collected exclusively by city-data.com from local newspapers, TV, and radio stations
Median year house/condo built: 1957Median year apartment built: 1975Household type by relationship:
Households: 26,932
Male householders: 4,333 (1,590 living alone ), Female householders: 5,915 (1,780 living alone )3,566 spouses (3,527 opposite-sex spouses ), 331 unmarried partners , (318 opposite-sex unmarried partners ), 8,498 children (7,820 natural , 119 adopted , 557 stepchildren ), 1,506 grandchildren , 474 brothers or sisters , 407 parents , 19 foster children , 904 other relatives , 712 non-relatives In group quarters: 262
Size of family households: 2,663 2-persons , 1,770 3-persons , 1,201 4-persons , 437 5-persons , 380 6-persons , 132 7-or-more-persons .
Size of nonfamily households: 3,510 1-person , 472 2-persons , 17 3-persons , 2 4-persons .
2,939 married couples with children. single-parent households (408 men , 1,431 women ).
85.1% of residents of Lochearn speak English at home. of residents speak Spanish at home (46% speak English very well , 13% speak English well , 30% speak English not well , 11% don't speak English at all ).of residents speak other Indo-European language at home (66% speak English very well , 23% speak English well , 11% speak English not well ).of residents speak Asian or Pacific Island language at home (100% speak English very well ).of residents speak other language at home (79% speak English very well , 18% speak English well , 2% speak English not well ).
Foreign born population: 4,157 (15.4%)of them are naturalized citizens )
Median number of rooms in houses and condos:
Median number of rooms in apartments
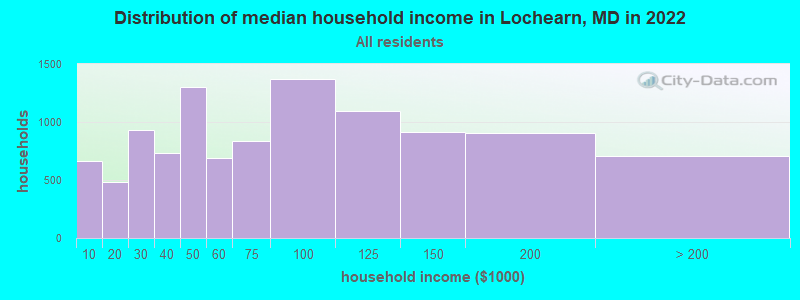
Lochearn, MD household income distribution 667 Less than $10,000487 $10,000 to $19,999928 $20,000 to $29,999730 $30,000 to $39,9991,300 $40,000 to $49,999690 $50,000 to $59,999837 $60,000 to $74,9991,373 $75,000 to $99,9991,091 $100,000 to $124,999914 $125,000 to $149,999901 $150,000 to $199,999705 $200,000 or more
Home value of owner - occupied houses in 2022 in Lochearn, MD 80 Less than $10,00022 $15,000 to $19,99913 $20,000 to $24,99927 $25,000 to $29,99912 $30,000 to $34,99917 $40,000 to $49,99939 $50,000 to $59,99947 $60,000 to $69,99921 $80,000 to $89,9995 $90,000 to $99,999139 $100,000 to $124,999123 $125,000 to $149,999370 $150,000 to $174,999411 $175,000 to $199,9991,872 $200,000 to $249,9991,513 $250,000 to $299,9991,911 $300,000 to $399,999181 $400,000 to $499,99960 $500,000 to $749,99935 $750,000 to $999,99918 $1,000,000 to $1,499,99917 $1,500,000 to $1,999,99934 $2,000,000 or moreRent paid by renters in 2022 in Lochearn, MD 11 $100 to $14935 $200 to $24912 $250 to $2995 $400 to $44916 $500 to $54966 $750 to $799139 $800 to $899217 $900 to $9991,428 $1,000 to $1,249799 $1,250 to $1,499212 $1,500 to $1,99940 $2,000 to $2,49924 $2,500 to $2,99916 $3,000 to $3,49914 $3,500 or more143 No cash rent
Percentage of workers working in this county: 50.3%Number of people working at home: 1,174 (9.1% of all workers )
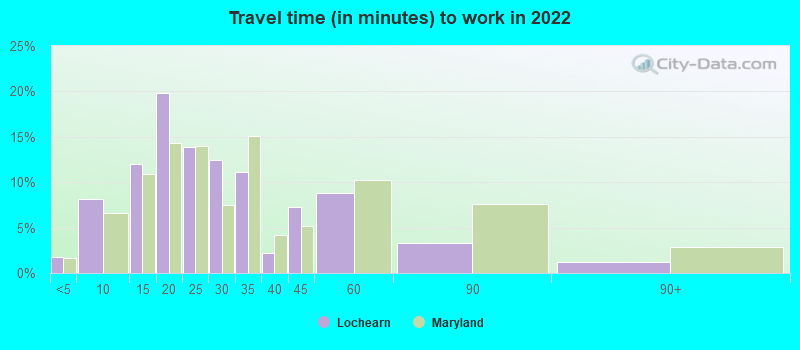
Travel time to work (commute)
Less than 5 minutes: 835 to 9 minutes: 42810 to 14 minutes: 1,08215 to 19 minutes: 1,48920 to 24 minutes: 2,34925 to 29 minutes: 1,40430 to 34 minutes: 1,96335 to 39 minutes: 47840 to 44 minutes: 50745 to 59 minutes: 66460 to 89 minutes: 90790 or more minutes: 155
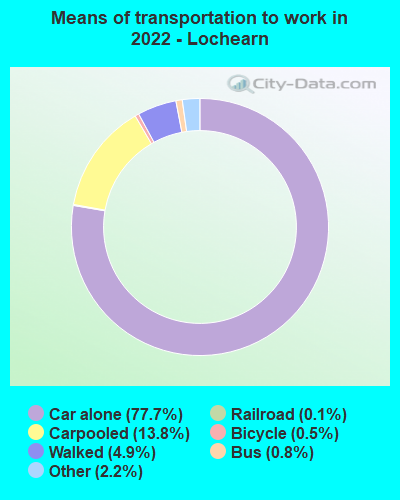
Means of transportation to work:
Drove a car alone: 1,323 (49.1%)Carpooled: 268 (10.0%)Bus : 8 (0.3%)Light rail, streetcar or trolley : 2 (0.1%)Taxi: 45 (1.7%)Bicycle: 6 (0.2%)Walked: 93 (3.5%)Worked at home: 1,174 (43.6%)
Unemployment by race in 2022
Unemployment rate for White non-Hispanic residents 2.6% Males3.4% FemalesUnemployment rate for Black residents 4.9% Males5.9% FemalesUnemployment rate for other race residents 1.9% Males6.8% FemalesUnemployment rate for two or more race residents 9.7% MalesUnemployment rate for Hispanic or Latino residents 3.1% Males3.5% Females
Year of entry for the foreign-born population in Lochearn, Maryland
2,286 2010 or later 1,129 2000 to 2009 366 1990 to 1999 503 1980 to 1989 228 1970 to 1979 176 Before 1970
First ancestries reported:
African: 725 (3.8%)
Kenyan: 678 (3.5%)
American: 509 (2.6%)
Nigerian: 507 (2.6%)
Jamaican: 427 (2.2%)
Trinidadian and Tobagonian: 221 (1.2%)
Irish: 185 (1.0%)
German: 177 (0.9%)
English: 148 (0.8%)
Liberian: 119 (0.6%)
British West Indian: 65 (0.3%)
Eastern European: 62 (0.3%)
Polish: 61 (0.3%)
Scottish: 60 (0.3%)
Ghanaian: 47 (0.2%)
European: 38 (0.2%)
Swedish: 31 (0.2%)
Italian: 20 (0.1%)
Haitian: 19 (0.10%)
British: 17 (0.09%)
Serbian: 16 (0.08%)
Russian: 15 (0.08%)
South African: 14 (0.07%)
Hungarian: 13 (0.07%)
Canadian: 10 (0.05%)
Lithuanian: 9 (0.05%)
Brazilian: 8 (0.04%)
Scotch-Irish: 7 (0.04%)
Slovene: 6 (0.03%)
West Indian: 6 (0.03%)
Ukrainian: 4 (0.02%)
French: 2 (0.01%) Most common places of birth for foreign-born residents (%): El Salvador Lochearn:
17.2% (722)Maryland:
12.0% (115,412)
Nigeria Lochearn:
13.9% (582)Maryland:
4.6% (44,825)
Jamaica Lochearn:
10.1% (423)Maryland:
2.8% (27,444)
Kenya Lochearn:
7.5% (312)Maryland:
0.8% (7,497)
Trinidad and Tobago Lochearn:
7.0% (293)Maryland:
1.2% (11,481)
Cameroon Lochearn:
6.2% (261)Maryland:
2.5% (23,969)
Africa, n.e.c. Lochearn:
5.4% (225)Maryland:
0.5% (4,689)
Liberia Lochearn:
3.5% (146)Maryland:
0.6% (5,959)
Other Western Africa Lochearn:
2.7% (115)Maryland:
0.7% (6,317)
Pakistan Lochearn:
2.6% (107)Maryland:
1.8% (17,037)
Mexico Lochearn:
1.9% (80)Maryland:
3.5% (34,065)
Guatemala Lochearn:
1.7% (71)Maryland:
4.4% (42,350)
Place of birth for U.S.-born residents:
This state: 17,232Other state: 5,292Northeast: 1,706Midwest: 423South: 2,933West: 235 90.7% of Lochearn residents lived in the same house 1 years ago.
Out of people who lived in different houses, 35.4% lived in this county.
Out of people who lived in different counties, 37.7% lived in Maryland.
Lochearn:
90.7%State average:
88.5%
Education attainment for males 25 years and older:
No schooling: 138Nursery to 4th grade: 75th and 6th grade: 837th and 8th grade: 549th grade: 20110th grade: 13811th grade: 9312th grade, no diploma: 115High school graduate (or equivalency): 2,584Less than 1 year of college: 640Some college more than 1 year, no degree: 1,470Associate degree: 672Bachelor's degree: 1,531Master's degree: 571Professional school degree: 78Doctorate degree: 250
Education attainment for females 25 years and older:
No schooling: 251Nursery to 4th grade: 345th and 6th grade: 117th and 8th grade: 419th grade: 7410th grade: 7911th grade: 13812th grade, no diploma: 161High school graduate (or equivalency): 2,484Less than 1 year of college: 818Some college more than 1 year, no degree: 1,209Associate degree: 879Bachelor's degree: 2,137Master's degree: 1,419Professional school degree: 235Doctorate degree: 73
Housing units in structures:
One, detached: 6,708One, attached: 1,088Two: 1543 or 4: 1605 to 9: 1,16010 to 19: 1,09320 to 49: 9850 or more: 404Mobile homes: 14Boats, RVs, vans, etc.: 16Housing units lacking complete plumbing facilities in 2022: 0.6%Housing units lacking complete kitchen facilities in 2022: 1.4%House/condo owner moved in on average 18 years ago
Renter moved in on average 3 years ago
Private vs. public school enrollment:
Students in private schools in grades 1 to 8 (elementary and middle school): 308 Students in private schools in grades 9 to 12 (high school): 103 Students in private undergraduate colleges: 251