Housing density: 203 houses/condos per square mile
Median price asked for vacant for-sale houses and condos in 2022 in this county: $1,068,910.
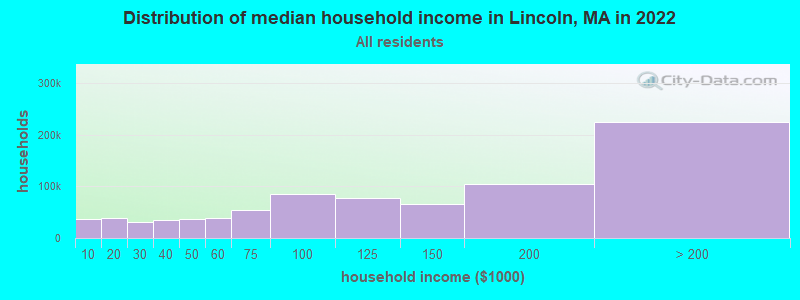
Median contract rent in 2022: over $2,000 (lower quartile is $1,793, upper quartile is over $2,000)
Median gross rent in Lincoln, MA in 2022: over $2,000
Housing units in Lincoln with a mortgage: 961 (46 second mortgage, 163 home equity loan, 0 both second mortgage and home equity loan) Houses without a mortgage: 465
Compare current foreclosures near Lincoln, MA:
#1
Lexington Rd
Lincoln, MA 01773
2,633
sq. feet
1
baths
3
beds
#2
Bedford Rd
Lincoln, MA 01773
1,782
sq. feet
2
baths
4
beds
#3
Bedford Ln
Lincoln, MA 01773
2,372
sq. feet
2
baths
4
beds
#4
Reiling Pond Rd
Lincoln, MA 01773
4,875
sq. feet
4
baths
5
beds
#5
$650,000
Boyd St
Boston, MA 02124
3,970
sq. feet
3
baths
9
beds
#6
$418,000
Stillman St
Framingham, MA 01702
1,122
sq. feet
1
baths
2
beds
#7
Church St
Boston, MA 02122
3,663
sq. feet
3
baths
6
beds
#8
Crestway Rd
Boston, MA 02128
1,370
sq. feet
2
baths
4
beds
#9
Grv St
Needham, MA 02492
6,542
sq. feet
4
baths
6
beds
#10
Congress Pl
Dedham, MA 02026
1,966
sq. feet
2
baths
4
beds
#11
Pierce St
Reading, MA 01867
1,837
sq. feet
2
baths
4
beds
#12
Sugar Rd
Bolton, MA 01740
1,988
sq. feet
2
baths
3
beds
#13
Harvard St
Lowell, MA 01851
2,676
sq. feet
2
baths
4
beds
#14
Belvoir Rd
Milton, MA 02186
2,528
sq. feet
2
baths
4
beds
#15
Bridge St
Lowell, MA 01850
-
sq. feet
1
baths
3
beds
#16
Magnolia St
Boston, MA 02125
3,654
sq. feet
3
baths
6
beds
#17
Bower St
Medford, MA 02155
2,323
sq. feet
2
baths
4
beds
#18
Lyons St
Lowell, MA 01852
1,314
sq. feet
1
baths
2
beds
#19
Goodnow Ln
Framingham, MA 01702
2,342
sq. feet
2
baths
4
beds
#20
Great Rd
Stow, MA 01775
2,026
sq. feet
2
baths
3
beds
#21
Fenwick St
Revere, MA 02151
2,080
sq. feet
1
baths
3
beds
#22
Brahms St
Roslindale, MA 02131
1,604
sq. feet
1
baths
4
beds
#23
3rd Ave
North Chelmsford, MA 01863
-
sq. feet
1
baths
2
beds
#24
Gilbert Rd
Needham, MA 02492
1,778
sq. feet
2
baths
3
beds
#25
Savin Hill Avenue, Unit 2 190 Savin Hill Avenue Condominium
In family households: 1,161,600 (250,263 male householders, 116,393 female householders)
287,332 spouses, 410,462 children (392,286 natural, 9,871 adopted, 8,305 stepchildren), 16,644 grandchildren, 14,569 brothers or sisters, 15,064 parents, foster children, 15,023 other relatives, 25,838 non-relatives
In nonfamily households: 286,073 (95,244 male householders (67,197 living alone)), 118,788 female householders (94,319 living alone)), 72,041 nonrelatives
In group quarters: 55,412 (13,773 institutionalized population)
252,928 married couples with children.
55,356 single-parent households (9,721 men, 45,635 women).
90.3% of residents of Lincoln speak English at home.
2.2% of residents speak Spanish at home (64% speak English very well, 36% speak English well).
4.0% of residents speak other Indo-European language at home (71% speak English very well, 15% speak English well, 14% speak English not well).
3.1% of residents speak Asian or Pacific Island language at home (88% speak English very well, 7% speak English well, 3% speak English not well, 3% don't speak English at all).
0.3% of residents speak other language at home (100% speak English very well).
Foreign born population: 922 (10.4%)
(79.1% of them are naturalized citizens)
Year of entry for the foreign-born population in Lincoln, Massachusetts
591995 to March 2000
351990 to 1994
841985 to 1989
551980 to 1984
421975 to 1979
641970 to 1974
411965 to 1969
172Before 1965
First ancestries reported:
Other: 1,732 (17.8%)
English: 1,709 (17.6%)
Irish: 1,351 (13.9%)
German: 1,173 (12.0%)
Italian: 1,068 (11.0%)
United States: 551 (5.7%)
Scottish: 344 (3.5%)
French: 269 (2.8%)
Polish: 234 (2.4%)
Russian: 219 (2.2%)
Swedish: 141 (1.4%)
Welsh: 128 (1.3%)
French Canadian: 114 (1.2%)
Dutch: 111 (1.1%)
Hungarian: 83 (0.9%)
Czech: 82 (0.8%)
Scotch-Irish: 81 (0.8%)
Greek: 62 (0.6%)
Norwegian: 54 (0.6%)
West Indian: 49 (0.5%)
Danish: 35 (0.4%)
Subsaharan African: 31 (0.3%)
Swiss: 31 (0.3%)
Slovak: 21 (0.2%)
Ukrainian: 20 (0.2%)
Portuguese: 19 (0.2%)
Lithuanian: 15 (0.2%)
Arab: 8 (0.08%)
Most common places of birth for foreign-born residents (%):
United Kingdom
Lincoln:
15.9% (88)
Massachusetts:
3.3% (25,403)
China, excluding Hong Kong and Taiwan
Lincoln:
12.0% (66)
Massachusetts:
5.1% (39,255)
Taiwan
Lincoln:
9.1% (50)
Massachusetts:
0.9% (7,258)
Greece
Lincoln:
6.0% (33)
Massachusetts:
1.7% (12,975)
Japan
Lincoln:
5.4% (30)
Massachusetts:
1.1% (8,682)
Haiti
Lincoln:
4.7% (26)
Massachusetts:
4.4% (33,862)
Sweden
Lincoln:
3.6% (20)
Massachusetts:
0.3% (2,135)
Hungary
Lincoln:
3.6% (20)
Massachusetts:
0.2% (1,710)
Thailand
Lincoln:
3.4% (19)
Massachusetts:
0.6% (4,578)
Germany
Lincoln:
3.3% (18)
Massachusetts:
1.9% (14,883)
Korea
Lincoln:
3.3% (18)
Massachusetts:
1.7% (13,456)
Philippines
Lincoln:
3.1% (17)
Massachusetts:
1.0% (7,414)
Indonesia
Lincoln:
2.9% (16)
Massachusetts:
0.2% (1,303)
Canada
Lincoln:
2.7% (15)
Massachusetts:
5.2% (40,247)
Italy
Lincoln:
2.4% (13)
Massachusetts:
3.7% (28,319)
Mexico
Lincoln:
2.2% (12)
Massachusetts:
1.0% (7,867)
Australia
Lincoln:
2.0% (11)
Massachusetts:
0.2% (1,855)
Czechoslovakia (includes Czech Republic and Slovakia)
Lincoln:
1.6% (9)
Massachusetts:
0.3% (1,943)
Hong Kong
Lincoln:
1.6% (9)
Massachusetts:
1.0% (7,937)
Nigeria
Lincoln:
1.6% (9)
Massachusetts:
0.4% (3,374)
Place of birth for U.S.-born residents:
This state: 3,030
Other state: 4,262
Northeast: 1,731
Midwest: 919
South: 978
West: 634
49% of Lincoln residents lived in the same house 5 years ago. Out of people who lived in different houses, 26% lived in this county. Out of people who lived in different counties, 15% lived in Massachusetts.
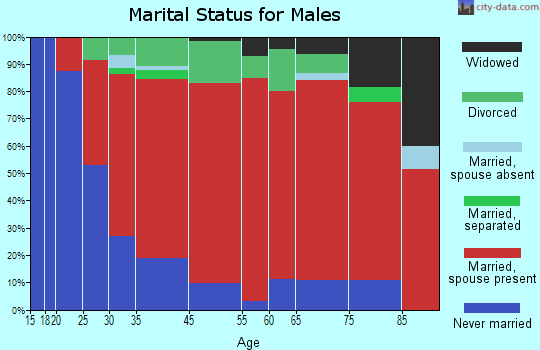
Education attainment for males 25 years and older:
No schooling: 0
Nursery to 4th grade: 0
5th and 6th grade: 0
7th and 8th grade: 8
9th grade: 0
10th grade: 0
11th grade: 0
12th grade, no diploma: 17
High school graduate (or equivalency): 134
Less than 1 year of college: 119
Some college more than 1 year, no degree: 214
Associate degree: 194
Bachelor's degree: 616
Master's degree: 684
Professional school degree: 275
Doctorate degree: 183
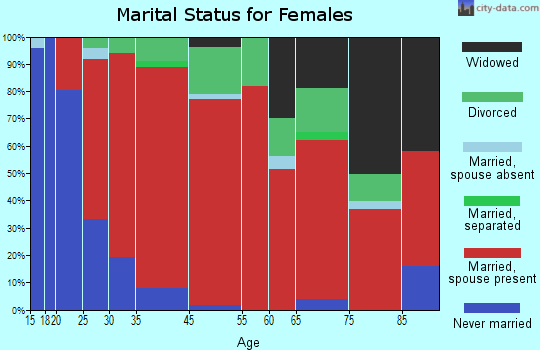
Education attainment for females 25 years and older:
No schooling: 8
Nursery to 4th grade: 0
5th and 6th grade: 0
7th and 8th grade: 0
9th grade: 6
10th grade: 10
11th grade: 0
12th grade, no diploma: 16
High school graduate (or equivalency): 200
Less than 1 year of college: 121
Some college more than 1 year, no degree: 345
Associate degree: 194
Bachelor's degree: 850
Master's degree: 697
Professional school degree: 134
Doctorate degree: 123
Housing units in structures:
One, detached: 1,568
One, attached: 832
Two: 56
3 or 4: 291
5 to 9: 84
10 to 19: 34
20 to 49: 40
50 or more: 6
Housing units lacking complete plumbing facilities: 0.2%