Lehigh Acres, FL (Florida) Houses and Residents
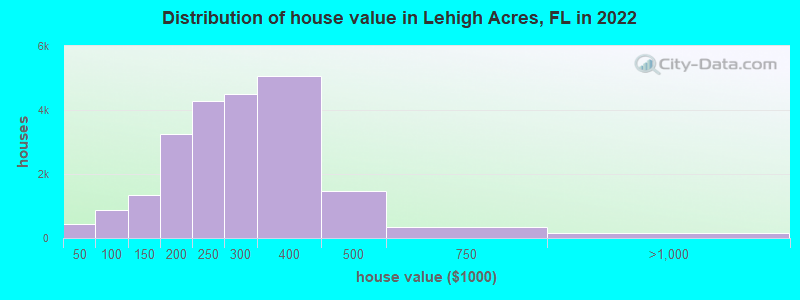
Estimated median house or condo value in 2022: $294,800 (it was $78,600 in 2000 )
Lehigh Acres:
$294,800Florida:
$354,100
Lower value quartile - upper value quartile: $236,300 - $367,800Mean price in 2022: Detached houses: $235,228 Here:
$235,228State:
$500,941
Townhouses or other attached units: $209,857 Here:
$209,857State:
$370,869
In 2-unit structures: $172,084 Here:
$172,084State:
$423,188
In 3-to-4-unit structures: $127,156 Here:
$127,156State:
$309,944
In 5-or-more-unit structures: $176,258 Here:
$176,258State:
$447,145
Mobile homes: $94,008 Here:
$94,008State:
$113,202
Total population: 86,784 (Urban population: 27,127 (all inside urban clusters), Rural population: 6,015 (28 farm, 5,987 nonfarm ))
Houses: 46,548 (43,929 occupied: 31,421 owner occupied, 12,508 renter occupied )
% of renters here:
28%State:
33%
Housing density: 491 houses/condos per square mile
Median price asked for vacant for-sale houses and condos in 2022: $215,524.
Median contract rent in 2022: $1,340 (lower quartile is $1,092, upper quartile is $1,551)
Median rent asked for vacant for-rent units in 2022: $1,016
Median gross rent in Lehigh Acres, FL in 2022: $1,598
Housing units in Lehigh Acres with a mortgage: 22,200 (1,501 second mortgage, 537 home equity loan, 607 both second mortgage and home equity loan )Houses without a mortgage: 122
Median household income for houses/condos with a mortgage: $72,278
Median household income for apartments without a mortgage: $58,632
Median monthly housing costs: $1,345
Data:
Median house or condo value ($)
Median house or condo value ($ change since 2000)
Median house or condo value ($) - White
Median house or condo value ($) - Black or African American
Median house or condo value ($) - Asian
Median house or condo value ($) - Hispanic or Latino
Median house or condo value ($) - American Indian and Alaska Native
Median house or condo value ($) - Multirace
Median house or condo value ($) - Other Race
Median price asked for mobile homes ($)
Household density (households per square mile)
Mean house or condo value by units in structure - 1, detached ($)
Mean house or condo value by units in structure - 1, attached ($)
Mean house or condo value by units in structure - 2 ($)
Mean house or condo value by units in structure by units in structure - 3 or 4 ($)
Mean house or condo value by units in structure - 5 or more ($)
Mean house or condo value by units in structure - Boat, RV, van, etc. ($)
Mean house or condo value by units in structure - Mobile home ($)
Median contract rent ($)
Median contract rent - Lower quartile ($)
Median contract rent - Upper quartile ($)
Median gross rent ($)
Urban houses (%)
Rural houses (%)
Houses occupied (%)
Houses occupied (% change since 2000)
Houses owner occupied (%)
Houses owner occupied (% change since 2000)
Houses renter occupied (%)
Houses renter occupied (% change since 2000)
Vacant housing units - For rent (%)
Vacant housing units - For rent (% change since 2000)
Vacant housing units - For sale only (%)
Vacant housing units - For sale only (% change since 2000)
Vacant housing units - Rented or sold, not occupied (%)
Vacant housing units - Rented or sold, not occupied (% change since 2000)
Vacant housing units - For seasonal, recreational, or occasional use (%)
Vacant housing units - For seasonal, recreational, or occasional use (% change since 2000)
Vacant housing units - For migrant workers (%)
Vacant housing units - For migrant workers (% change since 2000)
Vacant housing units - Other vacant (%)
Vacant housing units - Other vacant (% change since 2000)
Median monthly housing costs ($)
Median household income for houses/condos with a mortgage ($)
Median household income for houses/condos without a mortgage ($)
Median household income ($)
Median household income ($) - White
Median household income ($) - Black or African American
Median household income ($) - Asian
Median household income ($) - Hispanic or Latino
Median household income ($) - American Indian and Alaska Native
Median household income ($) - Multirace
Median household income ($) - Other Race
Mortgage status - with mortgage (%)
Mortgage status - with second mortgage (%)
Mortgage status - with home equity loan (%)
Mortgage status - with both second mortgage and home equity loan (%)
Mortgage status - without a mortgage (%)
Median year house/condo built
Median year apartment built
Household type by relationship - Male householder living alone (%)
Household type by relationship - Male householder not living alone (%)
Household type by relationship - Female householder living alone (%)
Household type by relationship - Female householder not living alone (%)
Household type by relationship - Opposite-Sex spouse (%)
Household type by relationship - Same-Sex spouse (%)
Household type by relationship - Opposite-Sex unmarried partner (%)
Household type by relationship - Same-Sex unmarried partner (%)
Household type by relationship - In group quarters (%)
Size of family households - 2-person household (%)
Size of family households - 3-person household (%)
Size of family households - 4-person household (%)
Size of family households - 5-person household (%)
Size of family households - 6-person household (%)
Size of family households - 7-or-more-person household (%)
Size of nonfamily households - 1-person household (%)
Size of nonfamily households - 2-person household (%)
Size of nonfamily households - 3-person household (%)
Size of nonfamily households - 4-person household (%)
Size of nonfamily households - 5-person household (%)
Size of nonfamily households - 6-person household (%)
Size of nonfamily households - 7-or-moreperson household (%)
Year house built - Built 2010 or later (%)
Year house built - Built 2000 to 2009 (%)
Year house built - Built 1990 to 1999 (%)
Year house built - Built 1980 to 1989 (%)
Year house built - Built 1970 to 1979 (%)
Year house built - Built 1960 to 1969 (%)
Year house built - Built 1950 to 1959 (%)
Year house built - Built 1940 to 1949 (%)
Year house built - Built 1939 or earlier (%)
Median number of rooms in houses and condos
Median number of rooms in apartments
Median number of bedrooms in owner occupied houses
Mean number of bedrooms in owner occupied houses
Median number of bedrooms in renter occupied houses
Mean number of bedrooms in renter occupied houses
Median number of vehichles in owner occupied houses
Mean number of vehichles in owner occupied houses
Median number of vehichles in renter occupied houses
Mean number of vehichles in renter occupied houses
Rooms in owner-occupied houses - 1 room (%)
Rooms in owner-occupied houses - 2 rooms (%)
Rooms in owner-occupied houses - 3 rooms (%)
Rooms in owner-occupied houses - 4 rooms (%)
Rooms in owner-occupied houses - 5 rooms (%)
Rooms in owner-occupied houses - 6 rooms (%)
Rooms in owner-occupied houses - 7 rooms (%)
Rooms in owner-occupied houses - 8 rooms (%)
Rooms in owner-occupied houses - 9+ rooms (%)
Rooms in renter-occupied houses - 1 room (%)
Rooms in renter-occupied houses - 2 rooms (%)
Rooms in renter-occupied houses - 3 rooms (%)
Rooms in renter-occupied houses - 4 rooms (%)
Rooms in renter-occupied houses - 5 rooms (%)
Rooms in renter-occupied houses - 6 rooms (%)
Rooms in renter-occupied houses - 7 rooms (%)
Rooms in renter-occupied houses - 8 rooms (%)
Rooms in renter-occupied houses - 9+ rooms (%)
Bedrooms in owner-occupied houses - no bedrooms (%)
Bedrooms in owner-occupied houses - 1 bedroom (%)
Bedrooms in owner-occupied houses - 2 bedrooms (%)
Bedrooms in owner-occupied houses - 3 bedrooms (%)
Bedrooms in owner-occupied houses - 4 bedrooms (%)
Bedrooms in owner-occupied houses - 5+ bedrooms (%)
Bedrooms in renter-occupied houses - no bedrooms (%)
Bedrooms in renter-occupied houses - 1 bedroom (%)
Bedrooms in renter-occupied houses - 2 bedrooms (%)
Bedrooms in renter-occupied houses - 3 bedrooms (%)
Bedrooms in renter-occupied houses - 4 bedrooms (%)
Bedrooms in renter-occupied houses - 5+ bedrooms (%)
Vehicles available in owner-occupied houses - no vehicle available (%)
Vehicles available in owner-occupied houses - 1 vehicle available(%)
Vehicles available in owner-occupied houses - 2 Vehicles available (%)
Vehicles available in owner-occupied houses - 3 Vehicles available (%)
Vehicles available in owner-occupied houses - 4 Vehicles available (%)
Vehicles available in owner-occupied houses - 5+ Vehicles available (%)
Vehicles available in renter-occupied houses - no vehicle available (%)
Vehicles available in renter-occupied houses - 1 vehicle available (%)
Vehicles available in renter-occupied houses - 2 Vehicles available (%)
Vehicles available in renter-occupied houses - 3 Vehicles available (%)
Vehicles available in renter-occupied houses - 4 Vehicles available (%)
Vehicles available in renter-occupied houses - 5+ Vehicles available (%)
Housing units in structures - 1, detached (%)
Housing units in structures - 1, attached (%)
Housing units in structures - 2 (%)
Housing units in structures - 3 or 4 (%)
Housing units in structures - 5 to 9 (%)
Housing units in structures - 10 to 19 (%)
Housing units in structures - 20 to 49 (%)
Housing units in structures - 50 or more (%)
Housing units in structures - Mobile home (%)
Housing units in structures - Boat, RV, van, etc. (%)
Housing units in structures - Owners - 1, detached (%)
Housing units in structures - Owners - 1, attached (%)
Housing units in structures - Owners - 2 (%)
Housing units in structures - Owners - 3 or 4 (%)
Housing units in structures - Owners - 5 to 9 (%)
Housing units in structures - Owners - 10 to 19 (%)
Housing units in structures - Owners - 20 to 49 (%)
Housing units in structures - Owners - 50 or more (%)
Housing units in structures - Owners - Mobile home (%)
Housing units in structures - Owners - Boat, RV, van, etc. (%)
Housing units in structures - Renters - 1, detached (%)
Housing units in structures - Renters - 1, attached (%)
Housing units in structures - Renters - 2 (%)
Housing units in structures - Renters - 3 or 4 (%)
Housing units in structures - Renters - 5 to 9 (%)
Housing units in structures - Renters - 10 to 19 (%)
Housing units in structures - Renters - 20 to 49 (%)
Housing units in structures - Renters - 50 or more (%)
Housing units in structures - Renters - Mobile home (%)
Housing units in structures - Renters - Boat, RV, van, etc. (%)
House/condo owner moved in on average (years ago)
Renter moved in on average (years ago)
Year householder moved into unit - Moved in 1999 to March 2000 (%)
Year householder moved into unit - Moved in 1999 to March 2000 (%) - White
Year householder moved into unit - Moved in 1999 to March 2000 (%) - Black or African American
Year householder moved into unit - Moved in 1999 to March 2000 (%) - Asian
Year householder moved into unit - Moved in 1999 to March 2000 (%) - Hispanic or Latino
Year householder moved into unit - Moved in 1999 to March 2000 (%) - American Indian and Alaska Native
Year householder moved into unit - Moved in 1999 to March 2000 (%) - Multirace
Year householder moved into unit - Moved in 1999 to March 2000 (%) - Other Race
Year householder moved into unit - Moved in 1995 to 1998 (%)
Year householder moved into unit - Moved in 1995 to 1998 (%) - White
Year householder moved into unit - Moved in 1995 to 1998 (%) - Black or African American
Year householder moved into unit - Moved in 1995 to 1998 (%) - Asian
Year householder moved into unit - Moved in 1995 to 1998 (%) - Hispanic or Latino
Year householder moved into unit - Moved in 1995 to 1998 (%) - American Indian and Alaska Native
Year householder moved into unit - Moved in 1995 to 1998 (%) - Multirace
Year householder moved into unit - Moved in 1995 to 1998 (%) - Other Race
Year householder moved into unit - Moved in 1990 to 1994 (%)
Year householder moved into unit - Moved in 1990 to 1994 (%) - White
Year householder moved into unit - Moved in 1990 to 1994 (%) - Black or African American
Year householder moved into unit - Moved in 1990 to 1994 (%) - Asian
Year householder moved into unit - Moved in 1990 to 1994 (%) - Hispanic or Latino
Year householder moved into unit - Moved in 1990 to 1994 (%) - American Indian and Alaska Native
Year householder moved into unit - Moved in 1990 to 1994 (%) - Multirace
Year householder moved into unit - Moved in 1990 to 1994 (%) - Other Race
Year householder moved into unit - Moved in 1980 to 1989 (%)
Year householder moved into unit - Moved in 1980 to 1989 (%) - White
Year householder moved into unit - Moved in 1980 to 1989 (%) - Black or African American
Year householder moved into unit - Moved in 1980 to 1989 (%) - Asian
Year householder moved into unit - Moved in 1980 to 1989 (%) - Hispanic or Latino
Year householder moved into unit - Moved in 1980 to 1989 (%) - American Indian and Alaska Native
Year householder moved into unit - Moved in 1980 to 1989 (%) - Multirace
Year householder moved into unit - Moved in 1980 to 1989 (%) - Other Race
Year householder moved into unit - Moved in 1970 to 1979 (%)
Year householder moved into unit - Moved in 1970 to 1979 (%) - White
Year householder moved into unit - Moved in 1970 to 1979 (%) - Black or African American
Year householder moved into unit - Moved in 1970 to 1979 (%) - Asian
Year householder moved into unit - Moved in 1970 to 1979 (%) - Hispanic or Latino
Year householder moved into unit - Moved in 1970 to 1979 (%) - American Indian and Alaska Native
Year householder moved into unit - Moved in 1970 to 1979 (%) - Multirace
Year householder moved into unit - Moved in 1970 to 1979 (%) - Other Race
Year householder moved into unit - Moved in 1969 or earlier (%)
Year householder moved into unit - Moved in 1969 or earlier (%) - White
Year householder moved into unit - Moved in 1969 or earlier (%) - Black or African American
Year householder moved into unit - Moved in 1969 or earlier (%) - Asian
Year householder moved into unit - Moved in 1969 or earlier (%) - Hispanic or Latino
Year householder moved into unit - Moved in 1969 or earlier (%) - American Indian and Alaska Native
Year householder moved into unit - Moved in 1969 or earlier (%) - Multirace
Year householder moved into unit - Moved in 1969 or earlier (%) - Other Race
Housing units lacking complete plumbing facilities (%)
Housing units lacking complete kitchen facilities (%)
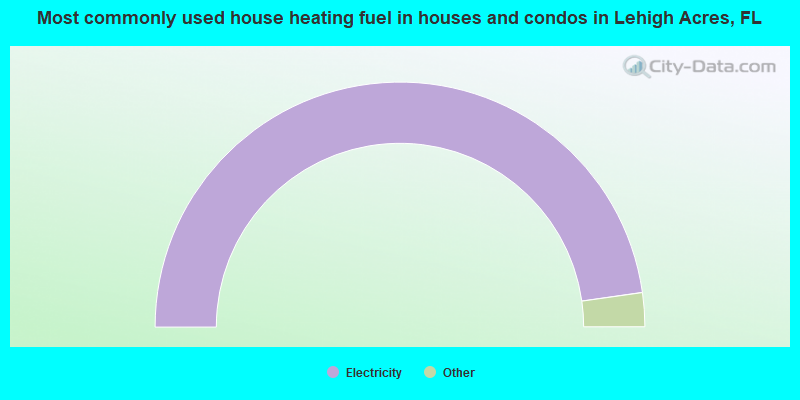
House heating fuel used in houses and condos - Utility gas (%)
House heating fuel used in houses and condos - Bottled, tank, or LP gas (%)
House heating fuel used in houses and condos - Electricity (%)
House heating fuel used in houses and condos - Fuel oil, kerosene, etc. (%)
House heating fuel used in houses and condos - Coal or coke (%)
House heating fuel used in houses and condos - Wood (%)
House heating fuel used in houses and condos - Solar energy (%)
House heating fuel used in houses and condos - Other fuel (%)
House heating fuel used in houses and condos - No fuel used (%)
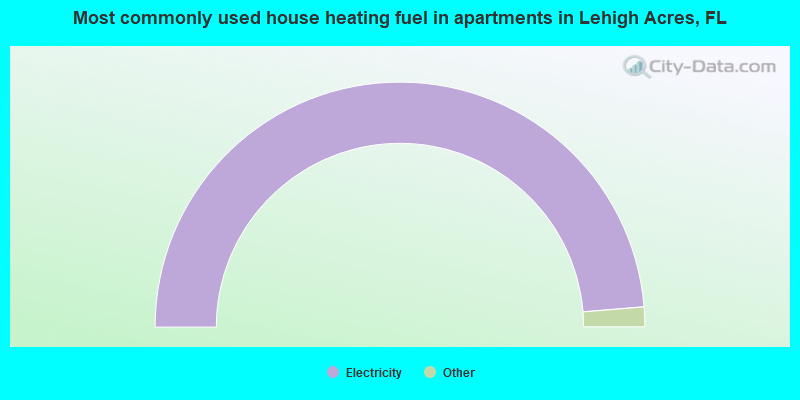
House heating fuel used in apartments - Utility gas (%)
House heating fuel used in apartments - Bottled, tank, or LP gas (%)
House heating fuel used in apartments - Electricity (%)
House heating fuel used in apartments - Fuel oil, kerosene, etc. (%)
House heating fuel used in apartments - Coal or coke (%)
House heating fuel used in apartments - Wood (%)
House heating fuel used in apartments - Solar energy (%)
House heating fuel used in apartments - Other fuel (%)
House heating fuel used in apartments - No fuel used (%)
Median year house/condo built: 2003Median year apartment built: 2003Household type by relationship:
Households: 136,910
Male householders: 23,068 (4,334 living alone ), Female householders: 20,861 (4,399 living alone )22,044 spouses (21,947 opposite-sex spouses ), 5,648 unmarried partners , (5,600 opposite-sex unmarried partners ), 46,172 children (41,955 natural , 1,616 adopted , 2,601 stepchildren ), 4,376 grandchildren , 3,011 brothers or sisters , 5,076 parents , 0 foster children , 4,267 other relatives , 2,055 non-relatives In group quarters: 332
Size of family households: 10,378 2-persons , 7,207 3-persons , 7,946 4-persons , 4,075 5-persons , 2,294 6-persons , 687 7-or-more-persons .
Size of nonfamily households: 8,733 1-person , 2,103 2-persons , 506 3-persons .
20,122 married couples with children. single-parent households (3,135 men , 8,153 women ).
50.8% of residents of Lehigh Acres speak English at home. of residents speak Spanish at home (55% speak English very well , 18% speak English well , 16% speak English not well , 12% don't speak English at all ).of residents speak other Indo-European language at home (66% speak English very well , 17% speak English well , 16% speak English not well , 1% don't speak English at all ).of residents speak Asian or Pacific Island language at home (55% speak English very well , 35% speak English well , 8% speak English not well , 2% don't speak English at all ).of residents speak other language at home (81% speak English very well , 2% speak English well , 12% speak English not well , 5% don't speak English at all ).
Foreign born population: 46,413 (33.9%)of them are naturalized citizens )
Median number of rooms in houses and condos:
Median number of rooms in apartments
Owner-occupied Renter-occupied
Rooms in owner-occupied houses in Lehigh Acres, Florida
43 1 room 160 2 rooms 705 3 rooms 5,357 4 rooms 9,861 5 rooms 6,940 6 rooms 3,289 7 rooms 4,019 8 rooms 1,047 9+ rooms
Rooms in renter-occupied apartments in Lehigh Acres, Florida
156 1 room 106 2 rooms 1,104 3 rooms 2,560 4 rooms 5,145 5 rooms 2,398 6 rooms 624 7 rooms 193 8 rooms 222 9+ rooms
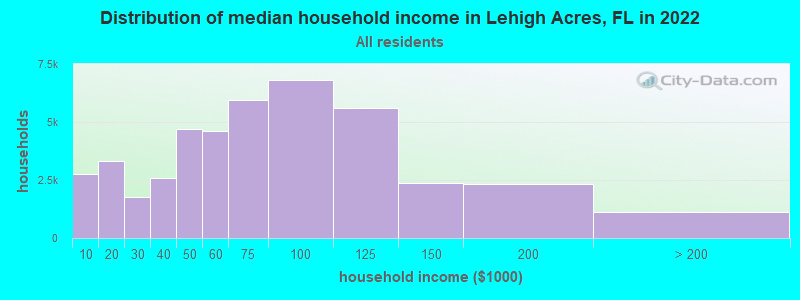
Lehigh Acres, FL household income distribution 2,776 Less than $10,0003,308 $10,000 to $19,9991,748 $20,000 to $29,9992,593 $30,000 to $39,9994,688 $40,000 to $49,9994,628 $50,000 to $59,9995,951 $60,000 to $74,9996,821 $75,000 to $99,9995,597 $100,000 to $124,9992,381 $125,000 to $149,9992,313 $150,000 to $199,9991,125 $200,000 or more
Home value of owner - occupied houses in 2022 in Lehigh Acres, FL 131 Less than $10,00057 $10,000 to $14,99948 $15,000 to $19,99986 $20,000 to $24,99931 $25,000 to $29,99923 $30,000 to $34,99915 $35,000 to $39,99929 $40,000 to $49,99945 $50,000 to $59,99988 $60,000 to $69,999139 $70,000 to $79,999368 $80,000 to $89,999194 $90,000 to $99,999742 $100,000 to $124,999590 $125,000 to $149,9991,836 $150,000 to $174,9991,417 $175,000 to $199,9994,274 $200,000 to $249,9994,514 $250,000 to $299,9995,077 $300,000 to $399,9991,454 $400,000 to $499,999346 $500,000 to $749,99987 $750,000 to $999,99947 $1,000,000 to $1,499,99921 $2,000,000 or moreRent paid by renters in 2022 in Lehigh Acres, FL 18 Less than $10046 $100 to $149262 $150 to $19947 $200 to $249165 $250 to $29966 $300 to $34935 $350 to $399366 $400 to $44932 $450 to $49976 $500 to $54993 $550 to $599229 $600 to $64981 $650 to $699146 $700 to $749196 $750 to $799301 $800 to $899622 $900 to $9992,943 $1,000 to $1,2493,360 $1,250 to $1,4992,447 $1,500 to $1,999245 $2,000 to $2,4999 $2,500 to $2,99911 $3,000 to $3,499303 No cash rent
Percentage of workers working in this county: 84.3%Number of people working at home: 5,089 (8.6% of all workers )
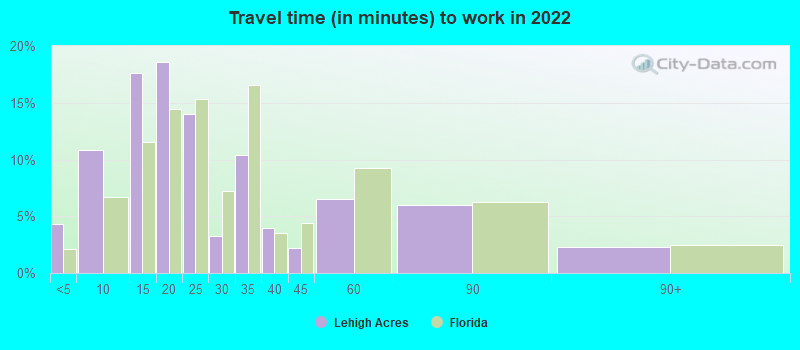
Travel time to work (commute)
Less than 5 minutes: 4285 to 9 minutes: 2,47410 to 14 minutes: 4,00315 to 19 minutes: 4,29720 to 24 minutes: 4,31425 to 29 minutes: 3,09930 to 34 minutes: 11,01835 to 39 minutes: 4,40240 to 44 minutes: 3,22145 to 59 minutes: 8,54060 to 89 minutes: 9,50090 or more minutes: 1,917
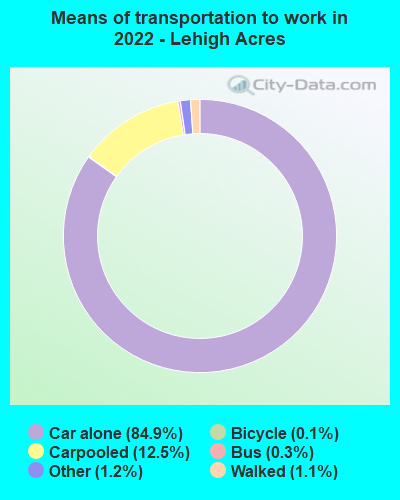
Means of transportation to work:
Drove a car alone: 11,750 (63.2%)Carpooled: 2,109 (11.3%)Bus : 53 (0.3%)Taxi: 113 (0.6%)Bicycle: 10 (0.1%)Walked: 162 (0.9%)Worked at home: 5,089 (27.4%)
Unemployment by race in 2022
Unemployment rate for White non-Hispanic residents 1.4% Males3.4% FemalesUnemployment rate for Black residents 5.8% Males7.6% FemalesUnemployment rate for Asian residents 4.3% FemalesUnemployment rate for other race residents 0.9% Males2.4% FemalesUnemployment rate for two or more race residents 4.6% Males7.4% FemalesUnemployment rate for Hispanic or Latino residents 3.9% Males9.2% Females
Year of entry for the foreign-born population in Lehigh Acres, Florida
17,656 2010 or later 9,502 2000 to 2009 7,370 1990 to 1999 767 1980 to 1989 479 1970 to 1979 883 Before 1970
First ancestries reported:
Haitian: 9,198 (11.5%)
American: 6,081 (7.6%)
German: 2,401 (3.0%)
Italian: 2,380 (3.0%)
English: 2,081 (2.6%)
Jamaican: 1,954 (2.4%)
Irish: 1,832 (2.3%)
Polish: 508 (0.6%)
European: 441 (0.6%)
Brazilian: 380 (0.5%)
French: 320 (0.4%)
Barbadian: 257 (0.3%)
Guyanese: 231 (0.3%)
Scottish: 218 (0.3%)
Canadian: 161 (0.2%)
Norwegian: 154 (0.2%)
Dutch: 148 (0.2%)
African: 142 (0.2%)
Scotch-Irish: 141 (0.2%)
Swedish: 116 (0.1%)
Scandinavian: 116 (0.1%)
Hungarian: 115 (0.1%)
Greek: 111 (0.1%)
British: 109 (0.1%)
Armenian: 95 (0.1%)
Swiss: 93 (0.1%)
Austrian: 87 (0.1%)
Portuguese: 78 (0.10%)
Lebanese: 70 (0.09%)
Czech: 68 (0.09%)
Egyptian: 61 (0.08%)
Danish: 60 (0.08%)
French Canadian: 53 (0.07%)
Trinidadian and Tobagonian: 51 (0.06%)
West Indian: 50 (0.06%)
Lithuanian: 50 (0.06%)
South African: 49 (0.06%)
Russian: 48 (0.06%)
Slavic: 46 (0.06%)
Welsh: 40 (0.05%)
Belgian: 38 (0.05%)
Slovak: 36 (0.05%)
Iranian: 30 (0.04%)
Moroccan: 29 (0.04%)
Romanian: 28 (0.04%)
Northern European: 26 (0.03%)
Ukrainian: 24 (0.03%)
British West Indian: 24 (0.03%)
Eastern European: 21 (0.03%)
Czechoslovakian: 13 (0.02%)
Bulgarian: 12 (0.02%)
Pennsylvania German: 12 (0.02%)
Belizean: 12 (0.02%)
Turkish: 11 (0.01%)
Dutch West Indian: 10 (0.01%)
Bermudan: 9 (0.01%)
Finnish: 9 (0.01%)
Croatian: 7 (0.01%)
Most common places of birth for foreign-born residents (%): Cuba Lehigh Acres:
34.0% (12,823)Florida:
22.0% (1,006,576)
Haiti Lehigh Acres:
17.2% (6,479)Florida:
7.5% (342,375)
Mexico Lehigh Acres:
10.7% (4,042)Florida:
5.6% (257,152)
Dominican Republic Lehigh Acres:
5.0% (1,872)Florida:
3.0% (137,727)
Jamaica Lehigh Acres:
4.7% (1,786)Florida:
5.0% (227,319)
Honduras Lehigh Acres:
3.7% (1,386)Florida:
2.3% (107,160)
Guatemala Lehigh Acres:
2.4% (922)Florida:
2.1% (97,632)
Colombia Lehigh Acres:
1.9% (710)Florida:
6.5% (298,669)
El Salvador Lehigh Acres:
1.6% (604)Florida:
1.1% (49,838)
Brazil Lehigh Acres:
1.6% (598)Florida:
2.7% (122,906)
Place of birth for U.S.-born residents:
This state: 51,217Other state: 33,455Northeast: 11,707Midwest: 9,926South: 7,805West: 4,017 89.6% of Lehigh Acres residents lived in the same house 1 years ago.
Out of people who lived in different houses, 33.5% lived in this county.
Out of people who lived in different counties, 64.9% lived in Florida.
Lehigh Acres:
89.6%State average:
86.3%
Education attainment for males 25 years and older:
No schooling: 1,925Nursery to 4th grade: 7185th and 6th grade: 9287th and 8th grade: 1799th grade: 70810th grade: 70611th grade: 76312th grade, no diploma: 2,048High school graduate (or equivalency): 16,883Less than 1 year of college: 2,160Some college more than 1 year, no degree: 5,739Associate degree: 4,928Bachelor's degree: 5,322Master's degree: 710Professional school degree: 53Doctorate degree: 168
Education attainment for females 25 years and older:
No schooling: 1,063Nursery to 4th grade: 4375th and 6th grade: 8617th and 8th grade: 1,6379th grade: 71610th grade: 74711th grade: 66412th grade, no diploma: 1,368High school graduate (or equivalency): 15,414Less than 1 year of college: 1,558Some college more than 1 year, no degree: 5,266Associate degree: 5,642Bachelor's degree: 6,220Master's degree: 1,975Professional school degree: 35Doctorate degree: 77
Housing units in structures:
One, detached: 39,178One, attached: 3,266Two: 1,4723 or 4: 6245 to 9: 81410 to 19: 16020 to 49: 41950 or more: 408Mobile homes: 145Boats, RVs, vans, etc.: 62Housing units lacking complete plumbing facilities in 2022: 0.1%Housing units lacking complete kitchen facilities in 2022: 0.5%House/condo owner moved in on average 7 years ago
Renter moved in on average 3 years ago
Private vs. public school enrollment:
Students in private schools in grades 1 to 8 (elementary and middle school): 616 Students in private schools in grades 9 to 12 (high school): 97 Students in private undergraduate colleges: 1,368